Depression is the leading cause of disability worldwide (Whiteford et al., Reference Whiteford, Degenhardt, Rehm, Baxter, Ferrari, Erskine and Johns2013) and accounts for 2.74 million deaths globally (Walker, McGee, & Druss, Reference Walker, McGee and Druss2015). Although depression in adults is clinically heterogeneous with varied etiology (Harrington, Rutter, & Fombonne, Reference Harrington, Rutter and Fombonne1996; Kendler, Gardner, & Prescott, Reference Kendler, Gardner and Prescott2002), it is consistently predicted by depression and symptoms of depression in adolescence (Aalto-Setälä, Marttunen, Tuulio-Henriksson, Poikolainen, & Lönnqvist, Reference Aalto-Setälä, Marttunen, Tuulio-Henriksson, Poikolainen and Lönnqvist2002; Roza, Hofstra, van der Ende, & Verhulst, Reference Roza, Hofstra, van der Ende and Verhulst2003), and is one of the most common mental health problems affecting 11% (lifetime prevalence) of teenagers aged 13–18 (Avenevoli, Swendsen, He, Burstein, & Merikangas, Reference Avenevoli, Swendsen, He, Burstein and Merikangas2015). Between 50% and 75% of adult cases of depression began in adolescence (Kessler et al., Reference Kessler, Berglund, Demler, Jin, Merikangas and Walters2005; Kim-Cohen et al., Reference Kim-Cohen, Caspi, Moffitt, Harrington, Milne and Poulton2003), and depressed adolescents are two to seven times more likely to be depressed as adults when compared to nondepressed adolescents (Rutter, Kim-Cohen, & Maughan, Reference Rutter, Kim-Cohen and Maughan2006).
Longitudinal studies suggest that symptoms of depression are low in childhood and increase markedly in early to middle adolescence (Avenevoli et al., Reference Avenevoli, Swendsen, He, Burstein and Merikangas2015; Hankin et al., Reference Hankin, Abramson, Moffitt, Silva, McGee and Angell1998; Roza et al., Reference Roza, Hofstra, van der Ende and Verhulst2003), peaking in late adolescence (age 15–18; Hankin et al., Reference Hankin, Abramson, Moffitt, Silva, McGee and Angell1998). For example, the prevalence of major depressive disorder is almost two times higher among older adolescents than among younger adolescents, and is four times higher in older adolescents than younger adolescents who are severely affected by the disorder (Avenevoli et al., Reference Avenevoli, Swendsen, He, Burstein and Merikangas2015).
Although depression in adolescence seems to beget depression in adulthood, there is considerable heterogeneity in the longitudinal course of the illness. Studies examining trajectories of depressive symptoms across adolescence and into adulthood have identified several subgroups, clustered on the basis of mean symptom levels over time. In a school-based sample of 719 adolescents aged 14–18 years at the first assessment and follow-up seven times until age 30, Yaroslavsky, Pettit, Lewinsohn, Seeley, and Roberts (Reference Yaroslavsky, Pettit, Lewinsohn, Seeley and Roberts2013) identified three trajectories of depression symptoms: a “high stable” group accounting for 32% of the sample, a “moderate decreasing” group accounting for 44%, and a “low decreasing” group consisting of 24% of the sample. Costello, Swendsen, Rose, and Dierker (Reference Costello, Swendsen, Rose and Dierker2008) identified four trajectories of depressed mood from age 12 to 25 in a large national cohort (N = 11,559) assessed three times beginning in Grades 7 to 10 and then again 1 year and then 5 years later. Most (~88%) individuals followed a “no depressed” or “stable low depressed” mood trajectory, 9.5% followed an “early high declining” depressed mood trajectory, and 2.4% followed a “late escalating” depressed mood trajectory. In both studies, being female predicted being in a problematic trajectory (i.e., high or rising) for depressed mood, consistent with many studies demonstrating notable sex differences in rates of depression after puberty (Angold, Costello, & Worthman, Reference Angold, Costello and Worthman1998; Hankin et al., Reference Hankin, Abramson, Moffitt, Silva, McGee and Angell1998; Roza et al., Reference Roza, Hofstra, van der Ende and Verhulst2003). Other predictors of high or increasing symptoms of depression included delinquent behaviour, childhood adversity like poverty, and social problems such as loneliness. These predictors are consistent with Kendler et al.’s (Reference Kendler, Gardner and Prescott2002) comprehensive developmental model of depression, which demonstrated that, for women, the risk for depression was best accounted for by three pathways: early problems with internalizing symptoms, externalizing problems in adolescence, and psychosocial adversity across the life span.
The role perfectionism plays in relation to the etiology, development, and maintenance of depression has recently been examined longitudinally in adolescents (Asseraf & Vaillancourt, Reference Asseraf and Vaillancourt2015; O'Connor, Rasmussen, & Hawton, Reference O'Connor, Rasmussen and Hawton2010) and adults (Békés et al., Reference Békés, Dunkley, Taylor, Zuroff, Lewkowski, Elizabeth Foley and Westreich2015; McGrath et al., Reference McGrath, Sherry, Stewart, Mushquash, Allen, Nealis and Sherry2012), albeit it not over an extended period of time. Perfectionism is a maladaptive personality style (Flett & Hewitt, Reference Flett and Hewitt2002) characterized by self-imposed high standards in which people evaluate themselves on their abilities to meet these erroneously high standards (Shafran, Cooper, & Fairburn, Reference Shafran, Cooper and Fairburn2002). Given how high the bar is set for success, perfectionists often feel that they have failed, and this failure is linked to self-criticism and negative self-appraisal (Shafran et al., Reference Shafran, Cooper and Fairburn2002). Although perfectionism is often portrayed positively by laypersons and often confused with conscientiousness, Flett and Hewitt (Reference Flett and Hewitt2002) argue that there is nothing positive or adaptive about perfectionism. Perfectionism shares many of the same cognitive attribution biases that make individuals vulnerable to depression (Beck, Rush, Shaw, & Emery, Reference Beck, Rush, Shaw and Emery1979) such as dichotomous thinking (i.e., making polarized assumptions about events), overgeneralization (i.e., forming conclusions on the basis of one event), and personalization (i.e., assuming responsibility for events outside one's control; Asseraf & Vaillancourt, Reference Asseraf and Vaillancourt2015). Given these parallels, it is not surprising that perfectionism, like depression (American Psychiatric Association, 2013), is linked to feelings of shame, guilt, failure, worthlessness, low self-esteem, and suicidality (Beorgers, Spirito, & Donaldson, Reference Beorgers, Spirito and Donaldson1998; Hewitt & Flett, Reference Hewitt and Flett1991b).
Perfectionism is multidimensional, and the different dimensions of perfectionism vary in terms of the target and not the behavior (Hewitt & Flett, Reference Hewitt and Flett1991b). Socially prescribed perfectionism refers to the belief that significant others hold high standards and expectations that the person must meet. This type of perfectionism is also linked to the need to appear perfect to others. Self-oriented perfectionism refers to the proclivity of setting high, unachievable standards of performance and to harshly evaluate one's behavior. Other-oriented perfectionism refers to the tendency to impose excessively high standards on others and to place blame when such standards are not met. While all three dimensions of perfectionism are linked to psychological maladjustment, socially prescribed perfectionism and self-oriented perfectionism are linked to depression in youth and adults (Asseraf & Vaillancourt, Reference Asseraf and Vaillancourt2015; Cox & Enns, Reference Cox and Enns2003; Enns, Cox, & Clara, Reference Enns, Cox and Clara2002; Flett, Coulter, Hewitt, & Nepon, Reference Flett, Coulter, Hewitt and Nepon2011; Herman, Wang, Trotter, Reinke, & Ialongo, Reference Herman, Wang, Trotter, Reinke and Ialongo2013; Hewitt et al., Reference Hewitt, Caelian, Flett, Sherry, Collins and Flynn2002; Hewitt & Flett, Reference Hewitt and Flett1991a; Hewitt, Flett, & Ediger, Reference Hewitt, Flett and Ediger1996; O'Connor et al., Reference O'Connor, Rasmussen and Hawton2010), and other-oriented perfectionism is linked to interpersonal issues. In addition, socially prescribed perfectionism is consistently more strongly linked to depression than self-oriented perfectionism (Asseraf & Vaillancourt, Reference Asseraf and Vaillancourt2015; Cox & Enns, Reference Cox and Enns2003; Enns & Cox, Reference Enns and Cox1999; Enns et al., Reference Enns, Cox and Clara2002; Flett et al., Reference Flett, Coulter, Hewitt and Nepon2011; Herman et al., Reference Herman, Wang, Trotter, Reinke and Ialongo2013; Hewitt et al., Reference Hewitt, Flett and Ediger1996; O'Connor et al., Reference O'Connor, Rasmussen and Hawton2010), and is thus the focus of this study. Specifically, we examined the developmental progression of depression in relation to the development of socially prescribed perfectionism across adolescence (Grade 7 at age 12 to Grade 12 at age 17).
To date, it is unclear if the cognitive distortions of perfectionists represent a risk factor for depression (Hewitt et al., Reference Hewitt, Flett and Ediger1996; O'Connor et al., Reference O'Connor, Rasmussen and Hawton2010; Sherry, Richards, Sherry, & Stewart, Reference Sherry, Richards, Sherry and Stewart2014), are an outcome of depression (Asseraf & Vaillancourt, Reference Asseraf and Vaillancourt2015; Cox & Enns, Reference Cox and Enns2003), or if they share a reciprocal relation with depression (McGrath et al., Reference McGrath, Sherry, Stewart, Mushquash, Allen, Nealis and Sherry2012). Even though the findings are equivocal on the direction of association, it is important to establish the temporal precedence between depression and perfectionism as such knowledge can be used to help guide clinical intervention and prevention. For example, if it is the case that perfectionism predated depression, then clinicians may want to address changing cognitions associated with the belief that a person needs to be perfect and/or that others want them to be perfect. To the best of our knowledge, there are only two published studies examining trajectories of perfectionism, and neither study examined the codevelopment of depression and perfectionism. Using the Child and Adolescent Perfectionism Scale 14-item version (O'Connor, Dixon, & Rasmussen, Reference O'Connor, Dixon and Rasmussen2009), Hong et al. (Reference Hong, Lee, Chng, Zhou, Tsai and Tan2016) used latent class growth modeling to examine socially prescribed and self-oriented critical perfectionism in a sample 302 Singaporean children assessed at age 7, 8, 9, and 11. Two classes were obtained for socially prescribed perfectionism (“high-decreasing” [78%] and “low-stable” [22%]) and four for self-oriented critical perfectionism (“high-decreasing” [22%], “high-increasing” [14%], “low-increasing” [24%], and “low-stable” [40%]). Children in the elevated trajectories of socially prescribed and self-oriented critical perfectionism had higher internalizing scores at age 9 and 11 when compared to the low-stable classes of each type of perfectionism.
In another study of 547 urban African American children assessed from Grade 6 to Grade 12, Herman et al. (Reference Herman, Wang, Trotter, Reinke and Ialongo2013), using factor-based scores on socially prescribed and self-oriented critical perfectionism dimensions identified in a prior analysis of a subset of their sample (McCreary, Joiner, Schmidt, & Ialongo, Reference McCreary, Joiner, Schmidt and Ialongo2004), found a four-class solution for each type of perfectionism (i.e., socially prescribed and self-oriented) using a growth-mixture approach. Developmental trajectories of socially prescribed perfectionism included a “high” group (10.3%), an “increasing” group (15.7%), a “decreasing” group (11.7%), and a “low” group (62.3%). Self-oriented criticism perfectionism trajectories also consisted of a high group (5.5%), an increasing group (22.6%), a decreasing group (19.3%), and a low group (52.6%). The only notable difference between the two sets of trajectories was that the high and low self-oriented critical perfectionism groups were stable whereas the socially prescribed perfectionism groups were not. The results also indicated that high and increasing classes of both forms of perfectionism were associated with the highest depression scores in the 12th grade, although the high socially prescribed class had the highest Grade 12 mean depression score. Moreover, in Grade 6, the high socially prescribed perfectionism class reported the highest mean depression scores when compared to the other trajectories, suggesting coupling between perfection and depression across time, which is the focus of the current study. Although informative, the analytic approach used in the Hong et al. (Reference Hong, Lee, Chng, Zhou, Tsai and Tan2016) and Herman et al. (Reference Herman, Wang, Trotter, Reinke and Ialongo2013) studies does not provide an examination of the dynamic linkage between depression symptoms and perfectionism over time. With this limitation in mind, we sought to model the joint course of depression and socially prescribed perfectionism so as to provide a more detailed and perhaps more realistic representation of the underlying associations and degree of overlap between the two longitudinal outcomes or processes (Nagin & Tremblay, Reference Nagin and Tremblay2001; Xie, McHugo, He, & Drake, Reference Xie, McHugo, He and Drake2009).
In examining the development of depression and socially prescribed perfectionism across adolescence, we assumed a heterogeneous presentation of symptoms over time. Hence, we used a statistical approach (i.e., latent class growth analysis) that allowed for the examination of individual variation over time within groups that have distinct growth patterns. We also examined the joint or dual development of depression symptoms and socially prescribed perfectionism across adolescence. We expected that symptoms of depression would be characterized by a no or low stable symptom group, a high stable group, an increasing group, and a high decreasing group, based on previous findings (Costello et al., Reference Costello, Swendsen, Rose and Dierker2008; Yaroslavsky et al., Reference Yaroslavsky, Pettit, Lewinsohn, Seeley and Roberts2013). In terms of socially prescribed perfectionism, we expected to identify at least a high stable and a low stable group of socially prescribed perfectionism based on previous studies (Herman et al., Reference Herman, Wang, Trotter, Reinke and Ialongo2013; Hong et al., Reference Hong, Lee, Chng, Zhou, Tsai and Tan2016). Regarding joint trajectory group membership, we expected that a high-risk dual trajectory (i.e., high or rising depression and high socially prescribed perfectionism) would be found. As for the temporal pattern, no hypothesis was specified given the mixed evidence that perfectionism is a risk factor for depression (Hewitt et al., Reference Hewitt, Flett and Ediger1996; O'Connor et al., Reference O'Connor, Rasmussen and Hawton2010; Sherry, Mackinnon, Macneil, & Fitzpatrick, Reference Sherry, Mackinnon, Macneil and Fitzpatrick2012), an outcome of depression (Asseraf & Vaillancourt, Reference Asseraf and Vaillancourt2015; Cox & Enns, Reference Cox and Enns2003), and it shares a reciprocal relation with depression (McGrath et al., Reference McGrath, Sherry, Stewart, Mushquash, Allen, Nealis and Sherry2012).
Considering our expectation that a high-risk dual trajectory would be found, we were also interested in examining non–age-overlapping antecedent risk factors (Grade 5 at age 10 and Grade 6 at age 11) of joint trajectory membership using self-reports (SR) and parent reports (PR). Knowing which childhood factors predict problematic courses of depression and socially prescribed perfectionism across adolescence is also an important guide for intervention and prevention efforts. Researchers examining perfectionism have tended to conceptualize it as a risk factor of psychological problems and have not typically examined what predicts perfectionism. Accordingly, we selected risk factors that have been shown to be robustly associated with depression, and consistent with Kendler et al.’s (Reference Kendler, Gardner and Prescott2002) comprehensive developmental model of depression. Specifically, we examined the psychosocial risk factors of being bullied (McDougall & Vaillancourt, Reference McDougall and Vaillancourt2015; SR and PR), having problems with anxiety (Merikangas et al., Reference Merikangas, Zhang, Avenevoli, Acharyya, Neuenschwander and Angst2003; SR and PR), having poor family relationships (Restifo & Bögels, Reference Restifo and Bögels2009; PR), living in poverty (Costello et al., Reference Costello, Swendsen, Rose and Dierker2008; PR), and being female (American Psychiatric Association, 2013). Conduct problems have been shown to be related to the development of depression, and thus we examined self-reported use of physical aggression and relational aggression (e.g., rumor spreading) considering evidence that both predict the development of depressive symptoms in late adolescence (Blain-Arcaro & Vaillancourt, Reference Blain-Arcaro and Vaillancourt2016; Cleverley, Szatmari, Vaillancourt, Boyle, & Lipman, Reference Cleverley, Szatmari, Vaillancourt, Boyle and Lipman2012). Given socially prescribed perfectionism's strong relation to depression, we expected that high-risk joint trajectories of depression and socially prescribed perfectionism would be predicted by these risk factors of depression.
Method
Participants and procedures
Data were drawn from the ongoing McMaster Teen Study, which was designed to examine the relations between bullying, mental health, and academic achievement using a multimethod and multiple-informant approach. The study began in the spring of 2008 (Time 1 [T1]) when participants were in Grade 5 and has continued until the spring of 2015 (Time 8 [T8]) when participants were in Grade 12. Participants were initially recruited from a random sample of 51 schools within a large Southern Ontario Public School Board (80% participation rate). Of the 875 participants originally recruited at T1 for the longitudinal arm of the study, n = 700 (52.6% girls) participated in at least one additional time point between Grade 6 (Time 2 [T2]) and Grade 12 (T8; i.e., the longitudinal cohort), and thus formed the sampling frame from which latent class growth models were estimated in the current study. The average age of the participants in our sampling frame at T1 (Grade 5) was 10.91 years (SD = 0.36). The racial/ethnic composition of the sample was primarily White (71.4%) and middle class, which reflected the demographic characteristics of the large metropolitan city from which participants were recruited. Parent informants were primarily the biological mothers (80%). At T1, over half (58.3%) of the parent informants self-indicated their age as over 40 years and that they were college or university educated (74%). Parental consent and child assent were obtained at each time point, and the study has maintained yearly ethics approval from the university research ethics board. Attrition for this study has been modest, with the largest attrition occurred from T1 to T2 where 10% of the sample was lost. Since T2, the average yearly attrition has been less than 5%. We conducted attrition analysis comparing the full sample to the sampling frame on key demographic variables. Relative to the full sample recruited for the longitudinal arm of the study at T1 (n = 875), participants in the sampling frame (n = 700) were more likely to be White, χ2 (8) = 28.17, p < .01, and have parents with higher levels of education, χ2 (4) = 50.02, p < .01, and income, χ2 (7) = 43.63, p < .01. The full sample and the analytic sampling frame did not differ by child sex.
Measures
Trajectories assessed at T3 (Grade 7) to T8 (Grade 12)
Depression Symptoms (SR)
The Behavior Assessment System for Children—Second Edition Adolescent Version (BASC-2; Reynolds & Kamphaus, Reference Reynolds and Kamphaus2004) was administered to youth in Grades 7 to 12 (Time 3 [T3] to T8). The BASC-2 is a psychometrically sound, multimethod, multidimensional measure of behaviour and self-perceptions of people between the ages of 2 and 25 that is used to make differential diagnoses based on categories outlined in the DSM-IV-TR (Reynolds & Kamphaus, Reference Reynolds and Kamphaus2004). The depression subscale contained 13 items measuring sadness, hopelessness, and loneliness and approximately equal numbers of true or false (0 = false, 2 = true) and 4-point Likert scale items (never = 0, sometimes = 1, often = 2, and almost always = 3). The sample item included “I just don't care anymore.” Overall self-reported symptoms of depression were calculated by summing the scores of each item, with higher scores indicating higher symptoms of depression. The internal consistency was high across time (α range = 0.87–0.91).
Perfectionism (SR)
The Child–Adolescent Perfectionism Scale (CAPS; Flett, Hewitt, Boucher, Davidson, & Munro, Reference Flett, Hewitt, Boucher, Davidson and Munro1997) was used to assess self-reported perfectionism in Grades 7 to 12 (T3 to T8). The CAPS is a psychometrically sound measure of perfectionism used in nonclinical populations of children and adolescents ages 8 to 18 years (Flett et al., Reference Flett, Hewitt, Boucher, Davidson and Munro1997). The 22-item self-report scale includes two subscales measuring self-oriented perfectionism (12 items; e.g., “I want to be the best at everything I do”) and socially prescribed perfectionism (10 items; e.g., “There are people in my life who expect me to be perfect”). As we noted above, the focus of the current investigation was modeling trajectories of perfectionism using the socially prescribed perfectionism subscale as depression has been shown to be more strongly associated with this dimension of perfectionism. Participants rated the items on a 5-point Likert scale where 0 = not at all true of me and 4 = very true of me. Overall socially prescribed perfectionism was calculated by summing the scores of the socially prescribed perfectionism subscale, with higher scores indicating higher perfectionism levels. The internal consistency for the CAPS was high across time (α range = 0.88–0.92).
Predictors assessed at T1 (Grade 5) and T2 (Grade 6)
Peer victimization (SR)
Peer victimization was measured using a psychometrically sound adapted version (Vaillancourt et al., Reference Vaillancourt, Trinh, McDougall, Duku, Cunningham, Cunningham and Short2010) of the Olweus Bully/Victim questionnaire (Olweus, Reference Olweus1996). At T1 and T2, participants were asked to rate how often they were bullied by peers using a 5-point scale, 0 = not at all to 4 = many times a week. A standard definition of bullying that distinguished it from fighting, aggression, and teasing was first presented, and then participants were asked to respond to the question “Since the start of the school year (September) … how often have you been bullied at school?” using a 5-point scale, 0 = not at all, 1 = only a few times this year, 2 = every month, 3 = every week, and 4 = many times a week. Participants were also asked to report about their experiences with specific forms of bullying (physical, verbal, social, and cyber), again along the same 5-point frequency noted above. Internal consistency for the peer victimization items was good at each time point (T1 α = 0.79 and T2 α = 0.81). Items were summed at each time point to create a peer victimization score. A peer victimization composite was created by averaging the T1 and T2 scores (r = .52).
Peer victimization (PR)
At T1 and T2 parents were first read a definition of bullying, which differentiated it from fighting, aggression, and teasing, and were then asked to indicate if their child was “currently being bullied at school” with the binary response option of 0 = no or 1 = yes.
Anxiety symptoms (SR)
Participants reported on their anxiety symptoms using the Self-Report of Personality form of the BASC–2 (Reynolds & Kamphaus, Reference Reynolds and Kamphaus2004). Responses were answered in both a 0 = false or 2 = true format and a 4-point scale ranging from 0 = never to 3 = almost always. Sample item included “I often worry about something bad happening to me.” Scale scores at T1 and T2 were created by summing items (T1 α = 0.88 and T2 α = 0.86), and a self-report anxiety composite was created by averaging the T1 and T2 scores (r = .52).
Anxiety symptoms (PR)
The Brief Child and Family Phone Interview (BCFPI-3), a reliable and valid measure of children's mental health (Cunningham, Pettingill, & Boyle, Reference Cunningham, Pettingill and Boyle2006), was used to assess parent-rated symptoms of anxiety in their child when youth were in Grades 5 and 6 (T1 and T2). The BCFPI-3 is a 30-min structured phone interview used to screen for emotional and behavioral issues in children ages 3–18 years. Six items were rated on a 3-point Likert scale (0 = never, 1 = sometimes, and 2 = often). Sample item included “Do you notice that your child worries about things in the future?” Internal consistencies were excellent (T1 α = 0.81 and T2 α = 0.83). Scales scores at T1 and T2 were created by summing items. A parent-report anxiety composite was calculated by averaging the T1 and T2 scores (r = .64). Higher scores indicated higher levels of anxiety.
Physical and relational aggression (SR)
A shortened version of the Aggressive Behavior Scale (Little, Henrich, Jones, & Hawley, Reference Little, Henrich, Jones and Hawley2003) was used to assess T1 and T2 self-reported physical aggression (e.g., “I am the kind of person who hits, kicks, or punches others”) and relational aggression (e.g., “I am the kind of person who tells my friends to stop liking someone”). At each time point, children responded to 24 questions (12 overt aggression and 12 relational aggression) on a 4-point scale (0 = not at all true, 1 = sort of not true, 2 = sort of true, and 3 = completely true). In this study, three items were excluded from the overt aggression composite that asked about verbal aggression (e.g., “I'm the kind of person who says mean things to others”). Physical and relational aggression scales were created by summing items for each type of aggression, respectively. Internal consistencies for physical (T1 α = 0.86; T2 α = 0.86) and relational (T1 α = 0.81; T2 α = 0.79) aggression were good. Separate physical and relational aggression composites were created by averaging the T1 and T2 scores for both physical (r = .61) and relational (r = .42) aggression, respectively.
Family functioning (PR)
Parents were asked to report on family functioning by rating how much they agreed or disagreed (4 = strongly agree, 3 = agree, 2 = disagree, and 1 = strongly disagree) with six statements about their family using the BCFPI-3 (Cunningham et al., Reference Cunningham, Pettingill and Boyle2006). Five items had a positive valence (e.g., “In times of crisis we can turn to each other for support”), and one was negatively worded (e.g., “We don't get along well together”). This item was reverse scored, and scale scores were created at T1 (α = 0.81) and T2 (α = 0.72) by summing items, and these scores (T1 and T2) were then averaged to create a composite score (r = .56). Higher scores reflected better family functioning.
Family income (PR)
Parents reported on their household income at T1 using eight categories ranging from 1 (<$20,000) to 8 (>$80,000). The income levels reported were consistent with those obtained from Canadian census data for the geographical location and time from which participants were drawn, with almost half of the participants (49.5%) reporting a household income more than $80,000 CAD.
Analytic plan
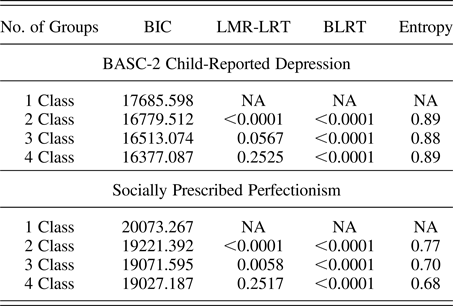
Semiparametric group-based methods estimated in Mplus 7.11 (Muthén & Muthén, Reference Muthén and Muthén1998) via latent class growth analysis were used to identify the number and shapes of distinct trajectories of depression and perfectionism across T3 to T8. The probability that each individual belonged to a given trajectory group was based on the posterior probabilities. Full information maximum likelihood estimation was used to handle missing trajectory indicator data. Evaluation of the best fitting models was based on the following criteria: the Bayesian information criterion (BIC), the Lo–Mendell–Rubin likelihood ratio test, the bootstrapped likelihood ratio test, and entropy. Theoretical and conceptual clarity of the final model, as well as the presence of a sufficient number of members in each group to examine univariate trajectory group associations with covariates with adequate statistical power were also considered when selecting the final model. We tested up to four solutions for both depression and socially prescribed perfectionism, and model parameter estimates from the best fitting univariate trajectories were used as starting values in our joint trajectory models.
Analytic samples for the core substantive analyses (described below) varied slightly as a function of whether self-reported depression and socially prescribed perfectionism data were available for at least one of the six time points used to model the single and dual trajectories (T3 to T8). For analyses involving univariate trajectories of self-reported depression, the analytic sample size was n = 611, and for analyses involving univariate trajectories of socially prescribed perfectionism the analytic sample size was n = 610. Finally, for analyses involving the dual trajectory groups, the analytic sample size comprised n = 612 adolescents. We examined missing data patterns comparing the analytic sample involving joint trajectory groups (n = 612) to the full sample recruited for the longitudinal arm of the study (n = 875) on our focal covariates of interest. Compared to the full sample recruited for the longitudinal arm of the study at T1, participants with joint trajectory indicator data (i.e., one or more valid data points for depression or perfectionism) demonstrated lower relational, M = 0.40 versus 0.48, t (379.83) = 2.83, p < .01, and physical aggression scores, M = 0.35 versus 0.44, t (358.33) = 2.40, p < .01, and came from families with higher family income χ2 (7) = 49.02, p < .01. No other associations between focal observed covariates and missing joint trajectory indicator data were found, suggesting the data were missing at random.
T1 and T2 predictors were all standardized prior to focal analyses. Our core substantive analyses comprised a series of multinomial logistic regression models. For group membership in each latent growth class trajectory process (depression, socially prescribed perfectionism, and joint) we tested separately the predictive significance of peer victimization (SR and PR), anxiety (SR and PR), physical and relational aggression (SR), family functioning (PR), and family income (PR). For analyses involving univariate trajectories (i.e., depression and socially prescribed perfectionism), we specified a priori the low group as the reference group and conducted contrasts between the low group and each of the other two depression and socially prescribed perfectionism groups. Because we were interested in the clinical significance of joint trajectories characterized by high and/or increasing trajectories of both depression and perfectionism, in joint trajectory analyses, we specified a priori three contrasts that were informative with regard to potentially risk-related patterns of the joint development of depression and perfectionism: (a) increasing depression/high increasing perfectionism versus low/low, (b) high decreasing depression/high increasing perfectionism versus low/low, and (c) high decreasing depression/high increasing perfectionism versus increasing depression/high increasing perfectionism. Because these were the only contrasts we were interested in, these were the only ones tested (in addition, small cell sizes for some joint group patterns precluded contrast testing). Follow-up models for each analysis described above were also conducted with the interaction between child sex and each predictor in predicting trajectory group membership. Because few such interactions emerged, we note in tables below where effects were significantly larger for girls or boys. Finally, for each trajectory process, we tested whether some of the covariates were better predictors of group membership than others by simultaneously entering all predictors into a multinomial logistic regression using the reference groups described above. To control for Type 1 error in analyses where predictors were tested individually, we corrected for multiple testing using the Benjamini–Hochberg (BH) correction for multiple testing (Benjamini & Hochberg, Reference Benjamini and Hochberg1995).
Results
Descriptive statistics
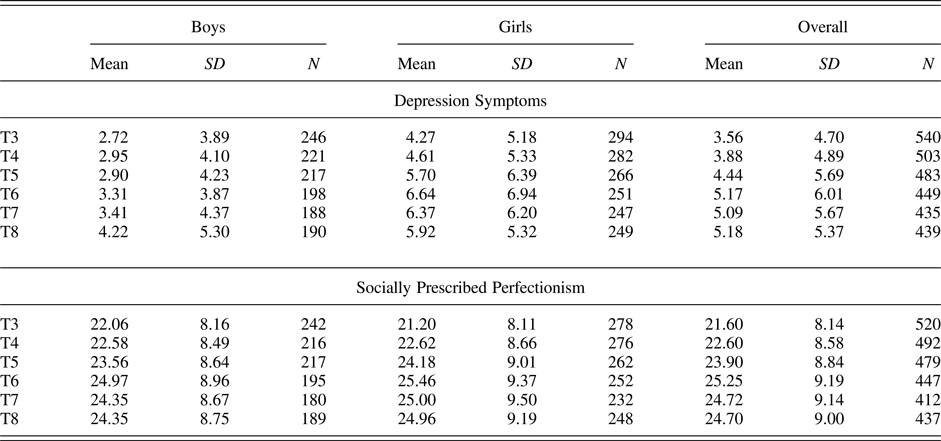
Means and standard deviations of depression symptoms and socially prescribed perfectionism from T3 to T8 are presented in Table 1. Overall rates for both depression and socially prescribed perfectionism appear to show a gradual increase across time. We verified this observation by statistically examining overall linear change and found that the slope was positive for depression (slope = 0.63, SE = 0.17, z = 3.80, p < .01) and socially prescribed perfectionism (slope = 1.72, SE = 0.27, z = 6.30, p < .01). Within-time correlations between symptoms of depression and socially prescribed perfectionism were generally of large magnitude (r = .29 at T3, .28 at T4, .34 at T5, .37 at T6, .36 at T7, and .42 at T6; all ps < .01), and symptoms of depression and perfectionism were stable from one time point to the next (min–max: r = .52–.65 for depression and r = .60–.71 for perfectionism). Prior to standardization, means and standard deviations for T1 and T2 composite predictors of trajectory group membership were as follows: peer victimization SR, M = 0.76, SD = 0.66, anxiety SR, M = 9.14, SD = 0.22, and PR, M = 4.38, SD = 0.10; relational aggression SR, M = 0.41, SD = 0.32, physical aggression SR, M = 0.36, SD = 0.40, family functioning PR, M = 21.63, SD = 1.92, and family income PR, M = 6.15, SD = 2.31. For parent-reported peer victimization data at T1, 21.6% of parents indicated their child was being bullied at school, whereas at T2, 18.9% of parents indicated their child was being bullied at school.
Mean levels of child-reported depression symptoms and socially prescribed perfectionism across assessment intervals

Note: Descriptive statistics were calculated based on the longitudinal cohort N = 700.
Developmental trajectories
Depression
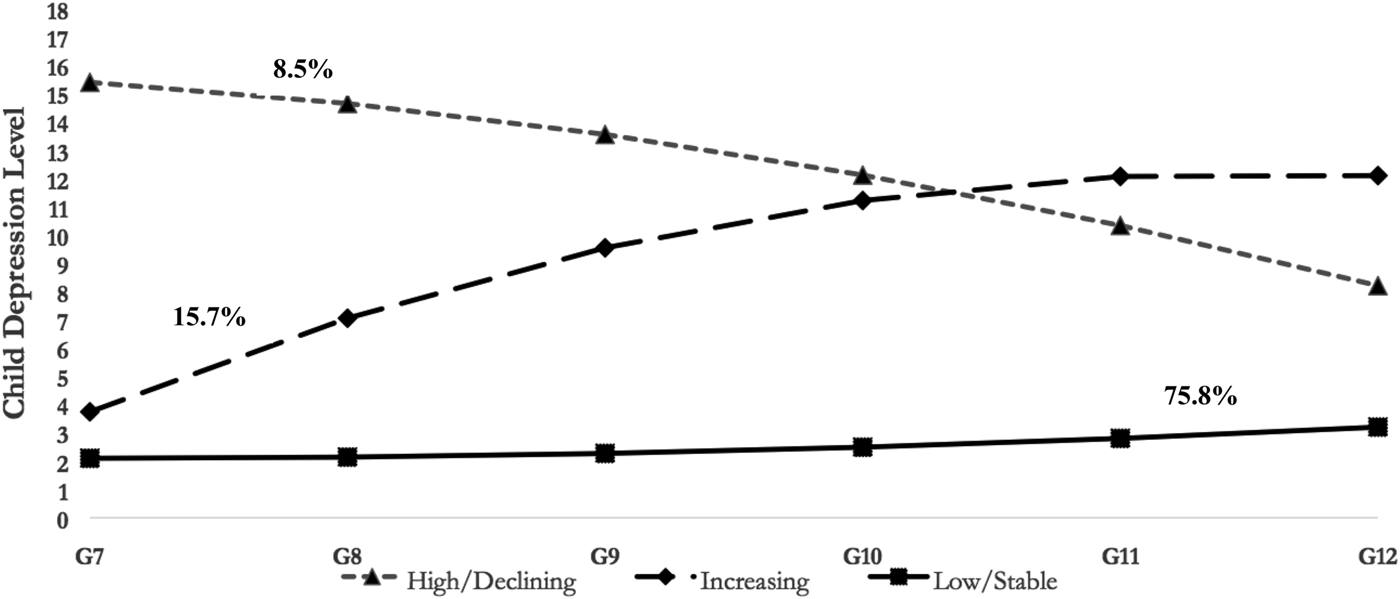
The three-group solution was selected (see Figure 1) as it had the lowest BIC value and all other fit indicators were good (see Table 2). Most adolescents (75.8%, n = 463; 240 boys, 223 girls) followed a trajectory of low depression symptoms over time (low stable). The next largest group (15.7%, n = 96; 28 boys, 68 girls) followed an increasing trajectory (increasing), whereas the smallest group (8.5%, n = 52; 12 boys, 40 girls) followed a trajectory that began high in early adolescence and decreased over time (high decreasing), although never reaching the levels of the low stable trajectory group. The posterior probabilities indicated that adolescents were well matched to their trajectory group (.96 for the low stable group, .91 for the increasing group, and .95 for the high decreasing group).
Developmental trajectories of child depression.

Fit indices for latent class trajectory models under consideration
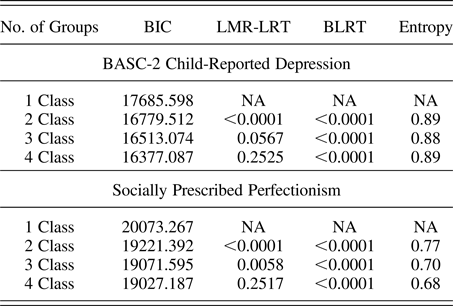
Note: BIC, Bayesian information criterion; LMR-LRT, Lo–Mendell–Rubin likelihood ratio test; BLRT, bootstrapped likelihood ratio test.
Socially prescribed perfectionism
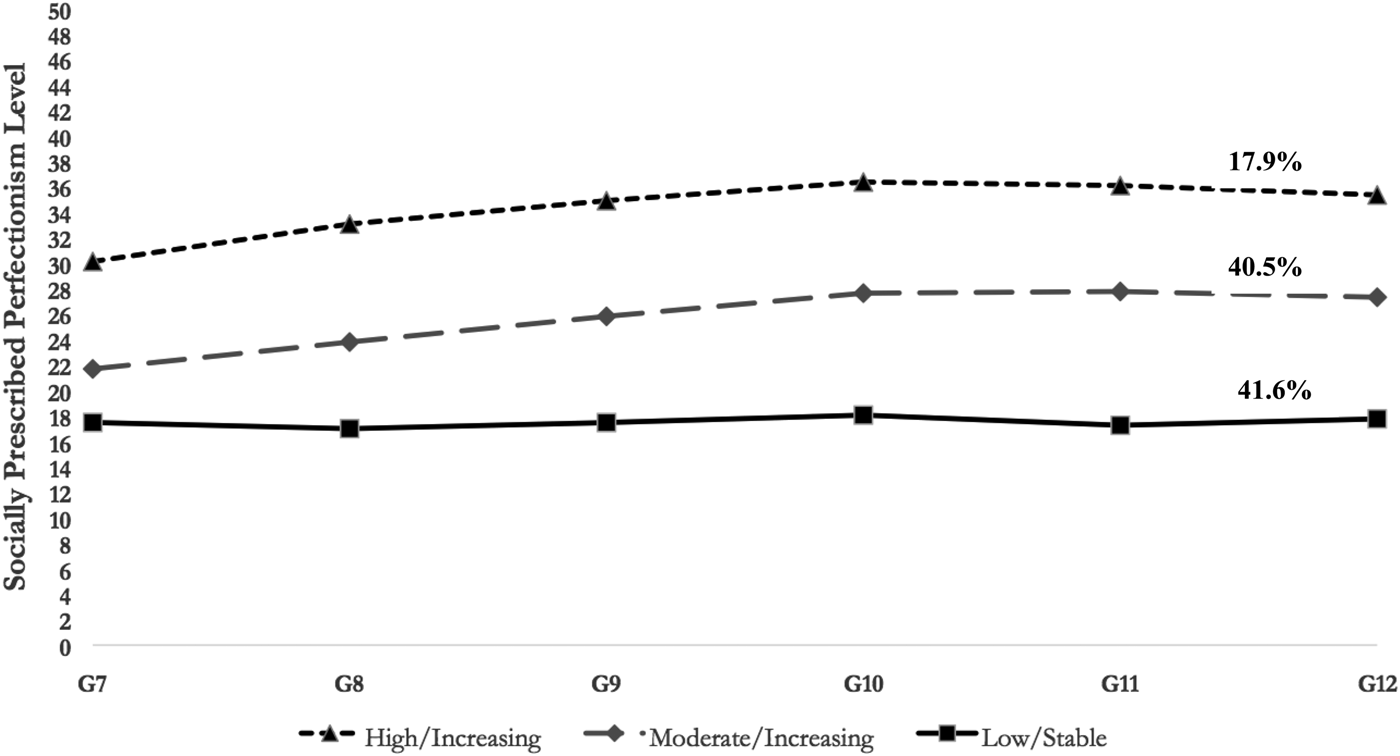
The three-group solution was selected (see Figure 2) as it had the lowest BIC value and all other fit indicators were good (see Table 2). The low stable socially prescribed perfectionism group comprised 41.6% of adolescents (n = 254; 117 boys, 137 girls), whereas the moderate increasing group comprised 40.5% youth (n = 247; 112 boys, 135 girls). We also identified a high increasing trajectory that comprised 17.9% of participants (n = 109; 51 boys, 58 girls). The posterior probabilities again indicated that adolescents were well matched to their trajectory group (.89 for the low stable group, .82 for the moderate increasing group, and .86 for the high increasing group).
Developmental trajectories of socially prescribed perfectionism.

Joint trajectories of depression and perfectionism
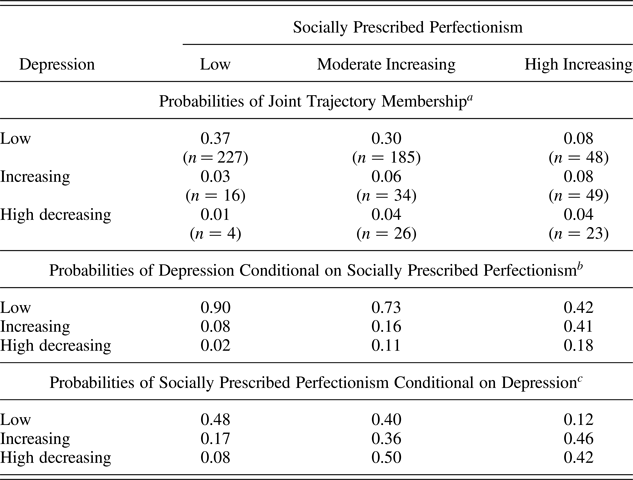
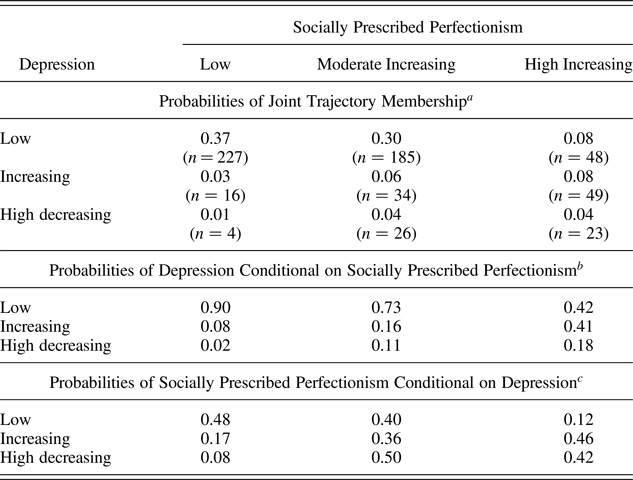
There were nine possible joint trajectory groups (3 × 3), and nine groups with distinct developmental patterns of depression and socially prescribed perfectionism were identified (Table 3). The first part of Table 3 shows the proportion of adolescents in each group. The largest group of adolescents demonstrated patterns of both low trajectories of depression and socially prescribed perfectionism (i.e., a low-risk group; 37.1% of the sample, n = 227; 112 boys, 115 girls). The next largest group of adolescents followed a joint trajectory pattern of low depression and moderate increasing socially prescribed perfectionism (30.2% of the sample, n = 185; 98 boys, 87 girls). Eight percent of the sample followed a joint pattern characterized by increasing depression and high increasing socially prescribed perfectionism (n = 49; 16 boys, 33 girls). Another 7.8% of the sample followed a pattern of low depression and high increasing socially prescribed perfectionism (n = 48; 30 boys, 18 girls). The remaining groups consisted of an increasing depression and moderate increasing socially prescribed perfectionism group (5.6% of the sample; n = 34; n = 9 boys, 25 girls), a high decreasing depression and moderate increasing socially prescribed perfectionism group (4.2% of the sample; n = 7 boys, 19 girls), a high decreasing depression and high increasing socially prescribed perfectionism group (3.8% of the sample, n = 5 boys, 18 girls), an increasing depression and low socially prescribed perfectionism group (2.6% of the sample, n = 3 boys, 13 girls), and a high decreasing depression and low socially prescribed perfectionism group (0.7% of the sample, n = 1 boy, 3 girls). Average posterior probability for all joint groups was >.70, suggesting that children were adequately matched to their joint trajectory group.
Joint and conditional probabilities of depression and socially prescribed perfectionism
aCells total 1.
bColumns total 1.
cRows total 1.
The bottom portion of Table 3 presents participants' conditional probabilities of their depression trajectory group conditional on their socially prescribed perfectionism trajectory group and, vice versa, the probabilities of their socially prescribed perfectionism trajectories conditional on their depression trajectories. Conditional probability results suggest that a child's increasing or high/decreasing depression trajectory group was a somewhat better indicator of their moderate/increasing or high/increasing socially prescribed perfectionism group than the converse.Footnote 1
Trajectory group membership associations with T1 and T2 predictors
There were differences in the proportion of boys and girls in the depression trajectory groups, χ2 (2) = 28.31, p < .01, but not socially prescribed perfectionism trajectory groups, χ2 (2) = 0.07, p = .97. Examination of adjusted standardized residuals in the differences in sex proportions across the three depression trajectory groups indicated that there were significantly more girls in the increasing (20.5% girls vs. 10.0% boys) and high decreasing depression trajectory groups (12.1% girls vs. 4.3% boys). There were also differences in the proportion of boys and girls in the joint depression and socially prescribed perfectionism groups, χ2 (8) = 33.40, p < .01. Girls were disproportionality more likely to be in joint trajectory groups that featured either increasing or high decreasing depression trajectories (regardless of their socially prescribed perfectionism trajectory pattern) than boys with the exception of the increasing depression/high increasing socially prescribed perfectionism and high decreasing depression/low socially prescribed perfectionism joint groups. These results are consistent with findings indicating girls were more likely to be in depression trajectory groups that were increasing or began high and then declined.
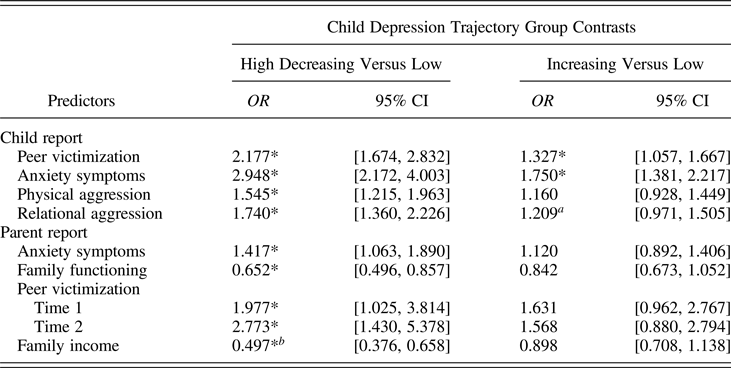
Depression trajectory contrasts are presented in Table 4. When considered separately, all of the predictors except parent-reported peer victimization at T1, which was not a significant predictor after BH adjustment for multiple testing, significantly differentiated the high decreasing depression group from the low group. Moreover, lower family income was a stronger predictor of high decreasing membership (compared to the low group) for girls than boys. In contrast, only peer victimization (SR) and anxiety symptoms (SR) significantly differentiated the increasing depression group from the low depression group. In the model in which all predictors were entered simultaneously, self-reported anxiety was the only indicator to distinguish the increasing depression group from the low group, odds ratio (OR) = 1.79, 95% confidence interval (CI) [1.31, 2.44]; whereas self-reported anxiety, OR = 3.13, 95% CI [2.00, 4.91], parent-reported family functioning, OR = 0.62, 95% CI [0.42, 0.91], and parent-reported family income, OR = 0.45, 95% CI [0.31, 0.64], significantly distinguished the high decreasing group from the low group.
Multinomial logistic regressions of child depression (BASC 2) trajectory groups with Time 1 and Time 2 predictors
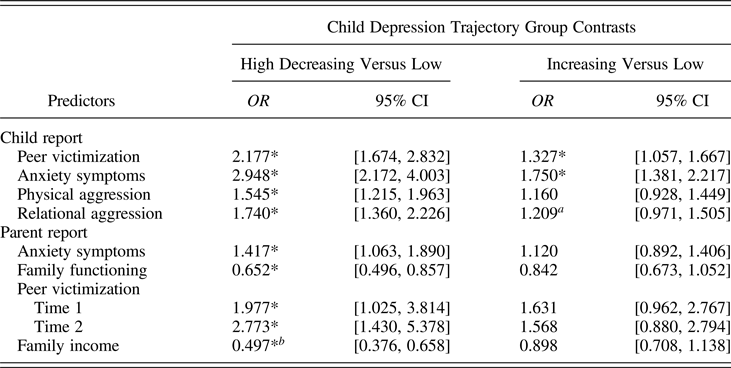
Note: All significant effects remain at the Benjamini–Hochberg adjusted p value except for parent report on peer victimization at Time 1. Odds ratios of 1.68, 3.47, and 6.71 have been shown to correspond to Cohen d values of 0.2 (small), 0.5 (medium), and 0.8 (large), respectively (Chen et al., Reference Chen, Cohen and Chen2010).
aEffect stronger for boys.
bEffect stronger for girls.
*p < .05.
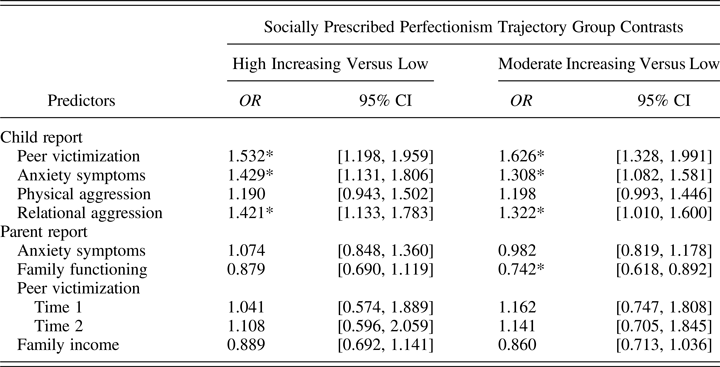
Socially prescribed perfectionism trajectory group contrasts are presented in Table 5. Self-reported peer victimization, anxiety symptoms, and relational aggression each significantly differentiated the high increasing socially prescribed perfectionism group from the low perfectionism group. This same pattern of significant predictive effects was again apparent when considering the contrast between the moderate increasing socially prescribed perfectionism group and the low perfectionism group. In the model in which all predictors were entered simultaneously, none of the predictors significantly distinguished the high increasing group from the low group, whereas both self-reported peer victimization, OR = 1.40, 95% CI [1.07, 1.83], and family functioning, OR = 0.80, 95% CI [0.65, 1.00], significantly distinguished the moderate increasing group from the low group.
Multinomial logistic regressions of socially prescribed perfectionism trajectory groups with Time 1 and Time 2 predictors
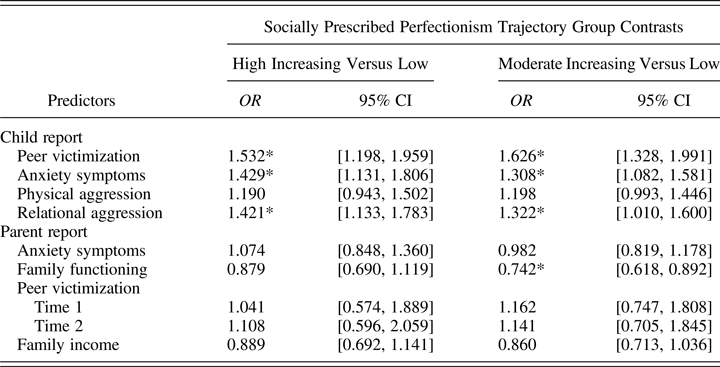
Note: All significant effects remain at the Benjamini–Hochberg adjusted p value. Odds ratios of 1.68, 3.47, and 6.71 have been shown to correspond to Cohen d values of 0.2 (small), 0.5 (medium), and 0.8 (large), respectively (Chen et al., Reference Chen, Cohen and Chen2010).
*p < .05.
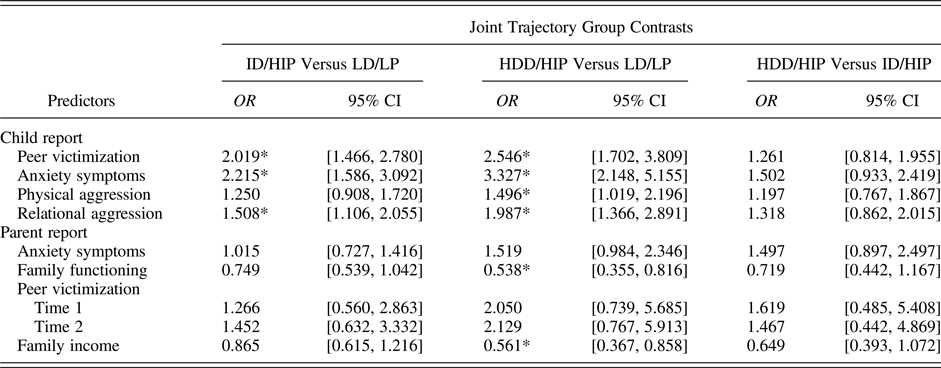
Contrasts for joint child depression and socially prescribed perfectionism trajectory groups are presented in Table 6. Self-reported peer victimization, anxiety, and relational aggression were the only indicators to distinguish the joint increasing depression/high increasing perfectionism from the low/low joint group. These same predictors, as well as parent-reported family functioning and family income, significantly differentiated the joint high decreasing depression/high increasing perfectionism group from the low/low joint group (note that physical aggression was not a significant predictor after BH adjustment for multiple testing). Finally, none of the predictors significantly differentiated the high decreasing depression/high increasing perfectionism group from the increasing depression/high increasing perfectionism joint group. For joint trajectory group contrasts in which all predictors were entered simultaneously, self-reported peer victimization (OR = 1.60, 95% CI [1.04, 2.45]) and anxiety (OR = 1.89, 95% CI [1.22, 2.93]) significantly distinguished the joint increasing depression/high increasing perfectionism from the low/low joint group whereas self-reported anxiety, OR = 3.59, 95% CI [1.92, 6.72], parent-reported family functioning, OR = 0.48, 95% CI [0.28, 0.85], and family income, OR = 0.59, 95% CI [0.35, 0.99], significantly distinguished the joint high decreasing depression/high increasing perfectionism from the low/low joint group. None of the indicators significantly differentiated the high decreasing depression/high increasing perfectionism joint group from the increasing depression/high increasing perfectionism group.
Multinomial logistic regressions of joint child-reported depression and socially prescribed perfectionism trajectory groups with Time 1 and Time 2 predictors
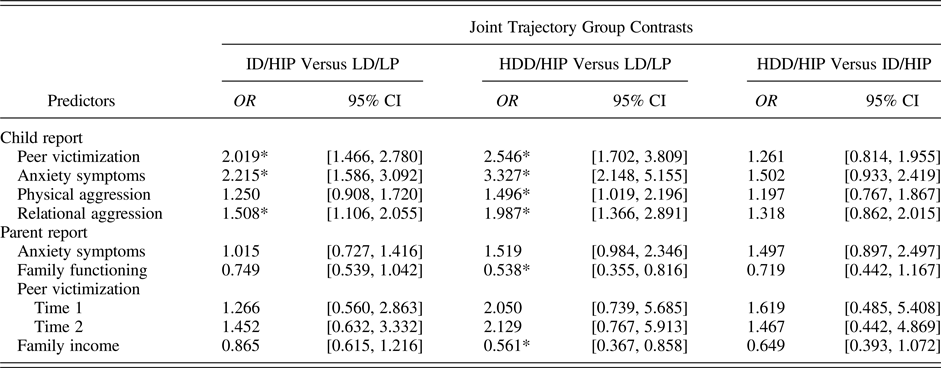
Note: ID/HIP, increasing depression/high increasing perfectionism; LD/LP, low depression, low perfectionism; HDD/HIP, high decreasing depression/high increasing perfectionism. All significant effects remain at the Benjamini–Hochberg adjusted p value. Odds ratios of 1.68, 3.47, and 6.71 have been shown to correspond to Cohen d values of 0.2 (small), 0.5 (medium), and 0.8 (large), respectively (Chen et al., Reference Chen, Cohen and Chen2010).
*p < .05.
Discussion
The purpose of the present study was to examine the codevelopment of symptoms of depression and socially prescribed perfectionism across adolescence (age 12–17) and non–age-overlapping childhood predictors (age 10–11) of joint trajectory group membership. Examining the joint development of depression and perfectionism is important because these two problems have been shown to co-occur in youth and adults (Asseraf & Vaillancourt, Reference Asseraf and Vaillancourt2015; Cox & Enns, Reference Cox and Enns2003; Enns et al., Reference Enns, Cox and Clara2002; Flett et al., Reference Flett, Coulter, Hewitt and Nepon2011; Hewitt et al., Reference Hewitt, Flett and Ediger1996, Reference Hewitt, Caelian, Flett, Sherry, Collins and Flynn2002; Hewitt & Flett, Reference Hewitt and Flett1991a; O'Connor et al., Reference O'Connor, Rasmussen and Hawton2010) and both are associated with a heightened risk of suicide (Beorgers et al., Reference Beorgers, Spirito and Donaldson1998; see review by Flett & Hewitt, Reference Flett and Hewitt2014).
In the present study, we identified three distinct trajectories of depression, characterized by low symptoms across adolescence (stable; 75.8%), increasing levels of symptoms over time (increasing; 15.7%), and high initial symptoms of depression that decreased as participants aged (high decreasing; 8.5%). These results replicate previous studies using similar age bands and analytic techniques. Yaroslavsky et al. (Reference Yaroslavsky, Pettit, Lewinsohn, Seeley and Roberts2013) and Costello et al. (Reference Costello, Swendsen, Rose and Dierker2008) also identified a “low stable” group and a “decreasing” group that began their trajectory with high symptoms of depression that improved over time. Moreover, Costello et al. also identified a “late escalating depressed mood trajectory,” a pattern consistent with meta-analytic findings (Twenge & Nolen-Hoeksema, Reference Twenge and Nolen-Hoeksema2002).
In line with previous work demonstrating that postpuberty, girls are more depressed than boys (Angold et al., Reference Angold, Costello and Worthman1998; Hankin et al., Reference Hankin, Abramson, Moffitt, Silva, McGee and Angell1998; Roza et al., Reference Roza, Hofstra, van der Ende and Verhulst2003), being female predicted being in an elevated depression trajectory. We also found that higher levels of anxiety (SR) examined in isolation and in the model in which all predictors were entered simultaneously predicted high-risk trajectory (high decreasing or increasing depression) group membership when compared to the low-risk trajectory (low stable). Being anxious has been shown to be a strong risk factor for developing depression (Merikangas et al., Reference Merikangas, Zhang, Avenevoli, Acharyya, Neuenschwander and Angst2003). Another robust risk factor for the development of depression is being the victim of bullying (for a review, see McDougall & Vaillancourt, 2005), a finding replicated in the present study. However, peer victimization only predicted elevated depression trajectory group membership when it was examined in isolation of other childhood predictors. Poorer family functioning and lower family income also distinguished the high decreasing group from the low group when examined in isolation and when all predictors were considered together. Exposure to psychosocial adversity such as family discord (Keitner & Miller, Reference Keitner and Miller1990) and poverty (Costello et al., Reference Costello, Swendsen, Rose and Dierker2008) have been shown to be related to the development of depression in youth. Of note, however, when family income was examined alone, it proved to be a predictor of high decreasing depression for girls but not for boys. Although it has been suggested that in adults, women are more affected by depression than men because they are exposed to more chronic strains, including a greater likelihood of living in poverty (Nolen-Hoeksema, Reference Nolen-Hoeksema2001), it is unclear if poverty differentially affects boys' and girls' rates of depression. Finally, although self-reported use of physical aggression and relational aggression did not predict being in a high decreasing depression symptoms trajectory when examined in relation to other predictors, they did predict being in this trajectory when considered in isolation. Studies suggest that while physical aggression and relational aggression are risk factors for the development of depression (Blain-Arcaro & Vaillancourt, Reference Blain-Arcaro and Vaillancourt2016; Cleverley et al., Reference Cleverley, Szatmari, Vaillancourt, Boyle and Lipman2012), the negative outcomes of engaging in relational aggression appear to be worse than engaging in physical aggression (Crick, Reference Crick1997), and they appear to be associated with greater impairment for girls than for boys (Crick, Reference Crick1997).
Three trajectories of socially prescribed perfectionism were also identified: one characterized by low symptoms across adolescence (low stable; 41.6%), another by moderate increasing levels of symptoms over time (moderate increasing; 40.5%), and a final one by high increasing symptoms (high increasing; 17.9%). As this is one of the first studies to examine the developmental course of perfectionism across adolescence, it is more difficult to place these findings in context. Hong et al. (Reference Hong, Lee, Chng, Zhou, Tsai and Tan2016) reported two classes for socially prescribed perfectionism in their sample of Singaporean children aged 7 to 11. Most children were found in the high-decreasing class (78%) and far fewer in the low-stable class (22%). Herman et al. (Reference Herman, Wang, Trotter, Reinke and Ialongo2013) identified four socially prescribed perfectionism classes. However, in this study of urban African American youth assessed from Grade 6 to Grade 12, the low symptom trajectory group was more populated than ours and Hong et al.’s (i.e., 62.3%). Making comparisons on prevalence across the three studies is challenging because different populations were used (Canadian, Singaporean, and American). Studies of American adults suggest cultural and ethnic differences in perfectionism. For example, in one study, African Americans scored lower than Whites on dimensions of perfectionism that related to socially prescribed perfectionism (i.e., concerns over mistakes) but higher on other-oriented perfectionism (Nilsson, Paul, Lupini, & Tatem, Reference Nilsson, Paul, Lupini and Tatem1999). Still, many youth in the Herman et al. (Reference Herman, Wang, Trotter, Reinke and Ialongo2013) study reported high levels of socially prescribed perfectionism (4 out of 10), a finding consistent with a recent study of high school students demonstrating that 3 out of 10 students were classified as “maladaptive perfectionists” (Sironic & Reeve, Reference Sironic and Reeve2015).
When the self-reported childhood predictors of socially prescribed perfectionism were examined in isolation, self-reported peer victimization, anxiety symptoms, and relational aggression predicted high increasing and moderate increasing perfectionisms when compared to the low perfection trajectory. However, in the model in which all predictors were entered simultaneously, only self-reported peer victimization and family functioning significantly distinguished the moderate increasing group from the low group. Anxiety has been shown to be related to socially prescribed perfectionism in children (e.g., Hewitt et al., Reference Hewitt, Caelian, Flett, Sherry, Collins and Flynn2002). Regarding bullying and perfectionism, Roxborough et al. (Reference Roxborough, Hewitt, Kaldas, Flett, Caelian, Sherry and Sherry2012) examined perfectionism and suicide risk in psychiatric child and adolescent outpatients and found that the relation between perfectionism and suicide risk was mediated by being bullied. In another study, Miller and Vaillancourt (Reference Miller and Vaillancourt2007) reported that, across their two independent studies of female undergraduate students, recalled peer victimization in childhood was a significant predictor of socially prescribed perfectionism in adulthood. The social reaction model of perfectionism (Flett et al., Reference Flett and Hewitt2002) helps explain the predictive role of peer victimization in high socially prescribed perfectionism found in the present study. According to this model, children exposed to harsh environments, such as being abused by peers, respond by becoming perfectionistic as a way to cope. That is, the perfectionism may be attempted in order to reduce the likelihood of being victimized or to maintain a sense of control.
The social disconnection model of perfectionism (Hewitt, Flett, Sherry, & Caelian, Reference Hewitt, Flett, Sherry, Caelian and Ellis2006) posits that individuals high on socially prescribed perfectionism report experiencing objective and subjective social problems such as disconnection from others, which can be initiated through interpersonal hostility, and subjective social problems, which may be rooted in interpersonal sensitivity. This model predicts that the direction of association is from perfectionism to psychopathology through negative social behavior, cognitions, and outcomes. This model is inconsistent with the direction of our associations insofar as peer victimization and relational aggression predicted both high and moderate increasing levels of socially prescribed perfectionism when compared to the low perfectionism trajectory group, and our results suggest the pathway was from depression to socially prescribed perfectionism. Still, because we examined our predictors in childhood, independent of the adolescent course of perfectionism, it is possible that perfectionism predates the negative social behavior and peer interaction. It is also possible that a bidirectional relation exists between interpersonal factors such as a need for approval and a fear of negative evaluation and socially prescribed. According the social disconnection model, social prescribed perfectionism interacts with “interpersonally related stressors” in the prediction of psychopathology (Hewitt et al., Reference Hewitt, Flett, Sherry, Caelian and Ellis2006, p. 218). More longitudinal work is needed to validate this model.
Regarding the relation between poor PR family functioning and SR symptoms of perfectionism, it has been long argued that dysfunctional families play an important role in the development of perfectionism (Flett & Hewitt, Reference Flett and Hewitt2002), although the role poverty plays has not been considered. Specifically, it has been postulated that exposure to a poorly functioning family leads to a social reaction whereby the child becomes perfectionistic as a type of coping mechanism (Flett & Hewitt, Reference Flett and Hewitt2002).
When we examined the joint presentation of depression and perfectionism, we identified nine possible joint trajectory groups, of which two were of particular clinical interest due to the likelihood that they would be associated with higher impairment and poorer long-term prognosis. We found that 8% of the adolescents in our study followed a joint pattern characterized by increasing depression and high increasing perfectionism, and 3.8% followed a dual trajectory of high decreasing depression and high increasing perfectionism. When we compared these high-risk groups to a low-risk group of adolescents with low stable depression scores and low stable perfectionism scores, we found that SR peer victimization, anxiety, and relational aggression, as well as poor family functioning (PR) and low income (PR) significantly distinguished the joint high decreasing depression/high increasing perfectionism from the low/low joint group, whereas SR peer victimization, anxiety, and relational aggression significantly distinguished the joint increasing depression/high increasing perfectionism from the low/low joint group.
These results point to the important role early anxiety plays in the development of depression and perfectionism, which is consistent with studies linking perfectionism to anxiety and depression (Hewitt & Flett, Reference Hewitt and Flett1991a). Burgess and DiBartolo (Reference Burgess, DiBartolo, Sirois and Molnar2015) have suggested that overly critical evaluative concerns associated with perfectionism “may function as a transdiagnositic risk factor” (p. 178) for psychopathology, including anxiety and depression. They proposed several explanatory models that focus on stress and emotion regulation, social factors, and cognition, which all have origins in evaluative concerns. Notwithstanding the importance of this theoretical work, it is unclear if depression and anxiety are outcomes of perfectionism as longitudinal empirical work is rare. Our study is the first to examine the joint trajectories of depression and socially prescribed perfectionism and their childhood predictors. Our results suggest that the developmental progression is from depression to perfectionism rather than the reverse, consistent with two other shorter term longitudinal studies (Asseraf & Vaillancourt, Reference Asseraf and Vaillancourt2015; Cox & Enns, Reference Cox and Enns2003) and that anxiety predicts this course of development. Although more longitudinal work is needed to understand the temporal priority between socially prescribed perfectionism, depression, and the role of anxiety, we suggest that in the interim, it may be prudent to focus on changing critical evaluative concerns as they have shown to predict the development of depression (Rudolph & Conley, Reference Rudolph and Conley2005) and are strongly associated with perfectionism (Burgess & DiBartolo, Reference Burgess, DiBartolo, Sirois and Molnar2015).
In the present study, we found that being in a trajectory of joint increasing depression and high increasing socially prescribed perfectionism was predicted by having poorer peer relations such as being the victim of bullying in childhood and using relational aggression. The role peer relations play in the development of depression is well established, with effects persisting well into adulthood (McDougall & Vaillancourt, Reference McDougall and Vaillancourt2015). There is also evidence linking perfectionism to peer victimization (Miller & Vaillancourt, Reference Miller and Vaillancourt2007; Roxborough et al., Reference Roxborough, Hewitt, Kaldas, Flett, Caelian, Sherry and Sherry2012), which again lends support for the perfectionism social disconnection model (Hewitt et al., Reference Hewitt, Flett, Sherry, Caelian and Ellis2006), and is keeping with findings by Sherry, Law, Hewitt, Flett, and Besser (Reference Sherry, Law, Hewitt, Flett and Besser2008) showing that the relation between socially prescribed perfectionism and depressive symptoms was mediated by perceived social support. The fact that high-risk joint trajectory membership was predicted by higher relational aggression use in childhood is in keeping with studies showing independent predictive links between aggression and depression (Blain-Arcaro & Vaillancourt, Reference Blain-Arcaro and Vaillancourt2016; Cleverley et al., Reference Cleverley, Szatmari, Vaillancourt, Boyle and Lipman2012) and concurrent associations between maladaptive perfectionism and trait hostility and anger (e.g., Hewitt & Flett, Reference Hewitt and Flett1991b).
Poorer family functioning and poverty as rated by parents were related to dual high-risk joint trajectories. Poor family functioning in childhood was implicated in the prediction of being in a high-risk trajectory for depression and perfectionism when these trajectories were examined independently. The importance of family in the development and course of psychiatric problems in children and adolescents is well documented, yet curiously, psychotherapy trials for depressed adolescents tend to not target family factors (Restifo & Bögels, Reference Restifo and Bögels2009). The role of poor family functioning should be considered as an important early risk factor in the development of depression and perfectionism, as well as their joint presentation.
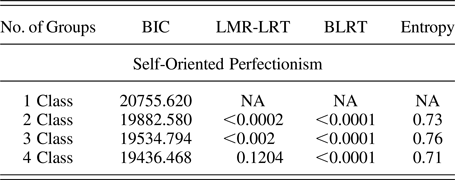
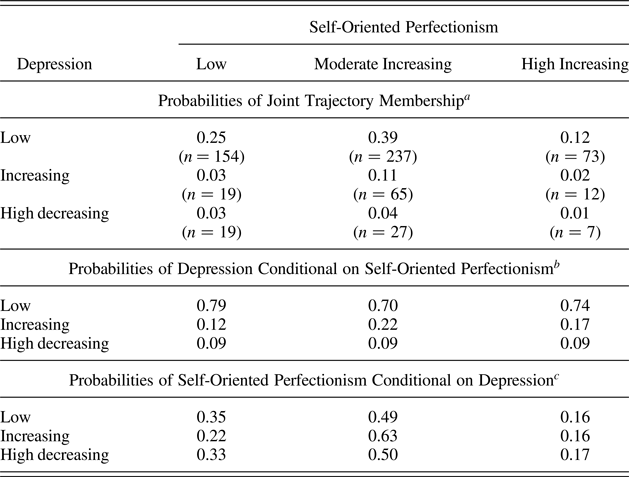
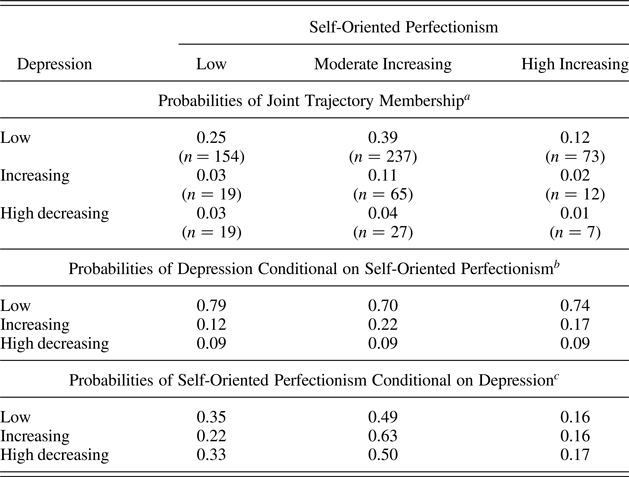
Finally, although we chose to focus on the type of perfectionism (i.e., socially prescribed perfectionism) that has been most consistently and most strongly linked to depression (Asseraf & Vaillancourt, Reference Asseraf and Vaillancourt2015; Cox & Enns, Reference Cox and Enns2003; Enns & Cox, Reference Enns and Cox1999; Enns et al., Reference Enns, Cox and Clara2002; Flett et al., Reference Flett, Coulter, Hewitt and Nepon2011; Herman et al., Reference Herman, Wang, Trotter, Reinke and Ialongo2013; Hewitt et al., Reference Hewitt, Flett and Ediger1996; O'Connor et al., Reference O'Connor, Rasmussen and Hawton2010), we also examined the developmental link between self-oriented perfectionism and depression in our supplemental analyses (see Footnote 1 and Appendix A Tables A.1–A.2 and Figure A.1). Herman et al. (Reference Herman, Wang, Trotter, Reinke and Ialongo2013) examined the codevelopment of socially prescribed perfectionism and self-oriented perfectionism and found that 60% of youth in the high socially prescribed and increasing self-oriented dual-trajectory received a diagnosis of depression during the 7-year course of the study. The odds of being diagnosed with depression were 29.41 times higher when compared to the low socially prescribed and low self-oriented classes. However, consistent with most studies, they also found that Grade 12 depression rates were higher among youth who followed a high socially prescribed perfectionism trajectory compared to those who followed a high self-oriented trajectory. In our study, we also found a stronger relation between depression and high/increasing socially prescribed perfectionism than between depression and high/increasing self-oriented perfectionism.
Limitations
Even though the present study has many strengths, including its large sample size and the assessment of a nonclinical population of children over 8 years of development using parent- and child-reported measures that have been well-validated, there are some limitations. First, the most established risk factor for depression in adolescence is a family history of depression (Agerup, Lydersen, Wallander, & Sund, Reference Agerup, Lydersen, Wallander and Sund2014), which we were not able to assess in the current study. Second, our focus was on symptoms of depression and not the clinical diagnosis of depression. Still, depressive symptoms among nondiagnosed adolescents are linked to a future diagnosis of depression in adulthood (Aalto-Setälä et al., Reference Aalto-Setälä, Marttunen, Tuulio-Henriksson, Poikolainen and Lönnqvist2002). Moreover, according to Rutter et al. (Reference Rutter, Kim-Cohen and Maughan2006), adolescents with subthreshold levels of depression are not that different from adolescents diagnosed with major depressive disorder in terms of their risk for self-harming behavior, depression in adulthood, and rate of treatment for the disorder. Third, our sample was recruited from a single urban region in Ontario, Canada, where all residents have free access to health care. Offord et al. (Reference Offord, Boyle, Szatmari, Rae-Grant, Links, Cadman and Thomas1987) reported rural–urban residence differences in the 6-month prevalence of psychiatric disorders for Ontario children aged 4–16, with disorder rates higher in urban regions than in rural areas. The representativeness of our findings needs to be taken into account. This point is further highlighted by our pattern of missing data. Participants in our sampling frame were more likely to be White and have parents with higher levels of education and income when compared to the full sample recruited for the longitudinal arm of the study. Moreover, participants with any joint trajectory indicator data were less likely to report using relational and physical aggression and were more likely to come from families with higher household income. These differences notwithstanding, it is worth noting that these observed differences make our focal tests of group differences on these constructs between high-risk (i.e., elevated) and low-risk (i.e., low) joint and univariate trajectory groups somewhat more rather than less conservative. Fourth, although our primary attention was on Hewitt and Flett's (Reference Hewitt and Flett1991b) multidimensional model of perfectionism, there are other multidimensional models of perfectionism that have been validated and have garnered attention in the field. For example, Frost's perfectionism model (Frost, Marten, Lahart, & Rosenblate, Reference Frost, Marten, Lahart and Rosenblate1990) is relevant to the study of depression as it focuses on things such as a person's excessive concern over making mistakes and doubting actions, which are cognitions that are consistent with the type of rumination seen in depression. Unfortunately, however, none of the other multidimensional models have child-specific scales.
Clinical implications
There are several depression prevention programs developed for children and adolescents that target factors known to be associated with an increased risk of depression onset, but many of these programs produce small effect sizes (Stice, Shaw, Bohon, Marti, & Rohde, Reference Stice, Shaw, Bohon, Marti and Rohde2009). While discouraging, there is promise associated with selective programs that are delivered to high-risk youth (Stice et al., Reference Stice, Shaw, Bohon, Marti and Rohde2009). However, for prevention programs to work, individuals must be first willing to seek help. The present study highlights a subgroup of adolescents who may be particularly vulnerable. In our study, increases in depression symptoms over time were related to increases in socially prescribed perfectionism. This is an important finding to highlight as it suggests that symptoms of depression could contribute to a sense of stress to be perfect. In our study, close to one in five adolescents were under considerable pressure to live up to what they perceived to be imposed expectations.
The coupling of depression and perfectionism is also problematic because perfectionism has been shown to be negatively associated with help-seeking behavior (Cox & Enns, Reference Cox and Enns2003), and perfectionism is a significant barrier to positive depression treatment outcomes (Blatt, Reference Blatt1995). It has been suggested that targeting perfectionism as a treatment goal may be helpful in reducing symptoms of depression (e.g., Hawley, Zuroff, Brozina, & Dobson, Reference Hawley, Zuroff, Brozina and Dobson2014). The general premise however is that perfectionism is a risk factor for “onset, relapse, and recurrence of depression” (Hawley et al., Reference Hawley, Zuroff, Brozina and Dobson2014, p. 288). In the present study, the developmental progression was best characterized as depression leading to socially prescribed perfectionism. Although this result challenges previous assumptions about directionality, it does not mean that the cognitive attribution biases shared by depression and perfectionism should not be addressed clinically. The transdiagnositic issues of self-worth and self-criticism (Blatt, Reference Blatt1995) ought to be examined before these critical evaluative concerns become entrenched.
Appendix A
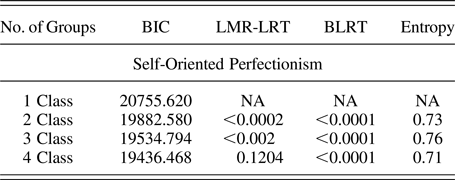
Fit indices for self-oriented perfectionism trajectory models under consideration
Joint and conditional probabilities of depression and self-oriented perfectionism
Developmental trajectories of self-oriented perfectionism.