I. INTRODUCTION
Polymer inorganic composites attracted the researchers in the past decade due to drastic changes in the mechanical properties, enhanced thermal stability, flame retardancy, better gas barrier properties, and corrosion resistance.Reference Mehendru, Kumar, Arora and Gupta1 Moreover, small amounts of doping of clay result either in intercalation or exfoliation, and these changes of the composites can be detected by the x-ray diffraction method (XRD). Exfoliated composites show significant improvement in the physical and chemical properties due to the large aspect ratio as well as the surface area of the clay.Reference Roy, Nelson, MacCrone, Schadler, Reed, Keefe and Zenger2,Reference Xiang, Chen, Li and Bian3 Since clay is naturally hydrophilic and inherently incompatible with most organic polymers, several methods have been developed to make clay more compatible with organic polymers.Reference Padalia, Bisht, Johri and Asokan4–Reference Miyasaka, Watanabe, Jojima, Aida, Sumita and Ishikawa6 The interaction mechanism of clay with polymer is well known, i.e., the metal cations on clay exchange with carbocations of surfactants to form long alkyl chains.Reference Nshuti, Songtipya, Manias, Gasco, Hossenlopp and Wilkie7 This process improves the interface of the polymer clay composites and hence the physical and chemical properties are enhanced.Reference Kojima, Usuki, Kawasumi, Okada, Fukushima and Kurauchi8
Poly(methyl methacrylate) (PMMA) is a transparent, hard, and stiff material with excellent ultraviolet stability, low water absorption, and outstanding outdoor weathering properties.Reference Vaia, Ishii and Giannelis9 PMMA/montmorillonite clay composites are of interest for improved electrical, thermal, and mechanical properties, reduced flammability, reduced gas permeability, as well as their good potential to retain excellent optical clarity.Reference Vaia, Jandt, Kramer and Giannelis10,Reference Okada and Usuki11 These polymer composites have very low dielectric constant and tangent loss; hence, conductivity of these polymer composites is very low.Reference Sinha Ray and Okamoto12 The conductivity of these composites depends on the filler concentration, distribution of filler, orientation, and method of preparation.Reference Zhang, Manias and Wilkie13,Reference Lincoln, Vaia, Wang, Hsiao and Krishnamoorti14 Various methods have been reported such as solvent casting, coprecipitation method, melt mixing, in situ polymerization, interfacial method etc.Reference Roy, Gupta, Sindhu, Parveen and Ramamurthy15–Reference Senthil, Badapanda, Kumar, Kumar and Panigrahi18 Among all the techniques, in situ polymerization is one of the desirable methods because the fillers are homogeneously distributed throughout the polymer matrix and therefore isotropy is maintained. In the present work, the authors have made an attempt to improve the electrical and mechanical properties of PMMA/montmorillonite clay composites. Various proportions of clay were doped in to the PMMA and further characterized by XRD, FTIR, and SEM. The electrical property is studied by Kelvin two probe method using a Keithley source meter and the mechanical property was studied by using a micromechanical testing machine.
II. EXPERIMENTAL
All the chemicals used for synthesis were of analytical reagent (AR) grade. Poly(methyl methacrylate) (PMMA) resin with M w = 108,500 and Mn = 56,700 was supplied by Canus Plastics, montmorillonite clay, poly(methyl methacrylate) (Acros, M w = 350,000), benzoyl peroxide (Fluka, 97%), 1-methyl-2-pyrrolidinone (TEDIA, 95%), tetrahydrofuran for reagent GPC (Mallinckrodt, 99%), acetic acid (SHOWA, 99.7%), toluene (TEDIA, 99.8%), and acetone (TEDIA, 95%) were used as received without further purification. The modified agent is cocoamphodipropionate (C24H44N2O6Na2). For conductivity measurements, the pellets were coated with silver paste on either side of the surfaces to provide electrical contacts.
III. MODIFICATION OF MONTMORILLONITE CLAY
The organic clay was prepared by cation exchange reaction between the sodium cation of the montmorillonite (MMT) and protonized cocoamphodipropionate. Typically, 3 g of MMT was suspended in 90 mL distilled water and stirred at room temperature overnight. Then, clay suspensions were dropwise added into the soluble cocoamphodipropionate slowly, followed by the addition of 1 M acetic acid aqueous solution to adjust the pH value to about 4–5. The mixture was stirred overnight at room temperature. The organic modified clay was separated by ultracentrifugation (9000 rpm, 30 min) and the washing step was repeated at least three times.Reference Roy, Gupta, Sindhu, Madras and Ramamurthy19
IV. PREPARATION OF THE PMMA/MMT CLAY COMPOSITES
The typical procedure for preparation of PMMA/MMT clay composites with 10 wt% clay loading is explained. First, an appropriate amount of modified clay (1 g) was suspended into 30 mL of toluene under magnetic stirring overnight at room temperature. 10 g of methacrylate monomer and 0.097 g of benzoyl peroxide initiator were added to this solution. Under magnetic stirring, the solution was stirred for 5 h at 75 °C in a nitrogen atmosphere and the final product was precipitated in 800 mL of n-hexane. The product was dissolved in 30 mL of toluene and reprecipitation process was repeated to obtain more pure composites. The PMMA/clay composites were dried at 80 °C in a vacuum for 5 h.Reference Bouropoulos, Psarras, Moustakas, Chrissanthopoulos and Baskoutas20,Reference Singha, Thomas and Kulkarni21 In a similar manner, other composites (20, 30, 40, and 50 wt%) of PMMA–MMT clay were prepared.
V. CHARACTERIZATION
The above-synthesized PMMA/MMT clay composites were structurally characterized by using Fourier transform infrared spectroscopy (FTIR) and the surface morphology of the composites was studied using scanning electron microscopy (SEM).
The FTIR spectra of PMMA and its composites were recorded on a Perkin Elmer (model 783, Waltham, MA) IR spectrometer in KBr medium at room temperature. For recording FTIR spectra, sample powders were mixed with KBr in the ratio of 1:25 by weight and ground to ensure the uniform dispersion of samples in KBr pellets. The mixed powders were pressed in a cylindrical dye to obtain clean discs of approximately 1 mm thickness.Reference Roy, Parveen, Deshpande, Bhat and Koppalkar22
VI. SCANNING ELECTRON MICROSCOPY
The surface morphology of PMMA/MMT clay composites was studied by using Phillips XL30 ESEM scanning electron microscope (SEM). The powder samples are dispersed on the surface of carbon tape which is mounted on an aluminum tab, conducting gold is sputtered on the sample to avoid charging at the sample surfaces, and selected areas were photographed. The grain size was calculated using a linear intercept technique, and the average grain size was calculated using the following equation:
 $${\rm{Grain\,size}}\,\left( P \right) = 1.56{C \over {MN}}\quad {\rm{,}}$$
where C is the length of the test line(s), N is the number of intercepts, and M is the magnification calculated from the reference scale printed on the micrograph.
VII. CONDUCTIVITY MEASUREMENTS
DC electrical conductivities are measured by using Keithley 2100 electrometer (Bangalore, India) to measure the resistance of the sample under investigation using two probe methods. The PMMA/MMT clay composite films of 2 mm thickness were coated with silver paste on either surface for better contacts. The dielectric tangent loss and dielectric constant are studied by sandwiching the pellets of these composites between the silver electrodes in the frequency range of 102–106 Hz using the Hioki LCR Q meter.
VIII. MECHANICAL PROPERTY MEASUREMENTS
The tensile properties of PMMA and PMMA–MMT clay composite films for different weight percentages (10, 20, 30, 40, and 50 wt%) were measured with a universal testing machine (Instron-5543) under a 1 kN load cell at a constant cross-head speed of 3 mm/min. At least five specimens were tested for each sample, and the tensile properties are reported on average.
IX. RESULTS AND DISCUSSION
Figure 1(a) shows the FTIR spectra of pure PMMA in which the stretching band of C=O appeared at 1727 cm−1, and the methyl ester groups had absorption peaks in the range of 1145–1240 cm−1. A characteristic absorption peak of α-CH3 was at 989 cm−1. The pure MMT clay spectra show the two important characteristic peaks at 728 and 528 cm−1 [Fig. 1(c)].Reference Roy, Koppalkar and Ambika Prasad23,Reference Kontos, Soulintzis, Karahaliou, Psarras, Georga, krontiras and Pisanias24 According to the data shown in Fig. 1(b), in the PMMA–MMT clay composites, the primary characteristic peaks of fly ash and PMMA can be easily found in the FTIR spectrum of the composite films, indicating an integrated chemical behavior of both the materials maintained in the composite film which forms due to the van der Waal's bonds with PMMA matrix.Reference Raghavendra, Khasim, Revanasiddappa, Ambika Prasad and Kulkarni25
(a–c) FTIR spectra of PMMA, PMMA–MMT clay composite, and MMT clay.

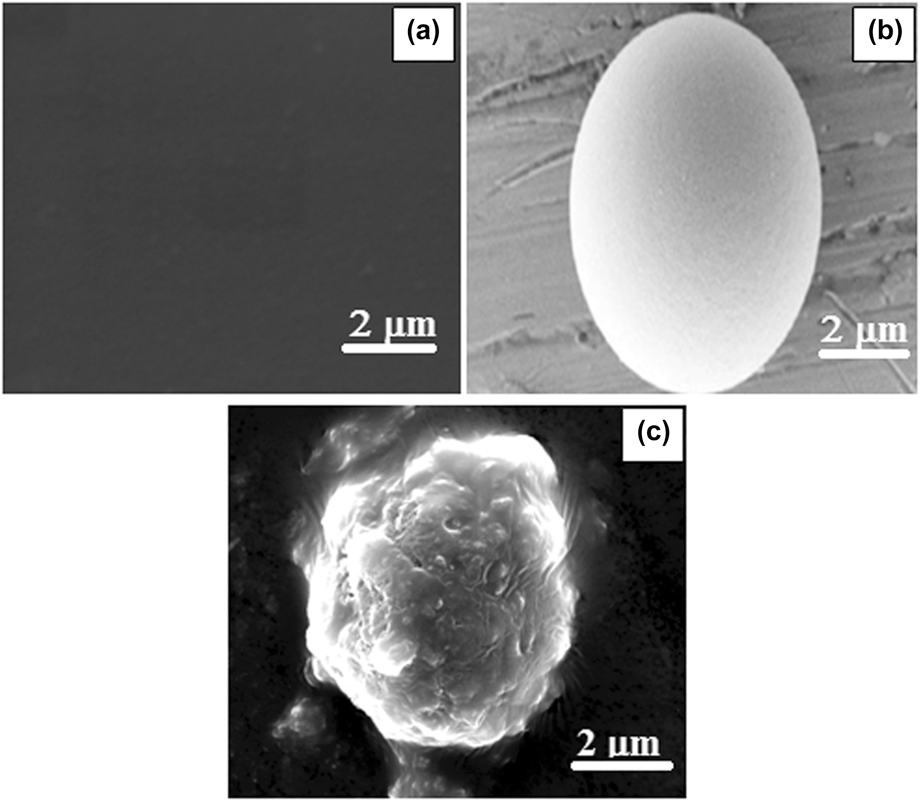
SEM images of PMMA, MMT clay, and PMMA–MMT clay composite films are shown in Figs. 2(a)–2(c). It is observed that the PMMA film surface is very smooth without any crack when prepared with toluene which is dried at 80 °C under dynamic vacuum. This may be the reason for slow evaporation which helps in the condensation process of the polymer film as found in Fig. 2(a). The pure MMT clay is treated with acid and then followed by base to remove the clean MMT clay particles which appear spherical in shape with 2 μm in size as shown in Fig. 2(b). When toluene-dispersed MMT clay is mixed with PMMA solution, it is observed that the PMMA encapsulated over the particles and found that the average particle size is about 2 μm.
(a–c) SEM images of pure PMMA, MMT clay, and PMMA–MMT clay composite.
X. DC CONDUCTIVITY
Figure 3 shows the variation of DC conductivity as a function of temperature for PMMA and PMMA/MMT clay composite films for different weight percentages. It is observed that the conductivity of PMMA composites increases with increase in temperature as well as with increasing MMT clay content. Three steps of conductivity are observed in the range of 30–250 °C. In the first step, when the temperature is between 30 and 160 °C, the conductivity of the pure PMMA and PMMA/MMT clay composite films remains constant due to insufficient activation energy that can cause hopping of charges from one localized site to another.Reference Roy, Gupta, Sindhu, Ramamurthy and Madras26 In the second step, when the temperature is in the range of 160–220 °C, the conductivity increases gradually due to the hopping of charge carriers in the short range order. Further, in the third step, from 160 to 250 °C, the conductivity suddenly increases due to hopping of charge carriers in the long range order. The three-step conductivity is characteristic property of semiconducting materials explained by Mott theory. Among all the composites, 30 wt% of PMMA/MMT clay composite shows highest conductivity of 1.59 × 10⁻³ S/cm due to the elongation of polymer chains in framed network favorable of hooping charge carriers in long range orders and absorbed 2.97 eV. The conductivity of pure PMMA and other composites like 10, 20, 40, and 50 are followed by 30 wt%, and their conductivity is lower due to the partial blocking of charge carriers at the interface of composites and MMT clay surface.Reference Chang, An, Cho and Giannelis27 However, the thermal expansion of polymer chains in the composite is confirmed from negative thermal coefficient plot as shown in Fig. 4. It is observed that the composite shows negative thermal coefficient (NTC) behavior as a function of temperature. The NTC value decreases with increase in MMT clay weight percentages in PMMA due to the decrease in the distance between the two surfaces.Reference Rogers, Takacs and Thompson28 It is also known that the thermal expansion will cause significant stress in the matrix as the filler does not allow expansion or contraction, which increases the electron density at the junction causing the blocking of charge carriers.Reference Yin, Xu, Xia, Ge and Zhang29
DC conductivity of PMMA and its composites for various weight percentages.
NTC behavior of PMMA and its composites.
XI. DIELECTRIC STUDY
The variation of real part of permittivity as a function of applied frequency is shown in Fig. 5, for various loading of PMMA/MMT clay composite films. It is observed that the relative permittivity of the composites initially increases with increase in applied frequency from 102 to 103 Hz and after that it remains constant throughout the applied frequencies at room temperature. There are two types of relaxation that were observed in these composites. Initial increase in the real permittivity may be due to the Debye type relaxation mechanism and a further decrease in the value is because of the non-Debye type relaxation mechanism, i.e., independent to the higher frequency region.Reference Sayo, Deki and Hayashi30 PMMA is an electrical insulator that can be polarized by an applied electric field. When a dielectric is placed in an electric field, electric charges do not flow through the material as they do in a conductor but only slightly shift from their average equilibrium positions causing dielectric polarization. Because of dielectric polarization, positive charges are displaced toward the field and negative charges shift in the opposite direction. This creates an internal electric field that reduces the overall field within the dielectric itself. It is also interesting to note that the dispersion occurs up to 104 Hz, because at the lower frequency, all types of polarization occur and among polarization, Maxwell–Wagner–Sillars (M-W-S) polarization is more predominant as it is a nonisotopic film where a separation of charges occurs either at inner dielectric boundary layers on a mesoscopic scale, or at the external electrode-sample interface on a macroscopic scale.Reference Corbierre, Cameron and Lennox31 At higher frequencies above 104 Hz, dipole polarization is more pronounced and as a result the real permittivity value decreases. Among all composites, it is observed that the 30 wt% composition has low value because M–W polarization is more dominant and dipole polarization is weak in this case. Therefore, at higher frequencies, relative permittivity decreases with increase in the MMT clay weight percentage in PMMA but above 30 wt% composition its value decreases to 0.87.
Variation of real part of permittivity against applied frequencies.
Figure 6 shows the variation of imaginary part of permittivity (εʺ) as a function of frequency for various weight percentages of PMMA/MMT clay composites. It is observed that εʺ value decreases with increase in frequency because of tunneling of free charges through the intestinal position of the PMMA/MMT clay composite film. Initially the imaginary part of complex permittivity gradually decreases till 103 Hz and after that it remains constant up to 106 Hz of the applied frequencies.Reference Yen, Chang and Kakinoki32 These results indicate that the decrease in permittivity is mainly because of the interfacial polarization between the pellet surface and electrode, i.e., formation of dipole at the interface of two opposite charge carriers.
Variation of imaginary part of permittivity as a function of frequency.
The variation of quality factor (Q) as a function of frequency is shown in Fig. 7 for various weight percentages of PMMA/MMT clay composites. It is observed that the Q values change with applied frequencies as well as with the increasing filler concentration. The quality factor value was observed to be constant initially; however, after 104 Hz it gradually increases and reaches to a maximum peak at 106 Hz.Reference Hussain, Brust, Papworth and Cooper33 It is found that the Q value is less than 0.005; therefore, it is called overdamped, i.e., the charge carrier does not oscillate at all but at the equilibrium, a hump is formed due to steady state of electron flow through PMMA/MMT clay interface asymptotically. Among all composites, 30 wt%, shows the highest value of 0.0056 followed by other compositions.
Variation of quality factor (Q) as a function of frequency.
The variation of real part of impedance (Zʹ) against frequency is shown in Fig. 8. It is observed that the relative impedance value decreases with increase in frequency as well as the MMT clay concentration in PMMA. There are three different processes that occur in the multiphase composite system associated charge carriers, dielectric dispersion usually arising from angular rotation and the presence of both types of dispersion within a measured frequency range. The occurrence of relaxation peaks in the real part of complex impedance at low frequencies with temperature may be due to the existence of the interfacial relaxation at low frequencies, which is related to the charge carriers.Reference Mayer and Mark34 Therefore, electrical resistance decreases with decrease in complex impedance. The Cole–cole graphs show that there is a decrease in the electrical resistance with increase in MMT clay concentration as well as the applied frequency, as shown in Fig. 9. The impedance value of the composites depends on the surface resistance and grain resistance of the composites. The bulk resistance and grain resistance decrease and as a result the impedance value also decreases.Reference Kumar, Koltypin, Cohen, Aurbach, Palchik, Felner and Gedanken35 It is observed that as the filler concentration increases, the area under the curve also decreases indicating that there is a sharp drop in the resistance due to the formation of LCR series circuit. The formation of semicircular arc indicates that the two different components in the composites are of parallel geometry, as a result the bulk resistance decreases as shown in the inset of Fig. 9. It is noticed that there is a formation of single semicircles and it shows that relaxation time decreases till 30 wt%, and after that the relaxation time increases which is due to the increase in grain resistance.
Variation of real part of impedance against frequency.
Cole–cole graphs of PMMA and its composites.
Figure 10 shows the variation of tanδ as a function of frequency for various weight percentages of PMMA/MMT clay composites. It is observed that the dielectric loss decreases with increase in applied frequency. These composites lose very small amount of energy after 104 Hz due to the formation of permanent dipole at higher frequency and further increases at a frequency of 106 Hz, reduces the loss completely, which suggest that these materials can be used as lossless materials in transistor, microelectronic devices etc. Among all composites, 30 wt% shows the low dielectric losses compared to other composites and this may be due to the low grain boundary resistance.Reference Strawhecker and Manias36
Variation of tan delta as a function of frequency.
The σac conductivity of PMMA/MMT clay composite variation is shown in Fig. 11 against applied frequency. The ac conductivity increases with increase in frequency. Among all composites, 30 wt% shows high conductivity of 4.7 × 10⁻³ S/cm, which is due to its low electrical resistance and dielectric constant. Above 30 wt% loadings, all other composite films show less conductivity due to predominant dipole polarization which results in increase in dielectric constant. Thus a short range hopping of the charges through trap sites separated by different energy barriers is observed which results in lower conductivity.
AC conductivity of PMMA and PMMA/MMT clay composite variation.
XII. MECHANICAL PROPERTIES
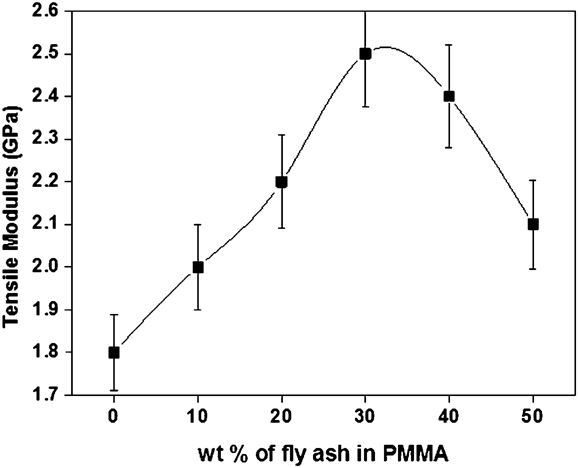
Figure 12 shows the tensile modulus of PMMA and PMMA/MMT clay composites for different weight percentages. It is observed that the tensile elongation increases with increase in MMT clay weight percentage due to the high aspect ratio of MMT clay. It is also interesting to notice that elongation properties of these composites increase up to 30 wt% after that the tensile modulus value decreases due to several factors such as agglomeration of particles, orientation of fillers, inhomogeneous distribution of particles and the method of preparation.Reference Lim and Ast37 Among all the composites, 30 wt% of PMMA–MMT clay composites shows high tensile modulus of 2.6 GPa. This increase in the elongation tensile indicates that the MMT clay significantly improves the mechanical property.Reference Huang and Brittain38 The tensile strength against strain graph is shown in Fig. 13 for different weight percentages of PMMA–MMT clay composite films. It is found that the tensile strength of the composite films increases with increase in filler concentration up to 30 wt% after that it decreases. The tensile strength increases initially with loading which induces the strain in to the polymer composite film and after certain point it leads to deformation of the composite films.Reference Manna, Batabyal and Nandi39,Reference Jewrajka and Chatterjee40 It is interesting to note that when we applied a maximum load of 55 MPa on the samples it induced the 8% strain into it after that it remains constant. Among all composites, 30 wt% shows the high tensile strength due to isotropic nature of the composite film.
Tensile modulus of PMMA and PMMA/MMT clay composites.
Tensile strength against strain graph for PMMA and its composites.
XIII. CONCLUSION
Poly(methyl methacrylate)/MMT clay composite film was prepared by solvent casting method for different weight percentages. The prepared composite films were characterized by FTIR and SEM. The important characteristic peaks are observed at 1727 cm−1 for stretching band of C=O, the methyl ester groups had absorption peaks in the range of 1145–1240 cm−1, absorption peak of α-CH3 was at 989 cm−1 and two important characteristics peaks at 728 and 528 cm−1 for MMT clay in composite films confirms the formation of composites. SEM image shows very smooth surface of pure PMMA and in composites the MMT clay is encapsulated with polymer with an average size of 2 μm. Furthermore, the DC conductivity shows that the 30 wt% has highest conductivity of 1.59 × 10⁻³ S/cm due to the elongation of polymer chain which helps in charge transport mechanism and it is confirmed by NTC graph. Dielectric study shows that the 30 wt% has lowest dielectric constant and dielectric loss of 2.5 and 3.3, respectively, which result in increasing conductivity of 5 × 10⁻³ S/cm. The high quality factor (Q) value found for 30 wt% is 0.005 because of overdamping of electron on the isotropic surface of the composite films at 104 Hz. Cole–cole plots show semi arc curve originated from a single point and its area decreases with filler concentration up to 30 wt% because the electrical resistance decreases. Tensile modulus increases because of high MMT aspect ratio and distribution ratio. Among all composites, 30 wt% of the composite shows high tensile strength at 55 MPa which induced 8% of strain in the PMMA–MMT clay composite films. It is observed that the MMT significantly improves the electrical and mechanical properties of the composites; hence, these composites materials are of potential use in many technological applications such as transistor, microelectronic, sensor, solar encapsulation materials etc.