


Introduction
Although numerous studies have explored the mental health impact of the COVID-19 pandemic, early research predominantly relied on cross-sectional data. As the pandemic progressed, more studies adopted longitudinal designs. However, most relied solely on data collected during the pandemic, lacking pre-pandemic baseline assessments, and examined population-level trends based on group means or prevalence estimates rather than modelling within-person symptom change (Cénat et al., Reference Cénat, Farahi, Dalexis, Darius, Bekarkhanechi, Poisson, Broussard, Ukwu, Auguste, Nguyen, Sehabi, Furyk, Gedeon, Onesi, El Aouame, Khodabocus, Shah and Labelle2022). Such designs do not allow for disentangling pandemic-related changes from pre-existing mental health problems, a gap that more recent studies have tried to address by incorporating pre-pandemic data. Yet their findings have been inconclusive: some report slight increases in depressive and anxiety symptoms (Penninx et al., Reference Penninx, Benros, Klein and Vinkers2022; Witteveen et al., Reference Witteveen, Young, Cuijpers, Luis Ayuso-Mateos, Barbui, Bertolini, Cabello, Cadorin, Downes, Franzoi, Gasior, Gray, Melchior, Humphrey van Ommeren, Palantza, Purgato, van der Waerden, Wang and Sijbrandij2023), while others report stability or modest improvement (Sun et al., Reference Sun, Wu, Fan, Dal Santo, Li, Jiang, Li, Wang, Tasleem, Krishnan, He, Bonardi, Boruff, Rice, Markham, Levis, Azar, Thombs-Vite, Neupane, Agic, Fahim, Martin, Sockalingam, Turecki, Benedetti and Thombs2023). These inconsistencies may stem from group-level analyses that obscure meaningful individual-level variation in responses to adversity, thereby prompting a growing interest in identifying mental health trajectories over time. Trajectory studies including pre-pandemic assessments have revealed diverse symptom patterns, from stability to worsening or improvement (Ellwardt and Präg, Reference Ellwardt and Präg2021; Pierce et al., Reference Pierce, McManus, Hope, Hotopf, Ford, Hatch, John, Kontopantelis, Webb, Wessely and Abel2021; Lu et al., Reference Lu, Contrand, Dupuy, Ramiz, Sztal-kutas and Lagarde2022; Qi et al., Reference Qi, Lepe, Almansa, Ots, de Kroon, Boezen, Mierau, Franke, Dekens, Deelen, Lanting, Vonk, Nolte, Ori, Claringbould, Boulogne, Dijkema, Wiersma, Warmerdam, Jankipersadsing, Vrooman, Reijneveld and Brouwer2022; Bayes-marin et al., Reference Bayes-Marin, Cabello-Toscano, Cattaneo, Solana-Sánchez, Fernández, Portellano-Ortiz, Tormos, Pascual-Leone and Bartrés-Faz2023; Klokgieters et al., Reference Klokgieters, Penninx, Rius Ottenheim, Giltay, Rhebergen and Kok2023; Kunzler et al., Reference Kunzler, Lindner, Röthke, Schäfer, Metzendorf, Sachkova, Müller-eberstein, Klinger, Burns, Coenen and Lieb2023; Blendermann et al., Reference Blendermann, Ebalu, Obisie-orlu, Fried and Hallion2024). These studies, however, relied on single cohorts, drawn either from the general population or from samples of individuals with previously diagnosed mental disorders (hereafter referred to as clinical populations), without integrating data across samples or enabling direct comparisons between groups. For instance, Klokgieters et al. (Reference Klokgieters, Penninx, Rius Ottenheim, Giltay, Rhebergen and Kok2023) examined the same clinical cohorts as the present study but combined clinical populations and healthy controls into one group, limiting the ability to examine group-specific symptom trajectories.
Building on this, the current study used pooled longitudinal data from multiple international cohorts, each including pre-pandemic assessments, to examine trajectories of anxiety and depressive symptoms in general and clinical populations during the pandemic. This approach enabled a more precise examination of symptom change across different phases of the pandemic, while accounting for differences between individuals with and without pre-existing mental disorders. By integrating diverse cohorts and contexts, the study captured heterogeneity across groups within a unified framework. Its multicountry design, with cohorts exposed to varying levels of pandemic severity, government responses and COVID-related stressors (e.g., job insecurity and economic strain), further contributed valuable contextual diversity for interpreting mental health patterns (Varga et al., Reference Varga, Bu, Dissing, Elsenburg, Bustamante, Matta, van Zon SKR, Brouwer, Bültmann, Fancourt, Hoeyer, Goldberg, Melchior, Strandberg-Larsen, Zins, Clotworthy and Rod2021). The study aimed to (i) identify distinct trajectories of anxiety and depressive symptoms from pre-pandemic to pandemic phases, (ii) examine differences in trajectory patterns between general and clinical populations and (iii) explore how sociodemographic characteristics and COVID-related stressors relate to trajectory membership.
Methods
Study design and participants
This study used individual participant data from six cohort studies. Three general-population cohorts from France and Germany were drawn from the Co-RESPOND project (Petri-Romão et al., Reference Petri-Romão, Stoffers-Winterling, Dörschner, Jurgeit, Gödde, Hecker, Melchior, Czepiel, Witteveen, van der Ven, Sijbrandij, Mediavilla, Ayuso-Mateos, Smith, Lorant, Monistrol-Mula, Haro Abad, Gémes, Mittendorfer-Rutz, Monzio-Compagnoni, Lora, Caggiu, Conflitti, Kalisch and Lieb2025), which aimed to identify groups most susceptible to negative mental health outcomes during the COVID-19 pandemic and to examine factors contributing to this susceptibility. The following cohorts were included because they had at least one pre-pandemic and two pandemic assessments: LOngitudinal Resilience Assessment (LORA) (Chmitorz et al., Reference Chmitorz, Neumann, Kollmann, Ahrens, Öhlschläger, Goldbach, Weichert, Schick, Lutz, Plichta, Fiebach, Wessa, Kalisch, Tüscher, Lieb and Reif2021), MAinz Resilience Project (MARP) (Kalisch et al., Reference Kalisch, Köber, Binder, Ahrens, Basten, Chmitorz, Fiebach, Goldbach, Horstmann, Kampa, Kollmann, Lieb, Plichta, Reif, Schick, Sebastian, Wessa, Yuen, Tüscher and Engen2020) and Trajectoires ÉpidéMiologiques en POpulation (TEMPO) (Mary-Krause et al., Reference Mary-Krause, Herranz Bustamante, Bolze, Galéra, Fombonne and Melchior2021). To enable comparisons with the clinical population, we additionally included three Dutch cohorts of individuals with mental disorders clinically diagnosed prior to the pandemic. These comprised two patient-control cohorts (NEtherlands Study of Depression and Anxiety [NESDA; Penninx et al., Reference Penninx, Beekman, Smit, Zitman, Nolen, Spinhoven, Cuijpers, de Jong, van Marwijk, Assendelft, van der Meer, Verhaak, Wensing, de Graaf, Hoogendijk, Ormel and van Dyck2008] and NEtherlands Study of Depression in Older persons [NESDO; Comijs et al., Reference Comijs, van Marwijk, van der Mast, Naarding, Oude Voshaar, Beekman, Boshuisen, Dekker, Kok, de Waal, Penninx, Stek and Smit2011]), and one patient-only cohort (Netherlands Obsessive Compulsive Disorder Association study [NOCDA; Schuurmans et al., Reference Schuurmans, van Balkom, van Megen, Smit, Eikelenboom, Cath, Kaarsemaker, Oosterbaan, Hendriks, Schruers, van der Wee, Glas and van Oppen2012]). Healthy controls from the patient-control cohorts were analysed as part of the general population sample. All cohorts underwent retrospective harmonization following Maelstrom guidelines (Fortier et al., Reference Fortier, Raina, van den Heuvel, Griffith, Craig, Saliba, Doiron, Stolk, Knoppers, Ferretti, Granda and Burton2017). For the statistical analyses, four assessment points were selected: the last available pre-pandemic measurement (last assessment prior to 1 January 2020) and three assessment points throughout the pandemic selected to capture peak and low periods in COVID-19-related deaths, as documented in the World Health Organization COVID-19 Dashboard (World Health Organization, 2023). Pre-pandemic assessments ranged from 2018 to 2019 for the general population cohorts and from 2012 to 2016 for the clinical cohorts. Further details on cohort characteristics, selection of assessment points and ethical approvals are provided in the Supplementary Material (see also Supplementary Table 1 and Supplementary Figure 1).
Measures
Sociodemographic variables
The harmonized sociodemographic variables included in this study were age, gender, completed education level, relationship status, presence of children in the household, living alone, history of mental health problems prior to the pandemic and chronic (physical) illness (for full response categories for all variables, see Supplementary Table 2). All sociodemographic variables were measured at the pandemic baseline, except for relationship status and chronic illness in the Dutch cohorts, where the most recent pre-pandemic data were used.
Anxiety and depressive symptoms
Anxiety and depressive symptoms were assessed using validated instruments, including the General Health Questionnaire-28 (Goldberg and Hillier, Reference Goldberg and Hillier1979), the Beck Anxiety Inventory (Beck et al., Reference Beck, Brown, Epstein and Steer1988), the Achenbach Adult Self-Report (Achenbach, Reference Achenbach, Kreutzer, DeLuca and Caplan2018), the self-report Quick Inventory of Depressive Symptomatology (Rush et al., Reference Rush, Trivedi, Ibrahim, Carmody, Arnow, Klein, Markowitz, Ninan, Kornstein, Manber, Thase, Kocsis and Keller2003) and the Beck Depression Inventory (Beck et al., Reference Beck, Ward, Mendelson, Mock and Erbaugh1961). To account for differences across instruments and timepoints, symptom scores were standardized to z-scores within each cohort, a common practice in individual participant data analyses (Griffith et al., Reference Griffith, van den Heuvel, Fortier, Sohel, Hofer, Payette, Wolfson, Belleville, Kenny, Doiron and Raina2015). Internal consistency in the current study ranged from adequate (0.66) to excellent (0.96) (Taber, Reference Taber2018), with exact Cronbach’s alpha coefficients presented in Supplementary Table 1. More information about the instruments can be found in the Supplementary Material.
COVID-related stressors
COVID-related stressors were selected based on availability in at least half of the cohorts. As a result, childcare burden, financial concerns, job insecurity, COVID-19 symptoms and concerns about infection were included. To facilitate harmonization, each stressor was collapsed across waves into an ever/never indicator and coded as ever reported if endorsed at any of the included pandemic waves. For details on the cohort-specific items used to construct the COVID-related stressor variables, see Supplementary Table 3.
Statistical analysis
Due to violation of the normality assumption, medians are reported, and non-parametric tests were used where applicable. Descriptive analyses were performed using Stata (version 17.0), while all other analyses were conducted in RStudio (version 4.2.2). Missing data were addressed through multiple imputation within each cohort using Chained Random Forests (MissRanger package; version 2.4.0), a method well-suited for capturing non-linear patterns and interactions relevant for subsequent analyses. The number of trees was set to 128, following the recommendations of Oshiro et al. (Reference Oshiro, Perez and Baranauskas2012), with convergence achieved in three iterations for all cohorts. To assess potential bias, we differentiated between participants with and without substantial incomplete data, with the former defined as having more than 50% missing items on any of the outcome measures. Differences between these two groups were examined using Wilcoxon rank-sum tests for continuous variables and chi-square tests for categorical variables.
To identify trajectories of anxiety and depressive symptoms, latent growth mixture modelling (LGMM) was performed using the lcmm package (version 2.1.0). The GRoLTS-checklist has been followed for transparent reporting (van de Schoot et al., Reference van de Schoot, Sijbrandij, Winter, Depaoli and Vermunt2017). LGMM analyses were conducted separately for general and clinical population samples. Models incorporated both linear and non-linear growth terms, with fit assessed via Akaike Information Criteria (AIC) and Bayesian Information Criteria (BIC), entropy and posterior probabilities. To avoid overfitting, models including very small classes (<5% of participants) were rejected, prioritizing interpretability and stability. Final model selection was based on fit indices and interpretability (Jung and Wickrama, Reference Jung and Wickrama2008). Sensitivity analyses stratified by gender explored potential gender-specific differences in symptom trajectories. In the clinical population, additional sensitivity analyses stratified by the interval between the last pre-pandemic and first pandemic assessment (6–8 vs. 4–6 years) were performed to evaluate potential effects of assessment timing on the robustness of the trajectories identified. Logistic regressions using the nnet package (version 7.3.19) were conducted to identify factors associated with trajectory membership. Participants were allocated to their most likely trajectory according to the calculated posterior probabilities. The results of the regression analyses are reported as adjusted odds ratios along with 95% confidence intervals. A significance threshold of .05 was applied to all statistical tests, with Bonferroni corrections used where appropriate to adjust for multiple testing. Further details on imputation procedures, model specifications and sensitivity analyses are available in the Supplementary Material.
Results
Descriptive statistics
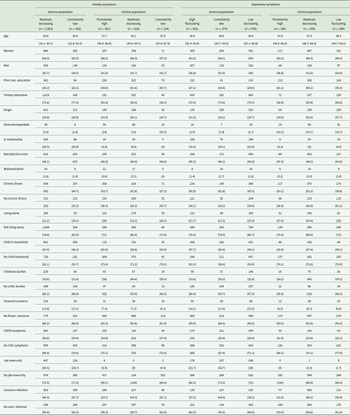
The study included 2,882 participants: 1,813 from the general population and 1,069 from the clinical population. The median age at the first pandemic wave was 39.8 years for the general population and 57.4 years for the clinical population. Women comprised the majority in both groups (64.6% and 67%). Most individuals from the general population had tertiary education (74.7%), while secondary education was most common in the clinical group (59%). Approximately half were married or in a civil union (45.6% of the general and 44.7% of the clinical population), and most did not live alone (79.6% and 69%, respectively). Chronic (physical) illness was reported by 42.5% of the general and 62% of the clinical population. The most common pandemic-related stressor for both groups was fear of infection (39.7% and 42.7%). Financial concerns (13.6%) and job insecurity (0.6%) were the least reported stressors in the general and clinical population, respectively. More comprehensive population-specific and cohort-specific information is provided in Supplementary Table 2. No significant differences in sociodemographic characteristics or reported anxiety and depressive symptoms were found between participants with complete and incomplete data, except that the former more often reported having experienced COVID-19 symptoms, while the latter more often reported pre-pandemic mental health problems (see Supplementary Table 4).
Trajectories of anxiety and depressive symptoms in the general and clinical population
Fit indices for the LGMM models for anxiety and depressive symptoms stratified by population are presented in Table 1. Classification quality metrics (average posterior probability and percentage of individuals with posterior probabilities above 0.80) and parameter estimates for the selected models can be found in Supplementary Table 5. Analyses demonstrated good model convergence, with models including random intercepts and random slopes providing the best overall fit. Descriptive statistics for sociodemographic characteristics and COVID-related stressors across trajectory groups are presented in Table 2.
Fit indices for trajectories of anxiety and depressive symptoms stratified by population

Table 1 Long description
The table reports model fit statistics (log likelihood, AIC, BIC, and entropy) for latent class trajectory models of anxiety and depressive symptoms, stratified by general and clinical populations. For each outcome, fit is presented for three model structures (fixed effects only; random intercepts only; random intercepts plus random slopes) and for one through five latent classes. Across outcomes and populations, log likelihood generally becomes less negative and AIC and BIC decrease as additional classes are added, indicating improved statistical fit with increasing model complexity. Although AIC and BIC continued to decrease for most models with additional classes, particularly the five-class random-intercept-and-random-slope models, the models were selected as having best fit reflect consideration of overall model performance rather than selection based solely on the lowest AIC or BIC values. Bold values indicate the models selected as providing the best balance of fit, class separation, and interpretability. For anxiety symptoms, the selected models were the random-intercept-and-random-slope two-class model in the general population (AIC = 15212.78, BIC = 15328.51, entropy = 0.83) and the random-intercept-and-random-slope three-class model in the clinical population (AIC = 9498.34, BIC = 9633.65, entropy = 0.77). For depressive symptoms, the selected models were the random-intercept-and-random-slope three-class models in both the general population (AIC = 8328.97, BIC = 8477.77, entropy = 0.87) and the clinical population (AIC = 10663.36, BIC = 10798.66, entropy = 0.67).
Notes: Log likel. = log likelihood. Classes 1–5 refer to the number of latent classes specified in the latent growth mixture models. Values in bold represent the model chosen as the best fit.
Sociodemographic characteristics and COVID-related stressors stratified by trajectory group and population (n [%]; age: median [interquartile range])

Table 2 Long description
The table compares sociodemographic characteristics and COVID-related stressors across symptom trajectory groups for anxiety and depression, separately for general and clinical populations, with group sizes shown. Variables include age, sex, educational attainment, relationship status, chronic illness, living arrangement, presence of children in the household, childcare burden, financial concerns, COVID-19 symptoms, job insecurity, and concerns about infection. COVID-related stressors were classified based on ever reporting the stressor during the study period, such that percentages reflect reporting at least once rather than at a single assessment time point. Several participant characteristics vary across trajectory groups, particularly within the clinical population. For anxiety trajectories in the clinical population, the consistently low group contained the lowest proportion of women (57.3%) compared with the moderate decreasing (68.3%) and persistently high (68.2%) groups. Educational attainment also varied, with primary or secondary education being most common in the consistently low group (63.7%), followed by the moderate decreasing (61.4%) and persistently high (54.6%) groups. Childcare burden was reported most frequently in the consistently low (59.4%) and persistently high (58.0%) groups and least frequently in the moderate decreasing group (44.4%). For depressive symptom trajectories in the clinical population, childcare burden was most common in the low fluctuating group (59.5%), followed by the persistently high (54.2%) and moderate decreasing (46.0%) groups. Reported COVID-19 symptoms were most common in the persistently high group (31.9%) and less common in the moderate decreasing (23.9%) and low fluctuating (22.1%) groups. The distribution of other sociodemographic characteristics and COVID-related stressors was generally similar across trajectory groups within the same population.
Notes: Prim./sec. education = primary/secondary education; child in household = children in household; no child household = no children in household; no child. burden = no childcare burden; no financ. concerns = no financial concerns; no COV. symptoms = no COVID symptoms; no conc. infection = no concerns about infection. Sociodemographic variables were assessed at the pandemic baseline, except for relationship status and chronic illness in the clinical cohorts, which were derived from the most recent pre-pandemic assessment conducted between 2012 and 2016. Participants were classified as experiencing a COVID-related stressor if they endorsed it at least once across any included assessment (ever reported).
Anxiety symptoms
Both the general and clinical populations exhibited a predominant Moderate decreasing anxiety trajectory (76.3% and 49.4%, respectively), though the timing of symptom decline differed: in the general population, anxiety levels began to decrease shortly after the onset of the pandemic, whereas in the clinical population, the decline occurred after the second pandemic peak. A Consistently low anxiety group was identified in both populations (23.7% and 12.4%, respectively), marked by stable, low symptom levels over time. A key difference between the populations was the presence of a Persistently high anxiety trajectory in the clinical population (38.2%), which was not observed in the general population. The trajectories of the selected models are depicted in Figure 1(a) (general population) and (b) (clinical population), while the trajectories for the non-selected models are shown in Supplementary Figure 2A and B for the respective populations. Individual observed trajectories are presented in Supplementary Figure 4A and B.
Trajectories of anxiety symptoms and factors associated with trajectory membership in the general population (a) and clinical population (b) for the selected model.

Figure 1 Long description
The figure contains two panels showing anxiety symptom trajectories and adjusted odds ratios for factors associated with trajectory membership. Panel A presents results for the general population and Panel B for the clinical population. Each panel contains a line graph above and a forest plot below. In both line graphs, the y-axis is labelled Anxiety z-score and the x-axis shows four time points: Pre-pandemic, April 2020, December 2020, and July 2021. A vertical dashed line at April 2020 marks the onset of the COVID-19 pandemic. Shaded bands and dashed lines around each trajectory represent uncertainty intervals. In Panel A, two trajectories are shown. The Moderate Decreasing trajectory (76.3%) declines from an anxiety z-score of approximately 0.3 before the pandemic to around 0.0 at the pandemic onset and remains near 0.0 thereafter. The Consistently Low trajectory (23.7%) remains stable at an anxiety z-score of approximately -0.7 to -0.8 across all time points. In Panel B, three trajectories are shown. The Persistently High trajectory (38.2%) remains stable at an anxiety z-score of approximately 0.9 to 1.1 throughout the study period. The Moderate Decreasing trajectory (49.4%) remains close to 0.0 before the pandemic and declines slightly to approximately -0.2 after April 2020. The Consistently Low trajectory (12.4%) remains stable at an anxiety z-score of approximately -0.6 to -0.7 throughout follow-up. The forest plots display adjusted odds ratios and 95% confidence intervals for factors associated with trajectory membership. The x-axis is labelled Adjusted Odds Ratio and includes a vertical reference line at 1, indicating no association. Predictor variables are age, men, primary/secondary education, divorced/separated, in a relationship, married/in civil union, widowed/other relationship status, chronic illness, living alone, children in household, childcare burden, financial concerns, COVID-19 symptoms, job insecurity, and fear of infection. Each predictor is represented by a point estimate and horizontal confidence interval. In Panel A, odds ratios are shown for the moderate decreasing trajectory relative to the consistently low trajectory. In Panel B, odds ratios are shown for the persistently high and moderate decreasing trajectories relative to the consistently low trajectory.
Depressive symptoms
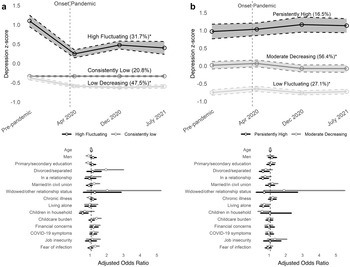
In both populations, the most common trajectory was characterized by decreasing depressive symptoms, though patterns differed. In the general population, a Low decreasing trajectory emerged (47.5%), with slightly below-average symptoms before the pandemic and a gradual decline following its onset. In contrast, the clinical population showed a Moderate decreasing trajectory (56.4%), starting with average symptom levels and a decline emerging around the second pandemic peak. A low symptom trajectory was present in both groups. In the general population, it reflected Consistently low depressive symptoms throughout the study (20.8%), whereas in the clinical population, it showed a Low fluctuating pattern (27.1%), with generally low symptoms that briefly increased early in the pandemic before returning to pre-pandemic levels. A notable difference emerged in the high-symptom trajectories. The general population exhibited a High fluctuating group (31.7%) with initial symptom improvement followed by a partial resurgence, though symptoms remained lower than pre-pandemic levels. In contrast, the clinical population showed a Persistently high group (16.5%) with minimal change over time. The trajectories of the selected models are illustrated in Figure 2(a) (general population) and (b) (clinical population), while the trajectories for the non-selected models are presented in Supplementary Figure 3A and B for the respective populations. Individual observed trajectories are presented in Supplementary Figure 5A and B.
Trajectories of depressive symptoms and factors associated with trajectory membership in the general population (a) and clinical population (b) for the selected model.

Figure 2 Long description
The figure contains two panels showing depressive symptom trajectories and adjusted odds ratios for factors associated with trajectory membership. Panel A presents results for the general population and Panel B for the clinical population. Each panel contains a line graph above and a forest plot below. In both line graphs, the y-axis is labelled Depression z-score and the x-axis shows four time points: Pre-pandemic, April 2020, December 2020, and July 2021. A vertical dashed line at April 2020 marks the onset of the COVID-19 pandemic. Shaded bands and dashed lines around each trajectory represent.
Sensitivity analyses
Gender-stratified trajectory analyses revealed largely similar gender patterns within populations, except for the High fluctuating trajectory of depressive symptoms in the general population, where men’s symptoms returned to pre-pandemic levels by the final wave. However, caution is warranted when comparing trajectories across genders in the general population, as models for men excluded cubic terms due to convergence issues, possibly constraining the flexibility and accuracy of the trajectory shapes. When we stratified the clinical population by the interval between the last pre-pandemic and first pandemic assessment (4–6 vs. 6–8 years), anxiety trajectories were highly consistent across subgroups and closely resembled the original clinical-population trajectories. The same classes appeared in both groups, with the only difference being a clearer decreasing pattern in the Moderate decreasing class among those with more recent pre-pandemic assessments. For depression, trajectories in the group with more recent pre-pandemic assessments closely replicated the original trajectories. However, the group with older assessments showed two deviations: a larger Persistently high class starting at lower pre-pandemic symptom levels and a Moderate decreasing class showing a markedly different pattern, with a sharp initial symptom decrease followed by an increase at later waves. The trajectories from the sensitivity analyses are presented in Supplementary Figures 6–9.
Factors associated with trajectory membership
Results of the logistic regressions performed to identify factors associated with trajectory membership are presented in Table 3. In the general population, older age was associated with trajectories of higher depressive symptoms, whereas in the clinical population, it was linked to lower levels of anxiety. In the general population, divorced or separated individuals were more likely to exhibit stable low symptom trajectories. Specifically, they were more likely to experience stable low anxiety symptoms compared to moderate decreasing symptoms. A similar pattern emerged for depression, with divorced or separated individuals being more likely to show stable low symptoms rather than low but decreasing depressive symptoms. In the clinical population, being in a relationship was associated with lower anxiety levels. Furthermore, in the general population, individuals with children were more likely to experience stable low rather than high depressive symptoms. However, those experiencing childcare burden were more likely to experience stable low symptoms compared to a trajectory of low but decreasing depressive symptoms. Finally, men in the clinical population were more likely to follow trajectories characterized by consistently low anxiety symptoms. No significant factors associated with trajectory membership emerged in the adjusted regression model of depression for the clinical population.
Factors associated with trajectory membership of anxiety and depressive symptoms stratified by population (adjusted odds ratios [95% confidence intervals])

Table 3 Long description
The table reports adjusted odds ratios and 95% confidence intervals for associations between sociodemographic characteristics, COVID-related stressors, and membership in anxiety and depressive symptom trajectories, shown separately for general and clinical populations. Most odds ratios were close to 1 and confidence intervals frequently included the null value, indicating limited evidence for associations with trajectory membership. Significant associations were identified for a small number of demographic characteristics. In the clinical population, compared with the consistently low anxiety trajectory, older age was associated with lower odds of membership in the moderate decreasing anxiety trajectory (OR 0.98, 95% CI 0.96-0.99), while men had lower odds of belonging to both the persistently high (OR 0.65, 95% CI 0.52-0.82) and moderate decreasing (OR 0.69, 95% CI 0.55-0.86) anxiety trajectories. Being in a relationship was also associated with lower odds of membership in these anxiety trajectories. In the general population, divorced or separated participants had lower odds of belonging to the moderate decreasing anxiety trajectory (OR 0.51, 95% CI 0.35-0.75) compared with the consistently low anxiety trajectory. For depressive symptoms in the general population, older age was linked to higher odds of membership in the high fluctuating trajectory compared with the low decreasing trajectory (OR 1.01, 95% CI 1.00-1.03), while having children in the household was associated with lower odds of belonging to the high fluctuating trajectory (OR 0.49, 95% CI 0.29-0.83). Among COVID-related stressors, only childcare burden and concerns about infection showed significant associations, and only in the general population. Childcare burden was associated with higher odds of membership in the consistently low depressive symptom trajectory (OR 1.33, 95% CI 1.10-1.60).
Note: Sociodemographic variables were assessed at the pandemic baseline, except for relationship status and chronic illness in the clinical cohorts, which were derived from the most recent pre-pandemic assessment conducted between 2012 and 2016.
a The Consistently low group was used as a reference group.
b The Low decreasing group was used as a reference group.
c The Low fluctuating group was used as a reference group.
d Reference category = women.
e Reference category = tertiary education.
f Reference category = single.
g Participants were classified as experiencing a COVID-related stressor if they endorsed it at least once across any included assessment (ever reported).
† Small cell sizes produced unstable estimates and excessively wide, unrealistic confidence intervals; categories with few participants were therefore combined.
*p < 0.013 (Bonferroni corrected) and **p < 0.001.
Discussion
Using pooled data from six longitudinal cohorts that tracked mental health before and throughout the COVID-19 pandemic, we examined trajectories of anxiety and depressive symptoms in general and clinical populations. Overall, most individuals experienced stable or decreasing symptoms over a 16-month period. In the general population, approximately 20% exhibited consistently low symptoms, while the remaining 80% showed symptom reduction, even among those with higher initial symptom severity. In the clinical population, roughly half showed relatively stable symptoms, either persistently high or low. The other half, characterized by moderate baseline symptoms, exhibited improvements in symptom severity during the pandemic.
Trajectories of anxiety and depressive symptoms in the general and clinical population
The symptom trajectories identified suggest that reactivity to the pandemic was generally limited, and group-level differences between general and clinical populations were modest. Nonetheless, individuals did exhibit distinct symptom trajectories, underscoring heterogeneity in mental health profiles. In the general population, most experienced moderate decreases in anxiety and depressive symptoms after the pandemic onset, alongside a subgroup with consistently low symptoms. This aligns with findings from Qi et al. (Reference Qi, Lepe, Almansa, Ots, de Kroon, Boezen, Mierau, Franke, Dekens, Deelen, Lanting, Vonk, Nolte, Ori, Claringbould, Boulogne, Dijkema, Wiersma, Warmerdam, Jankipersadsing, Vrooman, Reijneveld and Brouwer2022), who reported symptom improvement during the pandemic, and Schäfer et al. (Reference Schäfer, Kunzler, Kalisch, Tüscher and Lieb2022), who identified resilience and recovery as the predominant trajectories. Unlike studies like Pierce et al. (Reference Pierce, McManus, Hope, Hotopf, Ford, Hatch, John, Kontopantelis, Webb, Wessely and Abel2021) that found initial symptom worsening before improvement, our findings indicate that symptoms either remained stable or declined without evidence of early deterioration. Possible explanations include adaptive coping strategies and healthier habits like exercise and improved nutrition, driven by increased health awareness (Fullana et al., Reference Fullana, Hidalgo-Mazzei, Vieta and Radua2020; Marconcin et al., Reference Marconcin, Werneck, Peralta, Ihle, Gouveia, Ferrari, Sarmento and Marques2022). Additionally, reductions in daily stressors, such as delayed wake times, less commuting, fewer social obligations and more family time (Ahrens et al., Reference Ahrens, Neumann, Kollmann, Brokelmann, von Werthern, Malyshau, Weichert, Lutz, Fiebach, Wessa, Kalisch, Plichta, Lieb, Tüscher and Reif2021), may have lowered perceived stress and supported mental well-being (Kuhn et al., Reference Kuhn, Klaas, Antal, Dasoki, Lebert, Lipps, Monsch, Refle, Ryser, Tillmann and Voorpostel2021).
In the clinical population, although symptom levels were higher than in the general population, our findings do not support the notion that individuals with diagnosed disorders were disproportionately affected by the pandemic. This aligns with previous research (Penninx et al., Reference Penninx, Benros, Klein and Vinkers2022; Blendermann et al., Reference Blendermann, Ebalu, Obisie-orlu, Fried and Hallion2024) and extends it by directly comparing both populations. Approximately half of the clinical sample showed moderate symptom decreases for both anxiety and depression during the pandemic, with improvements emerging around the second pandemic peak, unlike the general population, which showed symptom reductions at pandemic onset. The delayed symptom improvement in the clinical population points to pandemic-related factors as possible drivers of change, rather than regression to the mean, which might have been expected given the long interval between the pre-pandemic and the first pandemic measurement. For some individuals, reduced social demands and expectations and a slower-paced lifestyle may have eased external pressures and offered psychological relief (Pan et al., Reference Pan, Kok, Eikelenboom, Horsfall, Jörg, Luteijn, Rhebergen, van Oppen, Giltay and Penninx2021). The remaining half of the clinical sample maintained stable symptoms, indicating limited pandemic impact. In contrast to the general population sample, where stability generally reflected low symptoms, the clinical population showed stability at both low and high levels, likely shaped by enduring individual or psychosocial factors rather than acute pandemic stressors.
It is important to note that, although trajectories did not indicate overall symptom deterioration at the group level, some individuals in both populations did experience worsening symptoms during the pandemic, as reflected in the individual trajectories and in the sensitivity analyses. These cases highlight the importance of identifying and supporting vulnerable individuals. The sensitivity analyses further indicated a pattern of divergence from the main analyses. Across both the stratification based on the interval since the last pre-pandemic assessment and the gender-stratified models, anxiety trajectories remained largely consistent, closely resembling those observed in the main analyses. In contrast, trajectories of depressive symptoms showed greater variability across subgroups, suggesting greater sensitivity to temporal factors and individual-level characteristics than anxiety trajectories. This pattern aligns with evidence indicating greater trait-like stability in anxiety symptoms and a more state-driven, episodic expression of depressive symptoms over time (Prenoveau et al., Reference Prenoveau, Craske, Zinbarg, Mineka, Rose and Griffith2011).
Factors associated with trajectory membership
While most variables examined did not show significant associations with anxiety or depressive symptom trajectories, a few sociodemographic variables and one pandemic-related stressor did. Notably, none of these factors demonstrated consistent effects across both populations. For instance, older age was linked to different trajectories depending on the population (higher depressive symptoms in the general population but lower anxiety levels in the clinical population), while being a man was associated with more favourable anxiety trajectories only in the clinical population. Relationship status emerged as a significant correlate in both populations, albeit in different ways: in the clinical group, being in a relationship was related to lower anxiety, whereas in the general population, being divorced or separated was associated with lower anxiety and depression. However, this association warrants cautious interpretation in the clinical population, given that relationship status was measured pre-pandemically (up to 8 years before the pandemic for some participants) and may not correspond to relationship status during the pandemic.
The only COVID-related stressor that emerged as a significant factor associated with trajectory membership was childcare burden. Although individuals in the general population reporting childcare burden generally experienced low depressive symptoms, they were less likely to show further reductions in symptom severity over time. This aligns with literature identifying childcare burden, rather than parenthood itself, as the key factor linked to negative outcomes (Chung et al., Reference Chung, Tilley, Netto, Chan and Lanier2024). This distinction is further supported by the current finding that, within the general population, having children was associated with a higher likelihood of showing stable low depressive symptoms, rather than a trajectory marked by high and fluctuating symptoms. Parenthood, therefore, may function as a protective factor for mental health during crises, potentially through providing meaning, purpose and emotional fulfilment (Nelson et al., Reference Nelson, Kushlev and Lyubomirsky2014). This contrasts with research indicating poorer mental health among parents during the pandemic (Hiekel and Kühn, Reference Hiekel and Kühn2022), which may be explained by failure to distinguish parenthood from childcare burden. Together, these findings suggest that the quality of the parenting experience, rather than parenthood alone, is more closely linked to mental health outcomes.
Pandemic-related literature consistently shows that older adults report lower levels of anxiety and depression than younger individuals (Bailey et al., Reference Bailey, Ward, Dicosimo, Baunta, Cunningham, Romero-ortuno, Kenny, Purcell, Lannon, McCarroll, Nee, Robinson, Lavan and Briggs2021; de Bruin WB, Reference de Bruin WB2021), that women experience worse mental health outcomes (Penninx et al., Reference Penninx, Benros, Klein and Vinkers2022; Sun et al., Reference Sun, Wu, Fan, Dal Santo, Li, Jiang, Li, Wang, Tasleem, Krishnan, He, Bonardi, Boruff, Rice, Markham, Levis, Azar, Thombs-Vite, Neupane, Agic, Fahim, Martin, Sockalingam, Turecki, Benedetti and Thombs2023), and that being in a relationship, whether married, cohabiting or dating, is generally associated with better mental health (Pietromonaco and Overall, Reference Pietromonaco and Overall2021). In the current study, these patterns were confirmed within the clinical population: older individuals, men and those in relationships were more likely to show more favourable anxiety trajectories. In contrast, in the general population, divorced individuals were more likely to exhibit more favourable anxiety and depression trajectories, older age was linked to less favourable outcomes and gender showed no effect. This divergence suggests that symptom trajectories in clinical populations may be predominantly shaped by enduring internal factors, while the general population might exhibit greater reactivity to external contextual influences. For example, although both populations faced unprecedented challenges during the pandemic, older adults in the clinical population may have been more accustomed to coping with psychological distress. In contrast, those in the general population, who are typically less exposed to sustained psychological adversity, may have been more vulnerable to the sudden and unfamiliar nature of pandemic-related stressors. Increased worries about mortality and healthcare access, disruption of meaningful activities and heightened social isolation among older adults in the general population may have undermined the typical psychological benefits of ageing (Santini et al., Reference Santini, Jose, York Cornwell, Koyanagi, Nielsen, Hinrichsen, Meilstrup, Madsen and Koushede2020; McKinlay et al., Reference McKinlay, Fancourt and Burton2021). Similarly, divorced and separated individuals, often considered at greater risk for poorer mental health, may have experienced a relative protective effect if they had previously been involved in strained relationships, which generally tended to worsen during the pandemic due to increased marital conflict (Estlein et al., Reference Estlein, Gewirtz-Meydan and Opuda2022). Being separated might have protected them from these amplified relational tensions. In sum, these findings highlight the complex, context-dependent nature of psychosocial factors associated with trajectory membership. Factors like older age and being in a relationship, typically considered protective, may vary in their influence depending on individual circumstances and broader situational contexts, shaping mental health trajectories in nuanced ways.
Strengths and limitations
A major strength of this study is the inclusion of a pre-pandemic assessment for all participants, allowing us to distinguish pandemic-related symptom changes from pre-existing mental health problems and to assess the pandemic’s impact on mental health. Using LGMM, we captured evolving mental health trajectories over time and identified non-linear growth patterns, offering a more dynamic and nuanced understanding than traditional static approaches. Additionally, including cohorts from multiple countries and diverse settings facilitated a more comprehensive examination of mental health trajectories than would be possible with a single-cohort sample. Unlike many previous studies, our analysis also extended beyond the early months of the pandemic, offering insights into its longer-term effects.
However, several limitations should be acknowledged. Standardizing mental health outcomes limits assessment of clinical severity and direct symptom comparisons between populations. It also assumes equivalence of underlying constructs across cohorts, which could not be formally tested, potentially affecting cross-cohort comparability. Comparability may be further limited by differences in the recruitment methods and population characteristics of the included cohorts. Moreover, while our sample includes multiple Western European countries, the clinical sample was drawn solely from the Netherlands and primarily included individuals with depressive, anxiety or obsessive–compulsive disorders, possibly limiting generalizability. An additional limitation lies in the potential overlap between the TEMPO general population cohort and the clinical sample, due to participants who self-reported pre-existing mental health problems. Furthermore, inconsistent availability of data on sociodemographic characteristics and COVID-related stressors across cohorts limited the inclusion of potentially relevant variables, such as socioeconomic status, and possibly reduced power to detect associations, possibly partly explaining the weak associations observed with symptom trajectories. Reliance on pre-pandemic measurements for some sociodemographic factors, combined with the aggregation of COVID-related stressors into single ever/never indicators, has constrained the modelling of temporal variability. These variables may, therefore, be less sensitive than those used in single-cohort studies, which may have attenuated or obscured their relationship to symptom trajectories and may limit direct comparability, calling for cautious interpretation. Additionally, participants with greater distress may have been more likely to drop out, potentially underestimating symptom worsening despite adjustment for attrition in the imputation model. Also, the heterogeneity across cohorts in the timing of their pre-pandemic assessments, together with the long interval between the pre-pandemic and first pandemic assessment in some cohorts, may have influenced trajectory estimation by altering the baseline against which pandemic-period symptom change was assessed. Nevertheless, because our primary aim was to examine the course of mental health during the pandemic rather than to assess absolute differences relative to pre-pandemic levels, the absence of a baseline close to pandemic onset is unlikely to change the overall interpretation of the trajectories. Lastly, although our follow-up period was longer than in many studies, undetected delayed pandemic-related effects cannot be excluded.
Conclusion and implications
Our study offers evidence that challenges the narrative that the COVID-19 pandemic incited a universal mental health crisis, demonstrating that while some adults experienced elevated symptoms, most individuals in both general and clinical populations exhibited stable or modestly improving trajectories. Unlike studies lacking pre-pandemic baselines, which often portrayed the pandemic as a ‘perfect storm’ for mental health deterioration, our findings highlight the importance of proportionate, targeted mental health responses that address the heterogeneous risk profiles found within the population. This is critical in preparing for future outbreaks, where scalable monitoring and stepped-care models can direct resources to those most at risk. The current results also challenge the common assumption that individuals with pre-existing mental health problems are inherently more vulnerable, underscoring the need for tailored care based on individual symptom patterns, not just diagnostic status. Consideration should be given to routine longitudinal monitoring in clinical practice, along with population-wide mental health screenings during crises that incorporate key factors associated with trajectory membership identified in this study, such as age, gender and relationship status. Embedding such measures into health systems and crisis preparedness plans could help detect early signs of deterioration and enable timely, personalized interventions, strengthening ongoing care and rapid response capacity. Additionally, the unique relevance of childcare burden among COVID-related stressors emphasizes the need for policies that ease caregiving burdens, such as accessible childcare, flexible work arrangements and targeted parenting support programs, not only during crises but also in future health emergency planning.
Supplementary material
The supplementary material for this article can be found at https://doi.org/10.1017/S2045796026100778.
Availability of data and materials
The data that support the findings of this study and the analytic code are available from the corresponding author, E.V., upon reasonable request.
Author contributions
D.C., M.S., H.W.H. and E.V. were responsible for the study conceptualization and formulation of the research questions. D.C. harmonized the data across the selected cohorts, carried out the analyses and wrote the initial manuscript draft. E.V., M.S. and T.H. oversaw the statistical analysis. M.S., H.W.H., E.S. and E.V. provided supervision and critically reviewed the manuscript draft. K.F.A., M.E., E.J.G., R.F., A.A.L.K., B.K., K.L., M.M., P.O., B.W.J.H.P., P.P.-R., M.M.P., A.R., T.R., C.S., A.S., J.S.-W., O.T., J.W. and K.S.L.Y. contributed to data collection and coordination within their respective cohorts. All authors contributed to interpreting the results, reviewed earlier manuscript versions and approved the final version.
Financial support
The Co-RESPOND project was funded by the European Union’s Horizon 2020 research and innovation programme Societal Challenges (grant number 101016127). The LORA and MARP cohorts were funded by the German Research Foundation (DFG) through CRC 1193 (subprojects B01, C01, C04, C05, C07 and Z03; LORA-Risk grant number 519365575), the Stiftung Rheinland-Pfalz für Innovation (MARP program, grant number 961-386261/1080), the Ministry of Science of the state of Rhineland-Palatinate (DRZ program) and the European Union’s Horizon 2020 research and innovation program (grant numbers 777084, 667302 and 728018). The TEMPO cohort was supported by the French National Research Agency (ANR), the French Institute for Public Health Research-IReSP (TGIR Cohortes), the French Inter-departmental Mission for the Fight against Drugs and Drug Addiction (MILDeCA), the French Institute of Cancer (INCa) and the Pfizer Foundation. The TEMPO COVID-19 study was supported by the Co-REPSOND project. COVID online data collection and analyses for the NESDA, NESDO and NOCDA cohorts were partly funded by a ‘fast track grant’ from the Dutch Research Council (grant number 440.20.009) and by the Co-RESPOND project. The infrastructure for the NESDA study was funded through the Geestkracht programme of the Netherlands Organisation for Health Research and Development (grant number 10–000-1002) and financial contributions by participating universities and mental healthcare organizations (VU University Medical Center, Geestelijke Gezondheidszorg [GGZ] inGeest, Leiden University Medical Center, Leiden University, GGZ Rivierduinen, University Medical Center Groningen, University of Groningen, Lentis, GGZ Friesland, GGZ Drenthe, Dimence, Rob Giel Onderzoekscentrum). The infrastructure for the NESDO study was funded through the Fonds NutsOhra (project 0701–065), Stichting tot Steun VCVGZ, NARSAD The Brain and Behaviour Research Fund (grant id 41080), and by participating universities and mental healthcare organizations (VU University Medical Center, Leiden University Medical Center, University Medical Center Groningen, University Medical Center St Radboud, GGZ inGeest, GGNet, GGZ Nijmegen, GGZ Rivierduinen, Lentis and Parnassia). The infrastructure for the NOCDA study was funded by participating universities and mental healthcare organizations (Academic Department VU Medical Center, GGZ inGeest, Innova Research Centre, Mental Health Care Institute GGZ Centraal, Marina de Wolf Anxiety Research Centre, Center for Anxiety Disorders Overwaal, Dimence, GGZ Overijssel, Department of Psychiatry at Leiden University Medical Center, Vincent van Gogh Institute Mental Health Care Centre, Academic Anxiety Center, PsyQ Maastricht University, Division Mental Health and Neuroscience, and Stichting tot Steun VCVGZ). This work was supported by a research grant from Stichting tot Steun VCVGZ (grant number 267). Open access funding provided by Vrije Universiteit Amsterdam. Open access funding provided by Leiden University Medical Center. Open access funding provided by Academic Medical Center. Open access funding provided by University Medical Center Groningen.
Competing interests
The authors declare none.
Ethical standards
The authors assert that all procedures contributing to this work comply with the ethical standards of the relevant national and institutional committees on human experimentation and with the Helsinki Declaration of 1975, as revised in 2013.




 Open access

