Introduction
Side 1
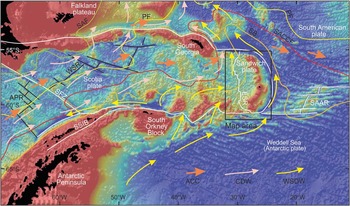
The map covers the area of the South Sandwich subduction system situated in the East Scotia Sea (Fig. 1), in the South Atlantic, between c. 55.1° and 61.9°S, and 24° and 32°W. The main features of the tectonically and magmatically active subduction system covered by the map are the South Sandwich Trench, the South Sandwich volcanic arc, which includes the South Sandwich Islands, and the East Scotia Ridge back-arc spreading centre (Livermore et al. Reference Livermore, Cunningham, Vanneste and Larter1997, Fretzdorff et al. Reference Fretzdorff, Livermore, Devey, Leat and Stoffers2002, Larter et al. Reference Larter, Vanneste, Morris and Smyth2003, Leat et al. Reference Leat, Smellie, Millar and Larter2003). The South Sandwich Islands are the emergent parts of volcanoes forming the volcanic arc of the subduction system. The subduction system is a tectonically active part of the Scotia Sea, a compact ocean gateway region of global significance for interactions between tectonics, oceanographic flow, climate and biodiversity during Cenozoic to Recent times (Dalziel et al. Reference Dalziel, Lawver, Pearce, Barker, Hastie, Barfod, Schenke and Davis2013, Eagles & Jokat Reference Eagles and Jokat2014, Maldonado et al. Reference Maldonado, Dalziel and Leat2015). The South Sandwich Islands are situated to the south of the Antarctic Circumpolar Current, and the bathymetry of the subduction system strongly influences major oceanographic flows (Fig. 1). Circumpolar Deep Water (CDW) is deflected north by the island chain to flow northwards through the East Scotia Sea and through the Georgia Passage bathymetric low between South Georgia and the South Sandwich Islands (Garabato et al. Reference Garabato, Heywood and Stevens2002). The deeper Weddell Sea Deep Water (WSDW) flows north through the East Scotia Sea and north along the South Sandwich Trench (Orsi et al. Reference Orsi, Johnson and Bullister1999, Garabato et al. Reference Garabato, Heywood and Stevens2002). The climate of the islands is polar (Maritime Antarctic) and the islands are remote, infrequently visited and currently uninhabited. The islands are administered as part of the South Georgia and South Sandwich Islands UK Overseas Territory.
Sketch bathymetric map of the South Atlantic showing predicted bathymetry based on satellite gravity and ships’ soundings (shallow sea in red, deep sea in blue). Major tectonic elements after Maldonado et al. (Reference Maldonado, Dalziel and Leat2015). Major oceanographic fronts and flows are after Orsi et al. (Reference Orsi, Johnson and Bullister1999) and Garabato et al. (Reference Garabato, Heywood and Stevens2002). ACC=Antarctic Circumpolar Current, APR=Antarctic-Phoenix Ridge, CDW=Circumpolar Deep Water, ESR=East Scotia Ridge, PF=Polar Front, SAAR=South America-Antarctic Ridge, SACCF=Southern ACC Front, SAF=sub-Antarctic Front, SB=Southern Boundary of the ACC, SFZ=Shackleton Fracture Zone, SSIB=South Shetland Islands Block, WSDW=Weddell Sea Deep Water, WSR=West Scotia Ridge.

The tectonic setting of the arc is relatively simple. The volcanic arc is situated on the South Sandwich plate, or Sandwich plate, and the eastern margin of this plate is formed by the South Sandwich Trench, where the South American oceanic plate is being subducted to the west at a rate of 65–78 mm per year (Smalley et al. Reference Smalley, Dalziel, Bevis, Kendrick, Stamps, King, Taylor, Lauría, Zakrajsek and Parra2007). The age of the subducting ocean crust ranges from c. 27 million years old in the south to c. 80 million years old in the north (Barker Reference Barker1995). Nearly all the sediment arriving at the trench is subducted, and there is a very small accretionary frontal prism (Vanneste & Larter Reference Vanneste and Larter2002). Multi-channel seismic reflection profiles acquired during the 1997 British Antarctic Survey (BAS) Sandwich Lithospheric and Crustal Experiment (SLICE; Larter et al. Reference Larter, King, Leat, Reading, Smellie and Smythe1998) reveal extensional structures at shallow crustal depth in the upper and mid-fore-arc, suggesting that compressional stress associated with underthrusting of the South American plate is restricted to a narrow zone in the lower fore-arc (Vanneste et al. Reference Vanneste, Larter and Smythe2002). Teleseismic earthquake data are consistent with this interpretation, with relatively little seismic activity recorded beneath the arc, and upper fore-arc and most mid-fore-arc activity probably related to thrusting along the plate interface. The potential of the subduction zone for producing giant earthquakes is largely unknown, but such earthquakes represent a tsunami hazard in the South Atlantic (Okal & Hartnady Reference Okal and Hartnady2009). At the north end of the trench, the subducting plate is being torn at depth along an east–west fracture (Forsyth Reference Forsyth1975), causing an earthquake cluster. The south end of the trench is aligned with the South Sandwich Fracture Zone that forms part of the South America–Antarctica plate boundary. The East Scotia Ridge spreading centre forms the western margin of the Sandwich plate.
The active volcanic arc is built largely on oceanic crust that formed at this back-arc spreading centre (Larter et al. Reference Larter, Vanneste, Morris and Smyth2003). Three dredges from around 56.1°S, 26.2°W (Barker Reference Barker1995) at depths of 4100–3100 m on the south-east part of a fore-arc high north-east of Zavodovski Island yielded peridotites interpreted to represent ocean crust of the Sandwich plate modified by metasomatic processes associated with subduction at the South Sandwich Trench (Pearce et al. Reference Pearce, Barker, Edwards, Parkinson and Leat2000). Evidence for faulting and tectonic erosion along the fore-arc (Vanneste & Larter Reference Vanneste and Larter2002) is consistent with tectonic exhumation of the peridotites. Volcanic samples dredged from the east flank of Montagu Bank yielded K-Ar ages of 28–32 Ma, indicating that this part of the fore-arc is much older than the active volcanic arc (Barker Reference Barker1995). Possible structural connections of Montagu Bank with fore-arc high blocks to the south are consistent with the existence of volcanic or continental crust that predates oceanic crust generated at the East Scotia Ridge underlying the southern part of the volcanic arc (Leat et al. Reference Leat, Day, Tate, Martin, Owen and Tappin2013).
The submarine parts of the volcanoes of the volcanic arc have bathymetric features that have been interpreted as evidence for both constructional and erosional processes (Leat et al. Reference Leat, Tate, Tappin, Day and Owen2010, Reference Leat, Day, Tate, Martin, Owen and Tappin2013), including submarine volcanism, landslide events forming mass transport deposits and slumps. Transport of sediment from the shallow shelves around the islands to the deeper flanks was by mass-flows and turbidites, forming large channel systems and sediment wave fields. The volcanic seamounts locally have a rich benthic fauna (Kaiser et al. Reference Kaiser, Barnes, Linse and Brandt2008), and there are chemosynthetic communities associated with submarine hydrothermal vents (e.g. Boschen et al. Reference Boschen, Tyler and Copley2013).
Side 2
Side 2 of the map concentrates on the topography and geology of the islands themselves. Previously the islands were very poorly mapped. The only references to the topography of the islands were a series of UK Antarctic Place-names Committee sheets constructed from sketch surveys and BAS scientific reports from the 1960s and 1970s (Holdgate & Baker Reference Holdgate and Baker1979, unpublished UK Antarctic Place-names Committee sheets Misc 77-79), and UK Admiralty Charts (e.g. Hydrographic Office 2003). No trigonometric survey was ever completed of the islands and the positional accuracy of both the topography and the coastline was inaccurate (Patrick & Smellie Reference Patrick and Smellie2013). Indeed the positional error of the location of the islands has caused problems integrating them into global datasets; several of the islands were mispositioned by up to 3 km. This lack of mapping has led to some of the islands being missed from global datasets, especially those using automated processing based on global topographical compilations. One example of this is the global compilation of the ETOPO2 digital elevation model (http://www.ngdc.noaa.gov/mgg/global/etopo2.html) which misses several of the islands, even though some of them reach heights of >1000 m.
Geologically the South Sandwich Islands are the subaerial parts of a volcanic arc and are entirely composed of volcanic rocks and associated pyroclastic and volcaniclastic deposits (Holdgate & Baker Reference Holdgate and Baker1979, Smellie et al. Reference Smellie, Morris, Leat, Turner and Houghton1998, Leat et al. Reference Leat, Smellie, Millar and Larter2003). The volcanoes are important sources of tephras in East Antarctic ice and marine sediments in the Atlantic sector of the Southern Ocean (Smellie Reference Smellie1999, Narcisi et al. Reference Narcisi, Petit and Delmonte2010). The extent of ice cover on the islands increases with latitude and height, and the large southern islands, Saunders, Montagu, Bristol and Cook and Thule islands of the Southern Thule group, are heavily glacierized. Smaller, more local ice caps occur on the northern islands Zavodovski, Visokoi and Candlemas. The islands are poorly vegetated, the flora being dominated by mosses, lichens and liverworts (Convey et al. Reference Convey, Smith, Hodgson and Peat2000) and host abundant sea bird colonies, notably penguins.
Methods
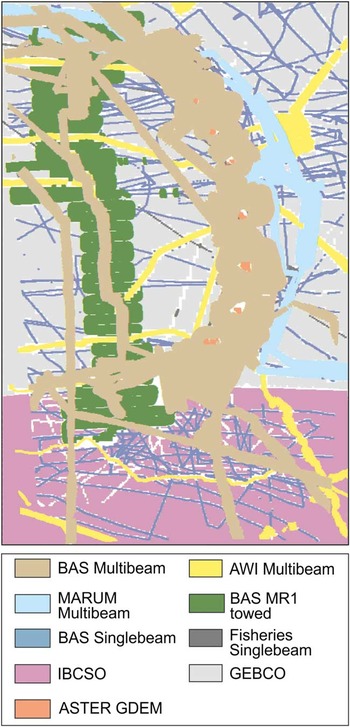
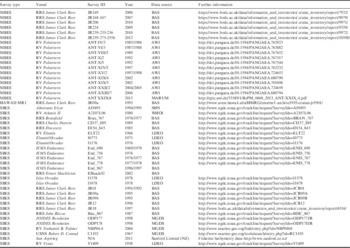
The 1:750 000 bathymetry map (side 1) was compiled from a variety of different data sources (Table I, Fig. 2). The primary data are multibeam swath bathymetry collected from scientific cruises undertaken by BAS, Alfred Wegener Institute (AWI) and Center for Marine and Environmental Sciences (MARUM), University of Bremen. This is supplemented by older data from a BAS towed sonar survey (MR1) and singlebeam data collected by scientific surveys and commercial fishing vessels. Where no data existed from these sources, global compilations from the General Bathymetric Chart of the Oceans (GEBCO) and, below 60°S, the International Bathymetric Chart of the Southern Ocean (IBCSO) were used; both these datasets use satellite altimetry in areas where data are sparse.
Data sources for ship-derived bathymetric data used in the compilation.

Datasets used in the South Sandwich arc bathymetric compilation.

AWI=Alfred Wegner Institute, BAS=British Antarctic Survey, LDEO=Lamont Doherty Earth Observatory, MARUM=Center for Marine Environmental Sciences, University of Bremen, MBES=multibeam echo sounder, MGDS=Marine Geoscience Data System, HAWAII MR1=HIG, Hawaii Institute of Geophysics and Planetology Acoustic Wide Angle Imaging Instrument Mapping Researcher 1, SBES=singlebeam echo sounder, SHN=Servicio de Hidrografia Naval, WHOI=Woods Hole Oceanographic Institution.
The new digital elevation model was gridded in a similar way to previous grids (Fretwell et al. Reference Fretwell, Tate, Deen and Belchier2008, Dickens et al. Reference Dickens, Graham, Smith, Dowdeswell, Larter, Hillenbrand, Trathan, Arndt and Kuhn2014). Gridded datasets were resampled to 200 m resolution and then converted to point data. These points were then given a quality hierarchy, multibeam swath being the highest, then towed data, singlebeam and finally gridded GEBCO and IBCSO data. The data were then re-gridded using the Topogrid algorithm in ArcGIS using the hierarchy to prioritize the data. The resulting grid was then checked for errors such as spikes and holes. Where identified, these were removed from the point datasets and the data were re-gridded. This iterative process was conducted until a clean combined dataset was produced.
On land raw ASTER GDEM grids were cleaned and merged with pre-existing survey data to create new digital elevation models for each island. The bathymetry and elevation dataset was merged and gridded using ArcGIS 10. Oblique views were created using Fledermaus software.
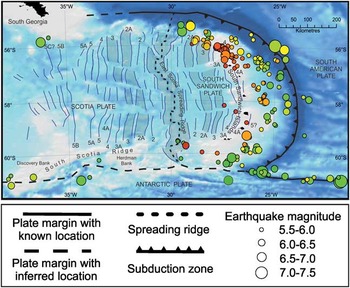
Earthquake data were extracted from the Centennial Catalogue (Engdahl & Villaseñor Reference Engdahl and Villaseñor2002). Filtering parameters, to identify the events with most reliable depths, were: 1964–2008, open azimuth (asol)<180 degrees, solution types DEQ, BEQ and FEQ. These earthquake data were supplemented for the area west of 29°W by data from the EHB Bulletin (http://www.isc.ac.uk/ehbbulletin/). The earthquake data, and their relationship to magnetic data and plate boundaries, are summarized in Fig. 3. On the map, circles denote earthquake epicentres, with the size of the circle referring to the magnitude of the quake, and colour indicating source depth, with red circles denoting deep quakes and green circles denoting shallow quakes. Magnetic lineations were drawn from the previous compilation of Larter et al. (Reference Larter, Vanneste, Morris and Smyth2003). Relative tectonic motions of plates were calculated from GPS-constrained present day plate motions (Smalley et al. Reference Smalley, Dalziel, Bevis, Kendrick, Stamps, King, Taylor, Lauría, Zakrajsek and Parra2007).
Tectonic overview map as shown in the online map. Projection is Albers Equal Area Conic. Bathymetric depths are indicated by shading; darker blue indicates deeper ocean and lighter blue shallower water. Ocean floor magnetic anomalies are after the compilation of Larter et al. (Reference Larter, Vanneste, Morris and Smyth2003). Earthquake epicentres are depicted by circles, with size of circles denoting earthquake magnitude. The colour of circles indicates depth of earthquakes and is an indicative variable colour ramp, in the scale red (deep sources) to yellow-green (shallow sources). The scale is linear and earthquake depths range from 4.4 to 285 km.

Satellite images of the islands (side 2) were acquired from the Digital Globe archive (data sources provided on the map). Multiple images have been merged for some islands where cloud cover obscured parts of images to give a seamless representation of the island topography. Contours were derived from new digital elevation models created specifically for the map and are drawn at 200 m intervals. The digital elevation models were formulated from a combination of cleaned GDEM data and previous air photography surveys (Holdgate & Baker Reference Holdgate and Baker1979). In gaps where data were insufficient these data were supplemented by interpolation from very high resolution (VHR) satellite imagery. Coastlines were digitized from QuickBird2 and WorldView1 satellite images and are considered accurate to within 10 m. Details of the satellite images used are recorded on the map.
Volcanological information on the islands (side 2) was compiled from various sources. Because of the remote location, historical volcanological observations from the islands are rare. The most recent field survey covering all the islands was obtained during the SLICE project in 1997 (Larter et al. Reference Larter, King, Leat, Reading, Smellie and Smythe1998, Smellie et al. Reference Smellie, Morris, Leat, Turner and Houghton1998). The summit features on Visokoi Island were interpreted from the satellite images. Detail for the summit of Mount Michael on Saunders Island is taken from interpretation of recent eruptions from satellite data (Lachlan-Cope et al. Reference Lachlan-Cope, Smellie and Ladkin2001, Patrick & Smellie Reference Patrick and Smellie2013). Detail for the recent eruption of Mount Belinda, Montagu Island (2001–07), is also mainly satellite-based (Patrick et al. Reference Patrick, Smellie, Harris, Wright, Dean, Izbekov, Garbeil and Pilger2005, Patrick & Smellie Reference Patrick and Smellie2013), although the eruption site and the lava flow that reached the north coast at Poncet Point were also observed from ships and RAF aircraft. Current persistent fumarolic activity on the west side of Zavodovski Island, around Mount Lucifer in the northern part of Candlemas Island, and around the main crater of Bellingshausen Island is confirmed by infrequent observations from passing ships. Detail of vents and other volcanic features on Bristol and Thule Island is derived from helicopter observations in 1962, 1964 and 1997 and more recent satellite imagery (Holdgate Reference Holdgate1963, Holdgate & Baker Reference Holdgate and Baker1979, Patrick & Smellie Reference Patrick and Smellie2013). The crater on Mount Michael, Saunders Island, intermittently contains a lava lake, identified from plume characteristics and satellite imagery (Lachlan-Cope et al. Reference Lachlan-Cope, Smellie and Ladkin2001).
Sea floor hydrothermal vents have been observed on the summits of segments E2 and E9 of the back-arc spreading centre (Rogers et al. Reference Rogers, Tyler and Connelly2012). Sea floor venting has also been directly observed within both Kemp and Adventure calderas in the southern part of the South Sandwich arc (Boschen et al. Reference Boschen, Tyler and Copley2013, Leat et al. Reference Leat, Day, Tate, Martin, Owen and Tappin2013). These confirmed submarine vents are shown on the map. Temperature data recorded during submersible dives in Quest caldera, and on Protector Seamount and Scoresby Seamount, all in the Protector Seamounts area, provide a strong indication of active sea floor hydrothermal venting in this northern part of the arc as well (Bohrmann Reference Bohrmann2013). As these northern vents have not been confirmed by direct observation, they are not indicated on the map.
Results
The map is published by the BAS as the sixth sheet of its BAS GEOMAP 2 series (Leat et al. Reference Leat, Fretwell, Tate, Larter, Martin, Smellie, Jokat and Bohrmann2014).
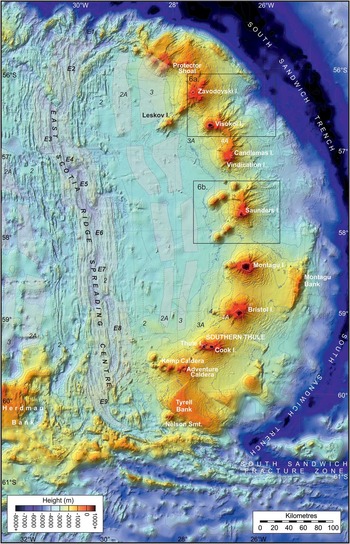
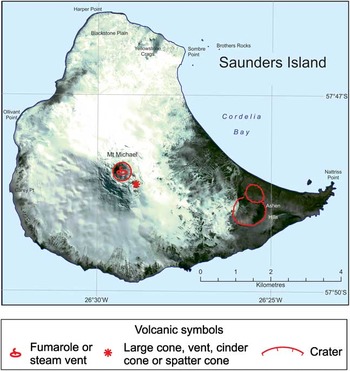
The bathymetric map (side 1) shows accurately for the first time geographical relationships of the various elements of the volcanic arc–back-arc system (Fig. 4). It shows the distribution of volcanic constructs and major sedimentary processes in relation to the volcanic islands and major tectonic features. The satellite images of the islands (side 2) show an accurate representation of the shape, position and topography of the islands and recent volcanic features in relation to improved topographical data and current ice coverage. An example of such images is shown in Fig. 5 which depicts the topography of Saunders Island.
Bathymetric map of the South Sandwich arc after side 1 of the online map. Some detail from the online version has been removed or altered for clarity. The locations of areas shown in Fig. 6a & b are indicated.

Example of a topographical map of an island as displayed on the online map (side 2). The example is of Saunders Island, showing the extensive permanent ice cover on the island, and ice-free areas around the coast, notably Ashen Hills in the south-east which are a group of basaltic hydromagmatic cones. Sites of recent volcanic and fumarolic activity at the summit of Mount Michael are indicated. The scale on the online map is 1:50 000.

Discussion
South Sandwich Trench
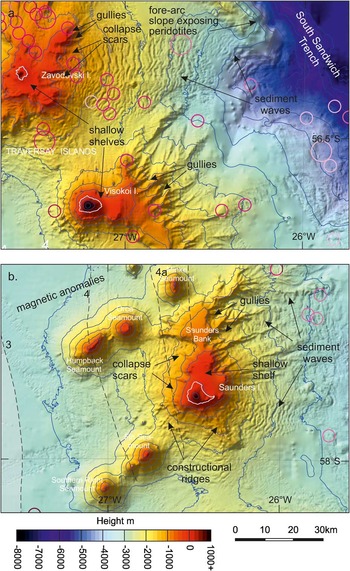
The South Sandwich Trench is continuous from its intersection with the South Sandwich Fracture Zone to the northern part of the Sandwich plate, where it bends to the west at the plate margin along which the South American plate is being down-warped as it subducts (Forsyth Reference Forsyth1975, Leat et al. Reference Leat, Pearce, Barker, Millar, Barry and Larter2004). The trench has not been well-surveyed using multibeam bathymetry. It is >8 km deep in its north-east part (Barker Reference Barker1995), generally shallows to the south and the slope between the volcanic arc and the trench axis steepens to the north. The new bathymetry dataset provides improved resolution of the upper fore-arc structure. One fore-arc high extends from north-west of Protector Shoal to the latitude of Zavodovski Island and is defined in detail for the first time by the bathymetry data (Fig. 6a). This structure trends NW–SE and rises to c. 2500 m b.s.l. in the south and > 1500 m in the north. The peridotites interpreted to sample the mantle of the Sandwich plate (Pearce et al. Reference Pearce, Barker, Edwards, Parkinson and Leat2000) were dredged from the south-eastern part of this fore-arc high (Fig. 6a). Between the latitudes of Zavodovski Island and Montagu Island, fore-arc highs are subdued, and there are several depressions along which sediment may be transported into the trench. The most prominent fore-arc high, Montagu Bank, is shown to be an asymmetrical structure with a steep east-facing slope. The map indicates that Montagu Bank has possible along-strike connections with other fore-arc high blocks to the east of the Southern Thule-Adventure sector of the arc. Where fore-arc highs are subdued, the bathymetry detail suggests the existence of channels associated with sediment waves continuing east from close to the subaerial volcanoes toward the trench axis. An example from east of Zavodovski Island is shown in Fig. 6a, in which a large sediment wave field sourced from the east flanks of the volcanic island can be traced east along the floor of a wide bathymetric low that continues into the South Sandwich Trench around the southern end of the fore-arc high which exposes the peridotites.
Illustrations of sections of the bathymetry map of the South Sandwich Islands volcanic arc (side 1) at slightly reduced scale. a. Volcanic arc and section of fore-arc and western part of the trench including Zavodovski and Visokoi islands, and b. the volcanic arc volcano of Saunders Island and surrounding seamounts. Circles are earthquakes with radii and colours corresponding to magnitude and depth, respectively; full explanation of symbols on online map.

Volcanic arc
Detail of the bathymetry around the seamounts and islands of the volcanic arc has been described previously (Leat et al. Reference Leat, Tate, Tappin, Day and Owen2010, Reference Leat, Day, Tate, Martin, Owen and Tappin2013). The arc is relatively free of complicating factors such as intra-arc rifting, the presence of remnant arcs, or collision with seamount chains, oceanic plateaux or ridges. The volcanic arc consists of eight main volcanic edifices, all having multiphase structure and several having associated seamounts. These main edifices are, from north to south, Zavodovski, Visokoi, the Candlemas group, Saunders, Montagu, Bristol, Southern Thule and the Kemp and Adventure group. Compositionally, the volcanoes are dominated by basalts and basaltic andesites, with minor andesites, dacites and rhyolites. Magma generation was caused by subduction of the South American plate beneath the arc, producing a silica-oversaturated, tholeiitic series (Pearce et al. Reference Pearce, Baker, Harvey and Luff1995, Leat et al. Reference Leat, Smellie, Millar and Larter2003, Reference Leat, Pearce, Barker, Millar, Barry and Larter2004, Barry et al. Reference Barry, Pearce, Leat, Millar and Le Roex2006).
At the northern end of the arc, a group of seamounts cluster around Protector Shoal and geochemically form part of the volcanic arc. At the southern end of the arc, Nelson Seamount is situated 65 km south of Kemp Caldera and south-west of the non-volcanic Tyrell Bank, and represents the southernmost extent of recent volcanism in the South Sandwich arc, although its dacites have geochemical compositions distinct from those of the main volcanic arc (Leat et al. Reference Leat, Pearce, Barker, Millar, Barry and Larter2004).
There are three NE–SW trending rear-arc seamount chains that extend from the south-east of Zavodovski Island and from the north and south of the Saunders edifice some 38–60 km toward the back-arc. There are no obvious correlations of these chains with back-arc structure (Fig. 4).
Submarine parts of the volcanoes of the volcanic arc are characterized by both constructional and mass-wasting processes (Leat et al. Reference Leat, Tate, Tappin, Day and Owen2010, Reference Leat, Day, Tate, Martin, Owen and Tappin2013). Submarine constructional volcanic features consist of seamounts and topographically more subdued flank eruptions as illustrated by the area around Saunders Island (Fig. 6b). Evidence for mass-wasting includes embayments indicating numerous collapse events affecting sectors of volcanoes’ flanks and erosional gullies which probably exploited and enlarged collapse scars. Examples of probable collapse scars and erosional gullies are shown around Zavodovski, Visokoi and Saunders islands in Fig. 6, but they occur on all the main volcanic edifices. Submarine flanks of most of the emergent volcanoes have prominent wave-like surfaces interpreted as sediment wave fields formed by down-slope transport of volcaniclastic sediments as mass-flows and turbidites (Leat et al. Reference Leat, Tate, Tappin, Day and Owen2010). The sediment wave fields are observed to originate dominantly from erosional gullies which cut down through the edge of shallow shelves around the emergent volcanoes as seen east of both Zavodovski and Saunders islands (Fig. 6a & b) indicating that the source of the transported sediments is volcaniclastic material generated from the subaerial volcanoes and their shorelines. Several slump structures have been identified, and some sediment wave fields are thought to have been modified by slumping (Leat et al. Reference Leat, Tate, Tappin, Day and Owen2010, Reference Leat, Day, Tate, Martin, Owen and Tappin2013). On the western flank of the arc, a turbidite apron up to 1 km thick, probably representing the distal part of the volcaniclastic sedimentation, overlies oceanic basement and thins towards the East Scotia Ridge (Vanneste et al. Reference Vanneste, Larter and Smythe2002).
Back-arc spreading centre
The East Scotia Ridge is a back-arc spreading centre along which the Sandwich plate is separating from the Scotia plate (Livermore et al. Reference Livermore, Cunningham, Vanneste and Larter1997). The current full spreading rate is 59–68 mm per year (Smalley et al. Reference Smalley, Dalziel, Bevis, Kendrick, Stamps, King, Taylor, Lauría, Zakrajsek and Parra2007). Marine magnetic anomalies on the western flank of the spreading centre record a history of continuous spreading that extends to at least 15 Ma (magnetic anomaly 5B), and reveal stepped increases in spreading rates since 6 Ma (Larter et al. Reference Larter, Vanneste, Morris and Smyth2003). Magnetic lineations displayed in the map show that the northern part of the volcanic arc is built largely of oceanic crust formed at this spreading centre c. 10 million years ago (Larter et al. Reference Larter, Vanneste, Morris and Smyth2003).
The main spreading centre consists of nine well-defined segments from E1, where the spreading centre meets the trench in the north, to E9 in the south. The bathymetry indicates that there are no stable transform fault offsets between segments, and segment boundaries are thought to be migrating ridge offsets (Livermore et al. Reference Livermore, Cunningham, Vanneste and Larter1997, Larter et al. Reference Larter, Vanneste, Morris and Smyth2003). Central segments E3 to E8 are rift-like, with axial depressions, and segments E2 and E9, near the north and south ends of the spreading centre respectively, have positive axial topography resulting from enhanced mantle melting (Livermore et al. Reference Livermore, Cunningham, Vanneste and Larter1997, Leat et al. Reference Leat, Pearce, Barker, Millar, Barry and Larter2004). Seismic reflection data have been used to infer a 1 km wide magma lens 3 km beneath the sea floor in the central part of segment E2 (Livermore et al. Reference Livermore, Cunningham, Vanneste and Larter1997).
Compositions in most segments are basaltic, but segment E2 has erupted basaltic andesite and rare andesite. The mantle sources of the back-arc magmatism were geochemically varied and related to geometry of mantle flow and distance from the trench (Leat et al. Reference Leat, Pearce, Barker, Millar, Barry and Larter2004). Most of the central segments have erupted compositions close to mid-ocean ridge basalts (MORB). Other identified components are an enriched mantle source thought to be mantle flowing into the back-arc around the slab edges and a component modified by fluids derived from the subducting slab (Fretzdorff et al. Reference Fretzdorff, Livermore, Devey, Leat and Stoffers2002, Leat et al. Reference Leat, Pearce, Barker, Millar, Barry and Larter2004). Segment E2 has a high magma production rate, and had enriched and subduction-modified mantle sources consistent with its position close to the slab edge. Segment E9, also close to the slab edge, had an enriched mantle source. Segments E8 and E4 were significantly modified by slab-derived fluids. Other segments are dominated by MORB compositions.
Conclusions
The map shows both the bathymetry of the South Sandwich subduction system, and the topography and main volcanic features of the islands of the volcanic arc. The bathymetric map includes high-resolution coverage of the submarine part of the volcanic arc and of the back-arc spreading centre. The map provides a resource for future sampling and experiments in this outstanding natural laboratory. Future projects in the South Sandwich Islands region are likely to include investigations of submarine hydrothermal vents and their biology, submarine observations of volcanic and sedimentary process, and sampling to investigate the generation of magmatism in the subduction system. The map also provides a base for assessing future geological, volcanological and glaciological changes.
Acknowledgements
This study is part of the British Antarctic Survey Polar Science for Planet Earth Programme funded by the Natural Environment Research Council. We are grateful to Graham Eagles, an anonymous reviewer and David Walton for comments that helped to improve the paper.
Author contributions
Bathymetric data were collected on several cruises by Leat, Tate, Larter, Martin, Jokat and Bohrmann. Bathymetric data were compiled by Fretwell, Tate and Leat. Satellite images of the islands and contours were prepared by Fretwell. Volcanological interpretations were made by Smellie and Leat. Magnetic and earthquake data were prepared by Larter. The map was prepared by Fretwell and Leat. The text of the paper was written by Leat and Fretwell with contributions from Larter and Smellie.
Supplementary Material
The map and the data files from which it was derived are available online at http://dx.doi.org/10.5285/b8143952-421c-4544-8437-58f339253d30.