Introduction
In adult animals including horses, glucose tolerance and insulin sensitivity are influenced by the nutritional, metabolic and endocrine conditions existing at the time of study.Reference Scheen and Van Cauter 1 – Reference Firshman and Valberg 4 There is also increasing evidence from a range of species that conditions during intrauterine development can affect glucose–insulin dynamics of the adult offspring.Reference McMillen and Robinson 5 – Reference Gonzalez-Bulnes, Astiz and Ovilo 7 Low birth weight (BW), in particular, has been associated with glucose intolerance and insulin insensitivity in adult mice, rats, guinea pigs, pigs and sheep as well as in human populations of different ethnicity.Reference Poore and Fowden 8 – Reference Wang, Tang and Wang 14 Indeed, inducing intrauterine growth restriction experimentally by maternal undernutrition, glucocorticoid administration, placental insufficiency or restriction of uterine blood flow causes abnormalities in glucose metabolism and insulin action in the offspring later in postnatal life.Reference McMillen and Robinson 5 , Reference Ong and Ozanne 6 , Reference Coverdale, Hammer and Walter 15 , Reference Fowden, Jellyman, Valenzuela and Forhead 16 In horses, maternal undernutrition and variations in dietary composition during pregnancy affect insulin secretion and glucose dynamics of newborn and older pre-weaning foals, even when there is no change in BW.Reference George, Staniar, Trieber, Harris and Geor 17 – Reference Peugnet, Robies and Medoza 19 Similarly, dexamethasone treatment of mares during late pregnancy alters arginine-stimulated insulin secretion in their foals 12 weeks after birth relative to controls of the same BW.Reference Valenzuela, Jellyman, Allen, Holdstock and Fowden 20 Collectively, the experimental and epidemiological studies have led to the concept that postnatal metabolic phenotype can be programmed in utero, particularly by environmental conditions suboptimal for normal fetal development.
Recent studies in horses have suggested that there is also a window of susceptibility to metabolic and endocrine programming in the early neonatal period.Reference Coverdale, Hammer and Walter 15 , Reference Fowden, Jellyman, Valenzuela and Forhead 16 In contrast to other precocious species, the horse matures late in gestation and is born with several of its key tissues still not terminally differentiated.Reference Fowden, Jellyman, Valenzuela and Forhead 16 Indeed, glucocorticoid overexposure of the foal in the days immediately after birth alters its subsequent endocrine and metabolic profile.Reference Jellyman, Allen, Holdstock and Fowden 21 , Reference Jellyman, Valenzuela and Allen 22 For instance, there are changes in insulin secretion in response to both glucose and arginine in the foal up to 12–14 weeks after the period of glucocorticoid overexposure.Reference Jellyman, Allen, Holdstock and Fowden 21 In addition, in 2-week-old foals, pancreatic β-cell sensitivity to glucose differs with sex with greater insulin secretion in females than males.Reference Jellyman, Valenzuela, Allen, Holdstock and Fowden 23 However, whether the differences in glucose–insulin dynamics seen with sex and neonatal glucocorticoid exposure in pre-weaning foals persist into later life remains unknown. This study, therefore, examined glucose tolerance, insulin secretion and insulin sensitivity of young adult horses with respect to sex, BW and neonatal glucocorticoid overexposure.
Materials and methods
Animals
In all, 19 ponies were used in this study. They were born spontaneously at full term (approximately 330 days of gestation) and were treated intramuscularly with equine tetanus antitoxin shortly after birth (1000 IU; Tetanus Antitoxin Intervet Ltd, UK). They were housed with their mothers in individual stables for 7 days after birth and then at grazing during the day until they were weaned at 5–6 months. Thereafter, until catheterization, they were kept at grazing during the day and housed in covered yards at night with access to hay and water. Body condition score was maintained at moderate from weaning until the end of the protocol.Reference Carroll and Huntingdon 24 , Reference Hennecke, Potter, Kreider and Yates 25 Colts and fillies occupied separate paddocks and yards from 9 months of age. All animals were wormed and had their hooves trimmed regularly. They were also weighed regularly to calculate fractional growth rates (g/kg BW/week) up to the experiments at 1 and 2 years of age.
Experimental procedures
All procedures were carried out under the Animal (Scientific Procedures) Act 1986 of the U.K. Government after obtaining ethical permission from the University of Cambridge.
Foals
Foals were injected intramuscularly with either long-acting adrenociorticotropic hormone, ACTH1–24, (0.125 mg, n=9, four males and five females, Depot Synacthen; Alliance Pharmaceuticals Ltd, Wiltshire, UK) or saline (0.9% NaCl, n=10, four males and six females) twice daily between 8 am and 9 am and between 4.30 pm and 5 pm for 5 days after birth beginning on the 1st day of postnatal life. Blood samples were taken daily from the jugular vein immediately before the first daily injection from day 1 to day 6 to measure plasma cortisol concentrations. The ACTH dose was designed to increase endogenous cortisol concentrations to the levels seen in premature or ill newborn foalsReference Panzini, Villani and McGladdery 26 , Reference Silver, Ousey and Dudan 27 and resulted in plasma cortisol concentrations that were higher in ACTH than saline-treated foals over the 5 days of treatment (saline, 20.4±1.8 ng/ml, n=10; ACTH, 207.2±49.3 ng/ml, n=9, P=0.01).Reference Jellyman, Allen, Holdstock and Fowden 21 Foals were assigned to either ACTH or saline treatment alternately in the order in which they were born on the basis of their sex to ensure an even sex distribution between the two treatment groups.
Adults
Surgical procedures
At 10–13 months (yearling or 1-year-old group) and again between 23 and 34 months (2-year-old group), the ACTH and saline-treated ponies were fasted overnight before catheterization under general anaesthesia with positive pressure ventilation using strict aseptic procedures as described in detail previously.Reference Taylor, White and Fowden 28 , Reference deVries, Taylor, Troughton, Fowden and Sear 29 At both ages, catheters were inserted into the caudal vena cava and dorsal aorta via the circumflex artery and vein.Reference Taylor, White and Fowden 28 The catheters were filled with heparinized saline (100 IU heparin/ml in 0.9% w/v NaCl), exteriorized via a stab wound in the flank and housed in a bag sutured to the side of the horse. At the end of surgery, a long-stay 16-gauge catheter was placed in a jugular vein (Milacath®; Mila International Inc., Erlanger, KY, USA) and the horse was given antibiotics [1 ml/25 kg i.m., procaine penicillin BP 200 mg and dihydrostreptomycin sulphate BP (vet) 250 mg, Pen & Strep; Norbrook Laboratories Ltd, UK] and an anti-inflammatory (1.1 mg/kg, flunixin meglumine, Finadyne 50 mg; Schering-Plough Ltd, Welwyn Garden City, UK) intramuscularly. Postoperatively, the horses were housed in individual pens in sight of other horses with access to hay and water ad libitum. Catheters were flushed daily with heparinized saline (100 IU heparin/ml in 0.9% w/v NaCl) until the onset of physiological assessments. At the end of the experimental period as yearlings, the catheters were removed under sedation (Xylazine: 1.1 mg/kg i.v. Rompun; Bayer Ltd, UK) and the ponies re-catheterized on the contralateral side at 2 years of age.
Glucose tolerance tests
Insulin secretion was assessed using a glucose tolerance test. At least 5–7 days after surgery following an overnight fast, glucose was infused intravenously over 5 min (0.25 g/kg, 40% dextrose; Arnolds, Harlescott, Shrewsbury, UK) via the venous catheter, and arterial blood samples (5 ml) were collected at −30, −15 and 0 min (immediately before) and 5, 15, 30, 45, 60, 90 and 120 min after glucose administration. The blood samples were placed into tubes containing heparin or ethylenediaminetetraacetic acid (EDTA) and centrifuged immediately at 4°C before storage of the plasma at −20°C until measurement of plasma glucose and insulin concentrations.
Insulin sensitivity tests
Between 7 and 10 days after the glucose tolerance test, insulin sensitivity was assessed using a hyperinsulinaemic–euglycaemic clamp (HEC) following an overnight fast. After collecting basal blood samples (5 ml) from the arterial catheter at 10-min intervals for 40–60 min, insulin was infused continuously via the caudal vena cava catheter at the rate of 5 mU/kg/min (Insuvet® Neural, Schering-Plough Animal Health, Welwyn Garden City, UK in Year 1 or Actrapid Actrapid® HM, insulin human biosynthetic 100 IU/ml; Novo Nordisk Pharma, Denmark in Year 2) using a peristaltic pump. After insulin infusion for 10 min, glucose (40% dextrose) was infused at a variable rate using a precision infusion pump to maintain glucose levels at basal values. Once steady state was established after about 2–5 h of insulin and glucose infusion, a second series of arterial blood samples (5 ml) were collected at 10-min intervals for 40 min for the measurement of the concentrations of blood glucose and plasma insulin. After the clamped period, the insulin and glucose infusion was stopped and the horses were fed with 500 g concentrates (Horse Stud Mix; Moulton’s Feed Supplies, Lincolnshire, UK) plus hay ad libitum.
At the end of the experimental studies as 2-year olds, the catheters were removed under sedation as at 1 year and the animals were either rehomed (n=10) after discharge from the Animal (Scientific Procedures) Act 1986 or euthanized (n=9) by intravenous administration of a lethal dose of anaesthetic (pentobarbitone sodium, 200 mg/kg, Pentoject; Animal Care Ltd, Common Road, Dunnington, York, UK). For the present study, samples of liver and skeletal muscles (biceps, soleus, gastrocnemius and semitendinosus) were collected into liquid nitrogen and stored at −80°C until required for analyses. These and other tissues were also collected for teaching and other research studies.
Biochemical analyses
Metabolite and hormone concentrations
Blood and plasma glucose concentrations were measured using an automated analyzer (Yellow Springs 2300 Stat Plus Glucose/Lactate Analyzer; YSI Ltd, Farnborough, UK). Plasma insulin concentrations during the glucose tolerance test and the basal samples from the HEC were measured using a commercially available, equine-specific enzyme-linked immunosorbent assay (ELISA) kit (Mercodia AB, Uppsala, Sweden), validated for use with equine plasma.Reference Borer-Weir, Bailey, Menzies-Gow, Harris and Elliot 30 , Reference Tinworth, Wynn and Boston 31 The mean intra-assay coefficient of variation was 3.4%, whereas the inter-assay coefficient of variation was 13%. The minimum detectable level of equine insulin was 0.01 µg/l. Insulin concentrations during the clamp period were measured after dilution using commercially available human and bovine ELISA kits as appropriate. The clamped insulin concentrations were measured in a single assay at each age. For the human and bovine insulin assays, the minimum detectable level of insulin were 0.04 and 0.02 µg/l, whereas the intra-assay coefficient of variation were 3.4 and 3.8%, respectively.
Tissue insulin receptor (InsR) abundance
Protein was extracted from liver and four skeletal muscles and the protein concentration in the supernatant was determined using a bicinchoninic acid assay (BCA kit; Pierce, Rockford, IL, USA). Western blotting was performed as described previouslyReference Ozanne, Nave and Wang 32 using a primary antibody to the InsR [subunit β, Insulin Rβ (C-19): 1:200, sc-711; Santa Cruz Biotechnology Inc., Delaware Avenue, Santa Cruz, CA, USA] and to β-actin (1:10,000, sc-47778; Santa Cruz Biotechnology Inc.) to evaluate protein loading. Horseradish peroxidase-conjugated secondary antibodies to the host species were used as appropriate (1:5000–1:10,000, ECLTM Anti-rabbit IgG and ECLTM Anti-mouse IgG; GE Healthcare Life Sciences, Little Chalfont, Bucks, UK). Protein abundance was detected using enhanced chemiluminescence reaction (ECL plus kit; Amersham Hiperfilm Bioscience, UK) and X-ray film (Fuji FPM100A processor) and analysed using the ImageJ program (ImageJ, Software; National Institute of Health, Bethesda, MD, USA; http://rsb.info.nih.gov/ij). The depicted bands had the expected molecular weights.
Calculations
Glucose tolerance test
Relative insulin secretion (RIS) was calculated as area under the insulin curve (AUCI) divided by area under the glucose curve (AUCG):
 $${\rm RIS{\,\equals\,}}{{{\rm AUCI}\,\left( {{\rm ng/l/min}} \right)} \over {{\rm AUCG}\,\left( {{\rm mmol/l/min}} \right)}}$$
HEC
As the glucose concentration is not maintained perfectly constant during the clamp, a space correction (SC) is made to account for the glucose that has been added or removed from the glucose space other than by metabolism.Reference Pratt, Geor and McCutcheon 33 No correction was made for urinary losses of glucose, irrespective of whether the animals urinated or not during the course of the experiments.
The SC (µmol/kg/min) was calculated using the following equation:Reference Pratt, Geor and McCutcheon 33
 $${\rm SC{\,\equals\,}}{{\left( {G_{{\rm 2}} {\minus}G_{{\rm 1}} } \right){\times}\left( {{\rm 0}{\rm .19}{\times}{\rm bwt}} \right)} \mathord{\left/ {\vphantom {{\left( {G_{{\rm 2}} {\minus}G_{{\rm 1}} } \right){\times}\left( {{\rm 0}{\rm .19}{\times}{\rm btw}} \right)} {\left( {T{\times}{\rm bwt}} \right)}}} \right. \kern-\nulldelimiterspace} {\left( {T{\times}{\rm bwt}} \right)}}$$
where G 2 and G 1 are glucose concentrations at the beginning and end of each interval of sampling, T the time interval (10 min), btw the body weight in kilograms and the term (0.19×bwt) the glucose space expressed in litres. The net steady-state glucose infusion rate (net steady-state GIR) (µmol/kg/min) was calculated using the following equation:
 $${\rm Net}\,{\rm steady\hbox-state}\,{\rm GIR{\,\equals\,}}\left( {{\rm GIR}{\minus}{\rm SC}} \right)$$
where GIR is the glucose infusion rate (µmol/kg/min) averaged over the clamp period and SC the space correction. Insulin sensitivity (IS, µmol/min/kg/µg/l) was calculated as the net steady-state glucose infusion rate divided by the steady-state plasma insulin concentration during the clamp period:Reference Gatford, De Blasio and Thavaneswaran 34
 $${\rm IS{\,\equals\,}}{{{\rm Net}\,{\rm steady\hbox-state}\,{\rm glucose}\,{\rm infusion}\,{\rm rate}\,\left( {{\rm \rmu mol/kg/min}} \right)} \over {{\rm Steady\hbox-state}\,{\rm plasma}\,{\rm insulin}\,{\rm concentration}\,({\rm \rmu g/l)}}}$$
The steady-state plasma insulin concentration was calculated as the average of insulin concentrations during the clamp period.
Statistical analyses
All results are expressed as mean±s.e.m. Plasma glucose and insulin concentrations during each experimental period were analysed using two-way ANOVA with repeated measures plus Tukey’s post-hoc test, as appropriate. The AUCG and AUCI were calculated as the integrated plasma concentration after administration of glucose from 0 to 120 min above the baseline concentration at 0 min for all positive values. Statistical comparisons between groups were made using two-way ANOVA (treatment and time or treatment and sex) followed by Tukey’s post-hoc test. Data were normalized by log transformation where required. The data for growth rate and from the HEC experiments at each age were analysed using two-way ANOVA using treatment and sex of the ponies as factors. Linear regression analyses were used to assess the relationships between BW, growth rate and AUCG and insulin sensitivity. Statistical analyses were performed using Sigma-Stat (Statistical Software version 2.0; San Jose, CA, USA). For all statistical tests significance was accepted at P<0.05.
Results
Biometry
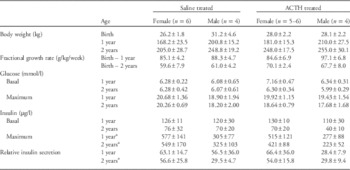
BW did not differ between female and male foals (P>0.05, Table 1). There was also no difference in the body weight of the fillies and colts at 1 and 2 years of age (P>0.05, Table 1). Neonatal treatment had no effect on body weight at either age (P>0.05, Table 1). In addition, there were no significant differences in the fractional growth rate with sex or neonatal treatment during the period of study (P>0.05, Table 1).
Mean±s.e.m. values of body weight and fractional growth rate with respect to postnatal age together with basal and maximal concentrations of plasma glucose and insulin and the relative insulin secretion during the glucose tolerance test at 1 and 2 years of age in female and male horses that were treated neonatally with either saline or ACTH

a Significant effect of sex as indicated (P<0.04, two-way ANOVA). There was no significant effect of treatment or any interaction between sex and treatment for any of these measurements (P>0.05, all cases, two-way ANOVA).
Glucose tolerance
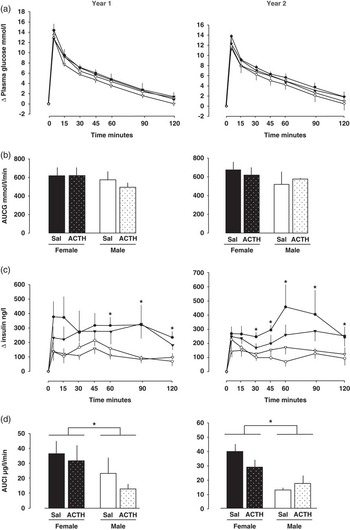
At 1 and 2 years of age, there were no differences in the basal fasting concentrations of plasma glucose and insulin with neonatal treatment or sex of the animals (P>0.05, Table 1). At both ages, the increment in plasma glucose with respect to time and the maximal increment in plasma glucose were similar in males and females and did not differ with neonatal treatment (P>0.05, Table 1, Fig. 1a). Similarly, the AUCG was unaffected by either sex or neonatal treatment of the animals, irrespective of their age (Fig. 1b). The increment in plasma insulin with respect to time was also unaffected by neonatal treatment (P>0.05, Fig. 1c). However, the increment in plasma insulin from basal values was greater in females than males from 60 to 120 min after glucose administration in the yearlings and from 30 to120 min in the 2-year olds (P<0.02, Fig. 1c). Similarly, the maximum concentration of plasma insulin achieved during the 120-min period after glucose administration was significantly higher in females than males at both ages (P<0.04, Table 1). Consequently, the AUCI was significantly greater in females than males at both ages studied (P<0.02, Fig. 1d). The RIS was significantly greater in females than males at 2 years but not 1 year of age (P<0.04, Table 1) and was unaffected by neonatal treatment at both ages (P>0.05, Table 1). When the two sexes were analysed separately, there were no changes in the increments of glucose and insulin, the AUCG and AUCI or in RIS between 1 and 2 years of age in either sex (P>0.05, two-way ANOVA, all cases).
Mean±s.e.m. values of the increment in plasma glucose (a), area under the glucose curve (AUCG) (b), the increment in plasma insulin (c) and the area under the insulin curve (AUCI) (d) in response to administration of glucose (0.25 g/kg) in female (dark symbols and columns) and male horses (white symbols and columns) at 1 and 2 years of age after neonatal treatment with either ACTH (stippled columns, triangular symbols) or saline (Sal, filled columns, circular symbols). *Significant effect of sex (two-way ANOVA, P<0.02). At 1 year: saline, females n=6, males n=4; ACTH, females n=5, males n=4. At 2 years: saline, females n=5, males n=4; ACTH, females n=5, males n=4.

Insulin sensitivity
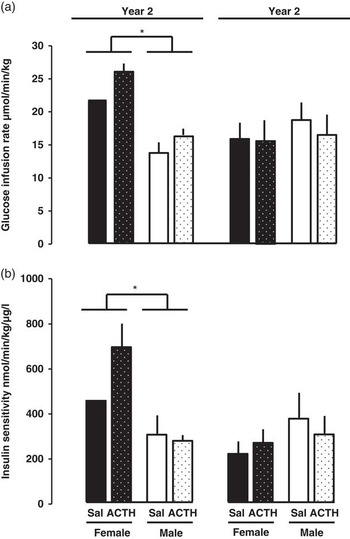
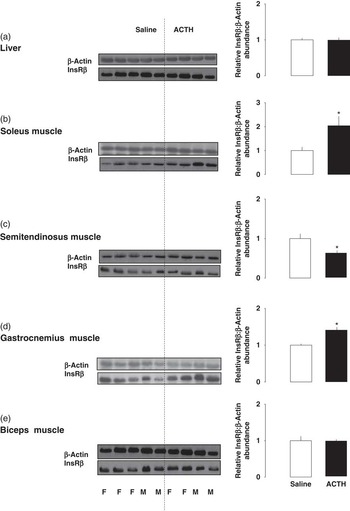
Basal blood glucose concentrations did not vary with sex or neonatal treatment at either age (P>0.05, all cases; mean values: 1 year, 4.49±0.17 mmol/l, n=13; 2 years, 4.70±0.19 mmol/l, n=17) and were clamped at these basal euglycaemic levels by 2–5 h after beginning the insulin infusion. At this time, insulin concentrations were supra-physiological and did not vary with neonatal treatment or sex of the animal at either 1 or 2 years of age (P>0.05, all cases: mean clamped values; 1 year, 52.5±5.1 µg/l, n=13; 2 years, 59.6±5.6 µg/l, n=17). At both ages, the effectiveness of insulin in stimulating tissue glucose uptake was unaffected by neonatal treatment, whether measured as GIR or insulin sensitivity (P>0.05, Fig. 2). Females had a greater GIR and insulin sensitivity than males as yearlings but not as 2-year olds (Fig. 2). When the data from the two treatment groups were combined and analysed by two-way ANOVA with respect to age and sex of the animals, there was an interaction between these two factors in determining insulin sensitivity with a decline in insulin sensitivity with increasing age in females (P<0.001, n=9) but not in males (P>0.05, n=8). InsR abundance in the liver and selected skeletal muscles was unaffected by sex in a subset of the animals at 2 years of age (P>0.05, two-way ANOVA, all cases, Fig. 3). However, skeletal muscle InsR abundance was influenced by neonatal treatment in a muscle-specific manner with increased abundance in the soleus and gastrocnemius muscles and decreased abundance in the semitendinosus muscle of animals treated neonatally with ACTH compared with those receiving saline (Fig. 3b–3d). There was no apparent effect of neonatal treatment on InsR abundance in the liver or biceps muscle (Fig. 3a and 3e).
Mean±s.e.m. values of (a) the glucose infusion rate (GIR)and (b) insulin sensitivity during a hyperinsulinaemic–euglycaemic clamp in female (dark columns) and male horses (white columns) at 1 and 2 years of age after neonatal treatment with either ACTH (stippled columns) or saline (filled columns). *Significant effect of sex (two-way ANOVA, P<0.01). At 1 year: saline, females n=2, males n=3; ACTH, females n=4, males n=4. At 2 years: saline, females n=4, males n=4; ACTH, females n=5, males n=4.

Relative abundance of the insulin receptor (InsR) to β-actin in individual female (F) and male (M) 2-year-old horses after neonatal treatment with ACTH or saline and the mean value for the ACTH-treated group (black columns) expressed relative to the mean for the saline controls (white columns) for (a) liver, (b) soleus muscle, (c) semitendinosus muscle, (d) gastrocnemius muscle and (e) biceps muscle. *Significantly different from value in saline-treated group (P<0.03, two-way ANOVA).

Relationship with BW and postnatal growth rates
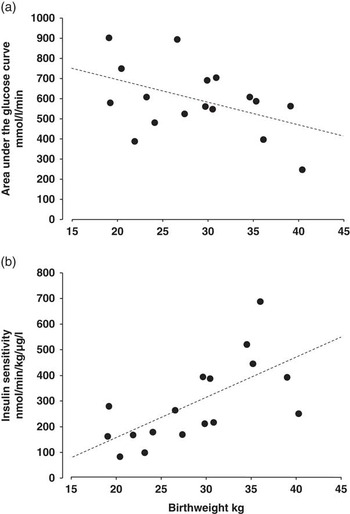
When all data were combined, irrespective of sex or treatment at each of the two ages, there was no relationship between BW and either AUCG or insulin sensitivity in the yearlings (P>0.05, both cases). In contrast, at 2 years of age, AUCG was inversely related to the BW (Fig. 4a, AUCG=982−13.0BW, n=18, r=−0.487, P=0.04), whereas, conversely, insulin sensitivity was positively correlated to BW of the foals (Fig. 4b, insulin sensitivity=−159+15.6BW, n=17, r=0.658, P=0.04). There were no relationships between the fractional growth rate until the age at study (g/kg/day) and either AUCG or insulin sensitivity at 1 and 2 years of age (P>0.05, all cases). Nor was there any relationship between BW and AUCI at 1 and 2 years of age when the data from the two sexes were analysed separately (P>0.05, all cases).
Relationship between birth weight (BW) and (a) the area under the glucose curve (AUCG) in response to glucose administration (0.25 g/kg, AUCG=982−13.0BW, n=18, r=−0.487, P=0.04) and (b) insulin sensitivity (IS) measured using the hyperinsulinaemic–euglycaemic clamp in horses at 2 years of age (IS=−159+15.6BW, n=17, r=0.658, P=0.0039).

Discussion
The results demonstrate that sex, BW and neonatal glucocorticoid overexposure have significant influences on the glucose–insulin dynamics of young adult horses. Insulin secretion in response to glucose was sex linked at both ages studied as was insulin sensitivity in the yearlings. BW was related to the action of insulin in the 2-year olds, irrespective of whether insulin effectiveness was measured as AUCG in the glucose tolerance test or more directly as insulin sensitivity using the HEC technique. In contrast, neonatal glucocorticoid overexposure appeared to have little effect on glucose tolerance, insulin secretion or insulin sensitivity of the horses at either age studied, although it did affect InsR abundance of specific skeletal muscles at 2 years in a manner independent of the sex of the animal. The current findings together with previous studiesReference Jellyman, Allen, Holdstock and Fowden 21 – Reference Jellyman, Valenzuela, Allen, Holdstock and Fowden 23 suggest that sex of the animal and environmental factors during fetal and early neonatal life are likely to be important in determining postnatal metabolic and endocrine phenotype in horses as occurs in other species.Reference McMillen and Robinson 5 , Reference Ong and Ozanne 6 , Reference Coverdale, Hammer and Walter 15 , Reference Fowden, Jellyman, Valenzuela and Forhead 16
Insulin secretion in response to glucose administration was greater in females than males at both 1 and 2 years of age, consistent with findings in newborn foals at 2 weeks of age.Reference Jellyman, Valenzuela, Allen, Holdstock and Fowden 23 Sex-linked differences in glucose-stimulated insulin release have also been reported in rats, guinea pigs and sheep postnatally, particularly when there is a suboptimal environment during their intrauterine development.Reference Kind, Clifton and Grant 10 , Reference Chamson-Reig, Thyssen, Hill and Arany 35 – Reference McKnight, Myrie, Mackay, Brunton and Bertolo 40 However, in these earlier studies, it was generally the males rather than the females that had a greater insulin response to exogenous glucose administration. In part, this was due to sex-linked changes in pancreatic β-cell mass and/or alterations in the intracellular pathways of insulin secretion.Reference Reaven, Curry and Reaven 41 – Reference Ruhe, Curry, Herrmann and McDonald 43 The mechanisms responsible for the differences in glucose-stimulated insulin secretion between the sexes in horses in the present study are unknown.
Despite the difference in insulin secretion between the male and female horses, glucose dynamics and AUCG were unaffected by the sex of the ponies at both ages studied. This suggests that insulin sensitivity was greater in males than females. However, direct measurement of insulin sensitivity using HECs showed that females were the more insulin-sensitive sex as yearlings with no difference between the sexes at 2 years of age. Sex-linked differences in adult insulin sensitivity have been observed previously in rats, guinea pigs, sheep and humans and are often related to differences in adiposity.Reference Kind, Clifton and Grant 10 , Reference Lui, Schulz and De Blasio 11 , Reference Hilawe, Yatsuya, Kawaguchi and Aoyama 37 , Reference Owens, Thavaneswaran and De Blasio 39 , Reference Liu, Schultz and De Blasio 44 , Reference Yki-Järvinen 45 Body condition score was maintained at moderate in all animals in the present study so changes in adiposity are unlikely to account for the sex-linked differences in insulin sensitivity seen in the yearlings. In a subset of the current 2-year-old horses, there were also no apparent sex-linked differences in InsR abundance in the liver or skeletal muscles, the main sites of insulin action. Consequently, the paradoxical findings of no sex-linked difference in AUCG but increased insulin secretion and sensitivity in the female yearlings relative to the males indicate that any increased insulin-stimulated glucose uptake during the glucose tolerance test is probably balanced by an equal and opposite decrease in insulin-independent glucose disposal in the females. Conversely, in the older animals, there were no differences in insulin sensitivity or glucose tolerance between the sexes, despite the smaller insulin response to glucose administration in the males, which suggests insulin-dependent glucose uptake may be less, whereas insulin-independent glucose disposal may be greater in males than females during glucose administration at 2 years of age. There may, therefore, be sexual dimorphism in the tissue expression and relative abundance of the various glucose transporters (GLUTs) in equine tissues, which differ with age. Certainly, in other species, there are sex-linked differences in tissue abundance of both the insulin-sensitive GLUT isoform, GLUT4, and the insulin-insensitive isoforms, GLUT1 and GLUT2, in the adult animal, particularly when it has experienced adverse conditions during intrauterine development.Reference Nagai, Yoshida and Konishi 46 – Reference Zheng, Rollet and Pan 49
In the present study, the weight-specific rates of glucose infusion during the clamp were within the range of values reported previously for adult horses of several different breeds including ponies.Reference Pratt, Geor and McCutcheon 33 , Reference Rijnen and van der Kolk 50 – Reference Murphy, Reid and Love 54 Collectively, these studies suggest that insulin sensitivity may vary between breeds with a trend towards greater insulin resistance in ponies than more athletic breeds of horse. They also indicate that insulin sensitivity may decline with age as GIR values tended to be lower in horses older than 12 years than in younger animals of the same breed.Reference George, Staniar, Trieber, Harris and Geor 17 , Reference Powell, Reddy, Sessions and Fitzgerald 52 , Reference Murphy, Reid and Love 54 Certainly, in the present study, insulin sensitivity decreased between 1 and 2 years of age in females, although not in males. As insulin sensitivity is affected by puberty in other species,Reference Kelsey and Zeitler 55 this may reflect, in part, the tendency for an earlier onset of puberty in fillies than colts.Reference Guillaume, Salazar-Ortiz and Martin-Rosset 56
The current finding that BW was inversely correlated to AUCG and positively related to insulin sensitivity in the 2-year-old horses is consistent with previous studies of natural and experimentally induced variations in BW in other species.Reference McMillen and Robinson 5 , Reference Ong and Ozanne 6 , Reference Coverdale, Hammer and Walter 15 , Reference Fowden, Jellyman, Valenzuela and Forhead 16 Adult insulin sensitivity is known to be less in smaller than larger littermates in pigs and guinea pigs.Reference Kind, Clifton and Grant 10 , Reference Poore and Fowden 57 , Reference Horton, Saint, Owens, Kind and Gatford 58 Similarly, in Standardbred horses, insulin sensitivity is less in pre-weaning foals that were growth restricted than in those growth enhanced by embryo transfer into smaller and larger breeds of mares, respectively.Reference Peugnet, Wimel and Duchamp 59 In addition, resistance to the effects of insulin is greater in adult rats of low BW, irrespective of whether intrauterine growth restriction was induced by uterine artery ligation, maternal glucocorticoid administration, or restriction of dietary protein or calories intake.Reference Jansson and Lambert 13 , Reference Ozanne, Nave and Wang 32 , Reference Chamson-Reig, Thyssen, Hill and Arany 35 , Reference Nyirenda, Lindsay, Kenyon, Burchell and Seckl 60 However, as insulin is an important regulator of fetal growth in species with relatively long gestational periods like the sheep and horse,Reference Fowden, Jellyman, Valenzuela and Forhead 16 the relationship between adult insulin sensitivity and BW across the normal range may not be due to intrauterine programming but rather reflect an inherent, genetically determined insulin sensitivity tracking from fetal to early adult life. The absence of this relationship in the yearlings may again be the consequence of the changes in insulin sensitivity associated with puberty.Reference Kelsey and Zeitler 55 , Reference Guillaume, Salazar-Ortiz and Martin-Rosset 56
In the present study, neonatal glucocorticoid overexposure induced by ACTH treatment had little effect on insulin secretion or whole body insulin sensitivity of the young adult horses. In contrast, this treatment reduced peak insulin concentrations in response to glucose administration in 2- and 12-week-old foals and altered functioning of the hypothalamic–pituitary–adrenal (HPA) axis in both the males and females as yearlings and 2-year olds.Reference Jellyman, Allen, Holdstock and Fowden 21 , Reference Jellyman, Valenzuela and Allen 22 At 2 years of age, neonatal glucocorticoid overexposure affected InsR expression in skeletal muscles differentially with increases, decreases and unaltered abundance depending on the specific muscle studied, which may reflect, in part, the differing fibre composition of the muscles. Although these changes in InsR abundance might alter insulin sensitivity of the individual muscles, they appeared to have no net effect on insulin-dependent glucose utilization by the animal as a whole.
In summary, insulin–glucose dynamics in the young adult horse varied with BW and sex in line with previous findings in newborn and older pre-weaning foals. This suggests that these metabolic characteristics are determined early in life and track into adulthood. However, whether this reflects the genotype of the individual or intrauterine programming of its metabolic phenotype remains unclear. In comparison, neonatal glucocorticoid overexposure appeared to have little effect on glucose–insulin dynamics of the young adult horse as a whole, although insulin sensitivity of its individual skeletal muscles may have been altered by the ACTH treatment. Taken together, the present and previous findings indicate that glucose metabolism of the young adult horse may be less sensitive to glucocorticoid programming during early neonatal life than functioning of its HPA axis.Reference Jellyman, Valenzuela and Allen 22 In other species, abnormalities in glucose metabolism and insulin sensitivity programmed in utero become more evident with increasing postnatal age and adiposityReference Ong and Ozanne 6 , Reference Jellyman, Valenzuela and Fowden 61 , but whether this occurs in horses overexposed to glucocorticoids neonatally remains to be determined. Further studies are also required to identify the cellular and molecular basis of the differences in insulin–glucose dynamics linked to the sex and BW of the young adult horses.
Acknowledgements
The authors thank the staff of the University Biofacilities Service for their care of the animals.
Financial Support
The authors are grateful to the Horserace Betting Levy Board for their financial support.
Conflicts of Interest
None.
Ethical Standards
All experiments were carried under the Animal (Scientific Procedures) Act 1986 of the UK government after approval by the Animal Welfare and Ethical Review Body of the University of Cambridge.