Implications
This method has the potential to allow the study of global gene expression profiles in tissues/cells from species for which (i) there is no specific microarray available; (ii) the genome has not been sequenced; or (iii) the annotation is poor or at a very early stage. It utilises the genomic resources available for humans (or rodents) to allow researchers to study other species, without the need to sequence and annotate the whole genome for that species.
Introduction
A range of microarray platforms have been developed to investigate global gene expression profiles (Bar-Or et al., Reference Bar-Or, Czosnek and Koltai2007), including spotted arrays (using cDNAs, PCR products or oligonucleotides) and in situ synthesised arrays (e.g. Agilent SurePrint (Agilent Technologies, Stockport, Cheshire, UK) and Affymetrix (Santa Clara, CA, USA) GeneChip arrays). A few sheep microarray studies have been performed using in-house sheep-specific targeted arrays (Keane et al., Reference Keane, Zadissa, Wilson, Hyndman, Grere, Baird, McCulloch, Crawford and McEwan2006; Galindo et al., Reference Galindo, Munoz, de Miguel, Marin, Blasco, Gortazar, Kocan and de la Fuente2008; Watkins et al., Reference Watkins, McKellar, Jensen, George, Jones, Sharp, Stevenson and Hopkins2008) or the Affymetrix Bovine array (Fleming-Waddell et al., Reference Fleming-Waddell, Wilson, Olbricht, Vuocolo, Byrne, Craig, Tellam, Cockett and Bidwell2007; Vuocolo et al., Reference Vuocolo, Byrne, White, McWilliam, Reverter, Cockett and Tellam2007; Rowe et al., Reference Rowe, Gondro, Emery and Sangster2008), with the latter assuming high homology between these species. Although a sheep-specific microarray is commercially available (Agilent), we chose to use the human Affymetrix GeneChip for sheep studies because it has (i) probes for more transcripts than the ovine and bovine arrays (45 K compared to 15 and 23 K, respectively); (ii) better coverage of the genome, including novel genes of unknown function; and (iii) more extensive gene annotation than the ovine or bovine arrays. In addition, this approach could potentially be used for other species where a specific array is unavailable. The design of Affymetrix GeneChips makes them ideal for use in cross-species experiments (Bar-Or et al., Reference Bar-Or, Czosnek and Koltai2007). On each GeneChip, a gene transcript is represented by a probe-set consisting of up to 16 probe-pairs, each made up of a 25 base oligo perfect-match (PM) probe and the corresponding mis-match (MM) probe, with an MM at the 13th base, thereby measuring non-specific binding (Lipschutz et al., Reference Lipschutz, Fodor, Gingeras and Lockhart1999). In plants, a mixed molecular and bioinformatic approach based on probe selection via genomic DNA (gDNA) hybridisation demonstrated that the Arabidopsis ATH1 array could be used to study other plant species (Hammond et al., Reference Hammond, Broadley, Craigon, Higgins, Emmerson, Townsend, White and May2005 and Reference Hammond, Bowen, White, Mills, Pyke, Baker, Whiting, May and Broadley2006; Broadley et al., Reference Broadley, White, Hammond, Graham, Bowen, Emmerson, Fray, Iannetta, McNicol and May2008; Morinaga et al., Reference Morinaga, Nagano, Miyazaki, Kubo, Demura, Fukuda, Sakai and Hasebe2008). The aim of this study was to test the use of the human Affymetrix GeneChip array to study ovine transcriptomes by comparing gene expression profiles in sheep liver and muscle using the probe selection method.
Material and methods
All animal procedures were approved by the University of Nottingham Ethics Committee and carried out in accordance with UK Home Office Guidelines.
gDNA hybridisation and probe selection
gDNA was extracted from whole sheep blood as per manufacturer's instructions using the Wizard Genomic DNA Purification kit (Promega, Southampton, UK), before being labelled, hybridised to the Affymetrix Human U133+2 array, scanned and gDNA cell intensity files (.cel files) generated, all as described previously (Hammond et al., Reference Hammond, Broadley, Craigon, Higgins, Emmerson, Townsend, White and May2005). The next step was to identify probe-pairs in which the PM probe has a gDNA hybridisation intensity greater than the user defined threshold (Hammond et al., Reference Hammond, Broadley, Craigon, Higgins, Emmerson, Townsend, White and May2005). Probe-pairs from the gDNA .cel files were selected using a .cel file parser script (http://affymetrix.arabidopsis.info/xspecies/), which produces a probe mask file (.cdf) compatible with a range of microarray analysis packages (e.g. Genespring). Probe mask files (.cdf) were produced using gDNA hybridisation intensity thresholds ranging from 0 to 1000.
Sheep tissue samples and RNA isolation
Samples of liver and Longissimus dorsi skeletal muscle were obtained from three male Mule × Charolais lambs (approximate age 120 days) within 5 min of death, quickly frozen in liquid nitrogen and stored at −80°C. Total RNA was isolated from all samples using Trizol as per the manufacturer's instructions including glycogen removal (Invitrogen, Paisley, UK), followed by an additional DNase treatment step (Promega). The isolated total RNA was resuspended in RNase-free water with yield and purity determined using an Agilent 2100 Bioanalyser (Agilent Technologies, Stockport, UK).
RNA hybridisation
Detailed methods were as described previously (Hammond et al., Reference Hammond, Broadley, Craigon, Higgins, Emmerson, Townsend, White and May2005). Briefly, approximately 1 μg of total RNA was used to generate first strand cDNA by reverse transcription followed by synthesis of second strand cDNA. Double stranded cDNA products were purified and in vitro transcribed to generate biotinylated complementary RNAs (cRNAs), then purified and randomly fragmented before being hybridised on Affymetrix Human U133+2 GeneChip arrays and stained with streptavidin–phycoerythrin. Arrays were scanned and .cel raw data files generated. The DNA and RNA .cel files and the probe mask .cdf files are available to download from the NASC Xspecies website (http://affymetrix.arabidopsis.info/xspecies/).
Data analysis
Initially the RNA .cel files were loaded into Genespring GX 7.3 (Agilent technologies) using RMA normalisation algorithm (Irizarry et al., Reference Irizarry, Hobbs, Collin, Beazer-Barclay, Antonellis, Scherf and Speed2003). The RNA files were reanalysed using the .cdf files generated from the gDNA hybridisation. Genes were selected as differentially expressed if they were more than twofold different and had a P-value <0.05 from an ANOVA test (using no false discovery rate correction). Gene Ontology (GO) analysis was performed using GO browser function in Genespring, which calculates a hypergeometric P-value.
Results
Probe selection using gDNA hybridisation
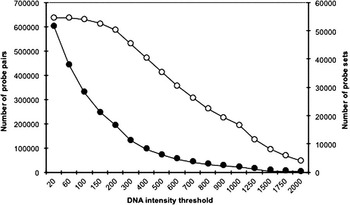
For probe selection to allow the use of the Human GeneChip array to study global gene expression in sheep tissues, sheep gDNA was hybridised to the Human U133 +2 array. After hybridisation, a probe-pair was retained if its PM hybridisation value exceeded a series of thresholds (ranging from 0 to 1000) using a .cel file parser (Hammond et al., Reference Hammond, Broadley, Craigon, Higgins, Emmerson, Townsend, White and May2005). The number of probe-pairs retained in the resulting probe-mask files reduced rapidly with increased threshold (Figure 1), while the number of probe-sets (i.e. genes) retained reduced at a slower rate, indicating that gene retention was good at increased gDNA hybridisation thresholds.
Number of probe-pairs (filled circles) and probe-sets (closed circles) retained from the Affymetrix U133+2 array as a function of the genomic DNA hybridisation intensity thresholds used to generate the probe mask files.

Analysis of sheep tissue samples
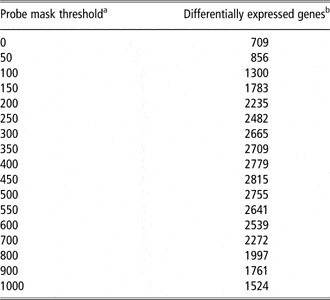
To demonstrate that probe selection can enable ovine RNA transcriptome quantification, triplicate muscle and liver RNA samples were labelled and hybridised to the Human U133 +2 array and analysed using the probe-mask files generated from the gDNA hybridisation results. The number of genes differentially expressed between muscle and liver (more than twofold difference, P < 0.05) was determined using the probe-mask files corresponding to gDNA hybridisation thresholds ranging from 0 to 1000. Without probe selection (threshold = 0), 709 genes were differentially expressed (Table 1), which increased as the threshold increased, reaching a maximum of 2815 differentially expressed genes at a threshold of 450. Above this threshold the number of differentially expressed genes reduced because the number of probe-sets (i.e. genes) retained in the probe mask files was reduced. Thus, a threshold of 450 was chosen for subsequent analysis, since it allowed good sensitivity to detect the maximum number of transcripts.
Number of genes differentially expressed between sheep liver and muscle using a range of probe mask thresholds

agDNA hybridisation threshold used to generate the probe mask filter.
bNumber of differentially expressed genes.
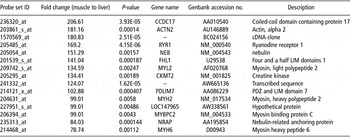
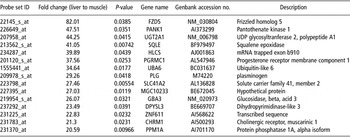
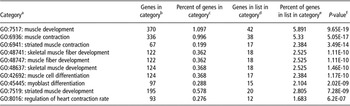
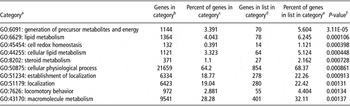
At a gDNA hybridisation threshold of 450, 83896 probe-pairs were retained, representing 37 863 probe sets (i.e. gene transcripts). The number of probe-pairs retained per probe-set varied between 1 and 14, with an average of 2.2. The RNA hybridisation data were analysed in more detail using the probe-mask generated at a gDNA hybridisation threshold of 450. In total, 20 699 gene transcripts (RMA normalised signal value >20) were detected in the two tissues (37.8% of total), with 18 693 gene transcripts detected in muscle and 18 787 detected in liver. Of the 2815 differentially expressed gene transcripts (more than twofold change, see supplementary data), 1051 were higher in muscle and 1764 higher in liver. As expected, the differentially expressed genes included many already known to be expressed in a tissue-specific manner or associated with tissue specific functions. For example, genes over-expressed in muscle compared to liver included ryanodine receptor 1, nebulin, myosin light and heavy polypeptides and creatine kinase (Table 2), all muscle-specific proteins; whereas genes over-expressed in liver compared with muscle included pantothenate kinase 1, squalene epoxidase, plasminogen and β-glucosidase (Table 3), all relating to known liver functions. Interestingly, the top 15 genes for each tissue also included some potentially novel ‘Hypothetical proteins’ with unknown functions in muscle or liver, which would not have been identified using the ovine or bovine arrays. Differentially expressed genes were further analysed by grouping them based on their GOs (http://www.geneontology.org/). As expected, the significant GO terms (ranked on P-value) for genes more than twofold higher in muscle compared to liver included ‘muscle development’, ‘muscle contraction’ and ‘myoblast differentiation’ (Table 4); while the GO terms of genes differentially expressed in liver included ‘generation of precursor metabolites and energy’, ‘lipid metabolism’ and ‘cell redox homeostasis’ (Table 5).
Top 15 genes over-expressed in sheep muscle compared to liver

Top 15 genes over-expressed in sheep liver compared to muscle

Over-represented gene ontology (GO) terms for probe-sets over-expressed (more than twofold, P < 0.05) in sheep muscle compared to liver

aGO term.
bNumber of probe-sets present on array within GO term.
cPercent of total probe-sets within GO term.
dNumber of differentially expressed probe-sets within GO term.
ePercent of differentially expressed probe-sets within GO term.
fHypergeometric P-value.
Over-represented gene ontology (GO) terms for probe-sets over-expressed (more than twofold, P < 0.05) in sheep liver compared to muscle

aGO term.
bNumber of probe-sets present on array within GO term.
cPercent of total probe-sets within GO term.
dNumber of differentially expressed probe-sets within GO term.
ePercent of differentially expressed probe-sets within GO term.
fHypergeometric P-value.
Discussion
The relative changes in probe pairs and probe sets with increasing threshold are consistent with previous studies in plants using the same technique (Hammond et al., Reference Hammond, Broadley, Craigon, Higgins, Emmerson, Townsend, White and May2005 and Reference Hammond, Bowen, White, Mills, Pyke, Baker, Whiting, May and Broadley2006; Graham et al., Reference Graham, Broadley, Hammond, White and May2007). The results of the RNA analysis comparing skeletal muscle and liver transcriptomes demonstrate that the gDNA probe selection method is suitable for studying gene expression profiles in sheep tissues and produces biologically relevant data. The selection of the gDNA threshold used to perform the analysis has an effect on the number of differentially expressed genes identified. Increasing the threshold will increase the specificity (i.e. sequence similarity between sheep RNA and human probes) of the probes retained, but as this increases, the number of probe-sets and hence genes detected will decrease. Conversely, if a low threshold is used, probes will be retained that have low specificity, and hence the gene signals may be less accurate. In this study, the threshold that gave the greatest sensitivity (greatest number of differentially expressed genes) was used. This includes a number of transcripts (probe sets) with only one probe-pair being retained, but is equivalent to using a single oligonucleotide array. Since the number of probe-pairs retained per probe-set will vary with threshold, this needs to be considered when interpreting the data. Probe-sets with only a single probe retained may not be specific to a single gene and may be representative of a gene family. The advantages of using the human GeneChip array over available ovine or bovine arrays are: (i) it contains more transcripts (45 K compared with 15 and 23 K for ovine and bovine arrays); (ii) it has better coverage of the whole genome, including novel genes of unknown function; and (iii) it has more extensive gene annotation. In addition, labelling, hybridisation and processing of Affymetrix GeneChip arrays is highly automated, thereby producing very reproducible results, whereas cDNA arrays are less automated and therefore likely to be less reproducible. In addition, GeneChips have been shown to be more specific and have a greater dynamic range than cDNA arrays (Mah et al., Reference Mah, Thelin, Lu, Nikolaus, Kühbacher, Gurbuz, Eickhoff, Klöppel, Lehrach, Mellgård, Costello and Schreiber2004; Woo et al., Reference Woo, Affourit, Daigle, Viale, Johnson, Naggert and Churchhill2004) and there are numerous publically available data sets for human GeneChips that could be directly compared with experiments performed using this technique. This method will allow transcriptome analysis of developmental and metabolic processes, as well as disease responses, in sheep and possibly other species for which specific microarrays are not available.
Acknowledgements
The authors gratefully acknowledge D. Surgay for technical assistance. N.G. was supported by a BBSRC grant (grant reference BBE01772×1).