


Introduction
GaN is a material of great interest due to its wide applicability in optoelectronics and high temperature electronics. However, the role of electrically active defects and their sources in GaN are still not well understood [Reference Calleja, Sanchez, Basak, Sanchez-Garcia, Muñoz, Izpura, Calle, Tijero, Sanchez-Rojas, Beaumont, Lorenzini and Gibart1-Reference Hierro, Kwon, Ringel, Hansen, Speck and DenBaars5]. Thus, further studies regarding the deep levels found within the n-GaN bandgap which are associated with such defects are needed. While p+-n diode configurations are used for GaN LED’s and lasers applications, n-Schottky diodes are of interest for GaN FET’s. Thus, the role of the device configuration on the deep level spectrum is also of great interest. In this article deep level transient spectroscopy (DLTS) is used to study the deep level spectra in p+-n and n-Schottky GaN diodes and the fundamental properties of specific deep levels are explored. Both majority and minority carrier injection conditions are used for the DLTS measurements which allows the observation of both electron and hole traps in the n-GaN layer found up to ∼0.9 eV from the conduction and valence bands, respectively.
Experiment
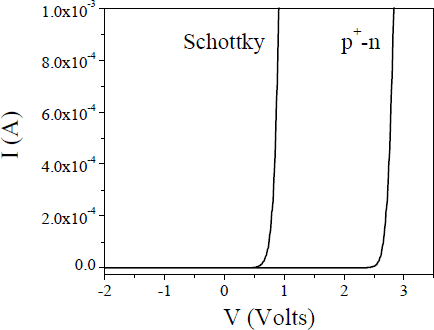
GaN test devices were grown by MOCVD using a horizontal flow reactor on a c-sapphire substrate. A 0.5 µm-thick unintentionally doped n-type layer (n=3×1016 cm−3) was first deposited followed by 0.5 µm-thick Si-doped (n=3×1018 cm−3) and 1 µm-thick Si-doped (n=8×1018 cm−3) GaN layers [Reference Keller, Keller, Kapolnek, Jiang, Wu, Masui, Wu, Heying, Speck, Mishra and DenBaars6]. A 1.2 µm-thick unintentionally doped n-GaN layer (n=3.5×1016 cm−3) was next deposited for the n-Schottky and p+-n diodes, followed by a 0.16 µm-thick Mg-doped GaN layer (p=0.8−1×1018 cm−3) for the p+-n structure. Pd/Au and Ni were next deposited providing ohmic and Schottky contacts to the GaN. Under these conditions the depletion region is fully contained in the n-GaN layer in both types of diodes. Back contact to the 1 µm-thick n-GaN layer was provided by a Ti/Al/Ni/Au metal layer. The diode size was ∼0.23 mm2, with a reverse leakage current at −1 V of ∼4×10⁻¹⁰ and ∼2×10⁻⁹ A/cm2 and a turn-on voltage of ∼2.2 and ∼0.4 V for the p+-n and Schottky diodes, respectively, at 300 K (Fig. 1).
I-V curves measured at 300K for the n-Schottky and p+-n GaN diodes. As expected, a much larger built-in voltage is observed for the p+-n diode.
DLTS experiments were performed using a Boonton capacitance meter at 1 MHz. Rate windows between 4 and 200 sec−1 were used with a −1 V quiescent voltage applied to the diodes for all measurements. Majority carrier trap filling was ensured by a 10 ms-long pulse under a fill pulse voltage (Vp) of −0.2 V for both the p+-n and Schottky diodes. Depth resolved DLTS measurements of the majority carrier traps were achieved by changing Vp from −0.2 to 1, 1.5, and 2 V in the p+-n diode. Positive Vp also provided minority carrier injection in the p++-n sample, allowing the observation of hole traps in the n-side of the junction [Reference Blood and Orton7].
Results and Discussion
In this section the majority carrier traps (electron traps) for the n-Schottky diode are first discussed and followed by a comparison to those found in the p+-n diode. This comparison is followed by a study of the minority carrier traps (hole traps) found in the n-side of the p+-n diode.
The majority carrier DLTS spectrum for the n-Schottky diode is shown in Fig. 2. A prominent peak is observed which corresponds to an electron trap found within the n-GaN layer with an activation energy of Ec−Et =0.62 eV, as extracted from the Arrhenius plot (Fig. 3), and with a concentration of ∼4.1×1014 cm−3. The capture cross section for the 0.62 eV level is ∼5×10⁻¹⁵ cm2.
DLTS spectra for the n-Schottky GaN diode under Vp=−0.2 V for different rate windows.

Arrhenius behavior of the electron and hole traps found in both p+-n and n-Schottky GaN diodes.

As seen in Fig. 2, the DLTS peak height of the Ec −0.62 eV trap showed no dependence on rate window. Moreover, theoretical modeling of an ideal single state at Ec −0.62 eV yielded a FWHM/Tpeak ratio of 0.11, in close agreement with the measured value of 0.14. Together, these observations suggest a point defect as the source for this electron trap [Reference Blood and Orton7].
In contrast to the Schottky results, a conventional DLTS filling pulse of Vp=−0.2 V does not reveal the presence of the Ec −0.62 eV level in the p+-n diode (Fig. 4). However, as Vp is increased so that the depletion region width reduces, approaching the heavily Mg-doped cap layer, the trap reappears. Note that at 2 V (still below the turn-on voltage) and 400 K the current injected into the p+-n diode is still ≤1 nA indicating that such a change in the DLTS peak height is most likely due to an increase in the trap concentration close to the Mg-doped cap but still within the n-GaN layer. The activation energy for this electron trap was found to be Ec−Et =0.58 eV (Fig. 3) and the capture cross section ∼1×10⁻¹⁵ cm2. At Vp=2 V the concentration of this level is ∼2.7×1014 cm−3, very similar to that observed in the n-Schottky diode. Indeed, as shown in Fig. 3 the Arrhenius behaviors of the 0.58 and 0.62 eV levels are very similar which clearly indicates that they are very likely the same level.
DLTS spectrum obtained from the p+-n GaN diode for a rate window of 50 sec−1 as a function of fill pulse bias voltages.

However, note that for a given rate window (e.g. 50 sec−1 in Figs. 2 and 4) the DLTS peak associated with the 0.58−0.62 eV level shows a small shift to higher temperatures from the Schottky to the p+-n diode, which in turn produces the 0.04 eV shift in activation energy shown in Fig. 3. Such a shift can be explained in terms of the difference in the magnitude of the electric field present in the depletion region in both samples. Indeed, Fig. 1 shows a turn-on voltage of ∼0.4 V and ∼2.2 V for the Schottky and p+-n diodes, respectively, which implies that a larger junction barrier is present in the p+-n diode. This indicates that the electric field is much larger in the p+-n sample. Under these conditions emission from the 0.58−0.62 eV level is enhanced by the larger field in the p+-n diode, producing a decrease in the measured activation energy [Reference Blood and Orton7].
The Ec−Et =0.58−0.62 eV level shows a similar Arrhenius behavior as the E2 level previously reported in n-Schottky diodes [Reference Hacke, Detchprohm, Hiramatsu, Sawaki, Tadatomo and Miyake2], and is likely produced by the same defect. The E2 level concentration has been observed to depend on the Cp2Mg flow rate during growth of the n-GaN layer, increasing under larger flow conditions [Reference Hacke, Nakayama, Detchprohm, Hiramatsu and Sawaki4]. As shown in Fig. 4, the 0.58 eV level emission is highly dependent on fill pulse bias, increasing in magnitude by at least a factor of 15 from −0.2 to 2V, which corresponds to a shift in the depletion region width of ∼0.2 μm towards the p+-side of the junction. Such a large increase in concentration tracks the residual Mg concentration profile in the n-side of the junction observed by second ion mass spectroscopy [Reference Hierro, Kwon, Ringel, Hansen, Speck and DenBaars5].
Finally, the DLTS spectrum at Vp==2 V for the p+-n diode is shown in Fig. 5. A large negative peak is observed in the DLTS spectrum that was not be observed for negative fill pulse voltages. This peak was also observed for Vp=1 and 1.5 V with a magnitude decreasing with decreasing Vp. The injected current under these conditions is below 1 nA and the depletion region width is 30 times larger on the n-side than on the p-side of the p+-n junction. Moreover, this hole trap could not be observed in the n-Schottky diode (with Vp=0.4 V) as would be expected from such a junction, where minority injection is not possible. Together, these observations indicate that this DLTS feature is indeed a minority carrier hole trap found in n-GaN. This hole trap shows an activation energy of Et−Ev =0.87 eV (Fig. 3) with a concentration ≥ 3.7×1014 cm−3, and a capture cross section of ∼6×10⁻¹⁴ cm2. The position in the bandgap of the 0.87 eV hole trap correlates very well with a deep level at Ec−Et ==2.64 eV measured under optical excitation by deep level optical spectroscopy (DLOS) [Reference Hierro, Kwon, Ringel, Hansen, Speck and DenBaars5] and observed in both p+-n and n-Schottky GaN diodes. It is also close to a deep level previously reported in n-Schottky diodes and associated with the yellow luminescence in n-GaN [Reference Calleja, Sanchez, Basak, Sanchez-Garcia, Muñoz, Izpura, Calle, Tijero, Sanchez-Rojas, Beaumont, Lorenzini and Gibart1], and correlates well with calculated energy levels associated with VGa-O and VGa-donor complexes [Reference Neugebauer and Walle3].
Minority carrier DLTS spectra from the p+-n GaN diode at Vp=2 V for different rate windows.

Conclusions
In summary, DLTS has been used to study and compare deep levels and their electrical signature in n-Schottky and p+-n GaN diodes. Majority and minority carrier injection during the measurements allowed the observation of both electron and hole traps in the n-GaN layer. The n-Schottky diode shows an electron trap at Ec−Et =0.62 eV with a concentration of ∼4.1×1014 cm−3 and a capture cross section of ∼5×10⁻¹⁵ cm2. A deep level at Ec−Et =0.58 eV is also observed in the p+-n diode with a concentration of ∼2.7×1014 cm−3 and a capture cross section of ∼1×10⁻¹⁵ cm2. The similar Arrhenius behavior of the two electron traps in both types of diodes indicates that the two levels are likely related to the same defect. The shift in the activation energy from 0.62 to 0.58 eV between the n-Schottky and p+-n diodes is due to an electrical field enhancement of the emission rate in the p+-n diode. Under minority carrier injection a hole trap at Et−Ev =0.87 eV with a concentration ≥ 3.7×1014 cm−3 and a capture cross section of ∼6×10⁻⁴ cm2 is observed in the n-GaN layer. This level was only observed in the p+-n diode due to the fact that hole injection is needed for this measurement and is not possible for an ideal Schottky junction. The Et−Ev =0.87 eV is likely related to the yellow band [Reference Calleja, Sanchez, Basak, Sanchez-Garcia, Muñoz, Izpura, Calle, Tijero, Sanchez-Rojas, Beaumont, Lorenzini and Gibart1], and correlates very well with a level observed both in n-Schottky and p+-n GaN diodes by DLOS [Reference Hierro, Kwon, Ringel, Hansen, Speck and DenBaars5].
Acknowledgements
This work was supported by the National Science Foundation through Grants No. DMR-9458046 and DMR-9711851. The work at UCSB was supported by the Office of Naval Research (C. Wood and J. Zolper).



