

Introduction
The Great Recession has widened the income gap between the developed world’s affluent and the poor. Income inequality in the OECD has reached the highest level over the past half-century (OECD, 2019, 2011). Concerns about this are particularly salient when they relate to people at the bottom of the income distribution, who are more exposed to the risk of poverty. While absolute poverty is rare among most OECD member states, relative poverty, measured as an income of less than 50 per cent of the median, is common and has been on the rise. In 2017 nearly one in four persons, equivalent to almost 115 million people, were at risk of poverty and social exclusion in the European Union (European Commission, 2019) and this trend is likely to be reinforced by the COVID-19 crisis as the pandemic outbreak hits the poorest hardest (World Economic Forum, 2020). Do the erstwhile representatives of the poor, namely the left, still, care about them? And if so, can they still implement policies to curb poverty?
Despite the widely shared concerns about the rise of poverty, the lion’s share of recent inequality research has addressed the increasing accumulation of wealth and incomes at the top and has largely ignored those left behind at the bottom of the distribution (eg. Hacker & Pierson, Reference Hacker and Pierson2010; Saez & Zucman, Reference Saez and Zucman2019; Scheve & Stasavage, Reference Scheve and Stasavage2016). Moreover, traditional welfare state research tends to focus on social spending or specific social policy areas instead of gauging their impact and significance in the context of poverty alleviation (for exceptions see for instance: Brady, Reference Brady2009).
Those that argue that the Left no longer conducts politics for the poor focus on several changes that have occurred domestically and internationally since the 1980s that might explain why. From an international perspective, globalisation constrains domestic policy-making and leads to a race-to-the-bottom (Genschel & Schwarz, Reference Genschel and Schwarz2011). Governments of all colours cannot alleviate poverty anymore. Domestically, deindustrialization leads to more precarious working conditions and therefore exclusion from collective bargaining agreements and lower turnout by the poor (Schäfer, Reference Schäfer2015; Solt, Reference Solt2008; Verba, Nie, & Kim, Reference Verba, Nie and Kim1978). Therefore, the Left might no longer want to focus on the poor, but rather on the middle classes.
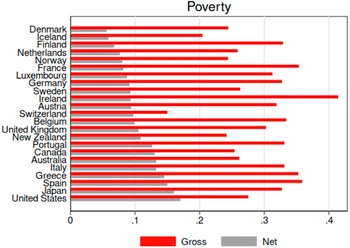
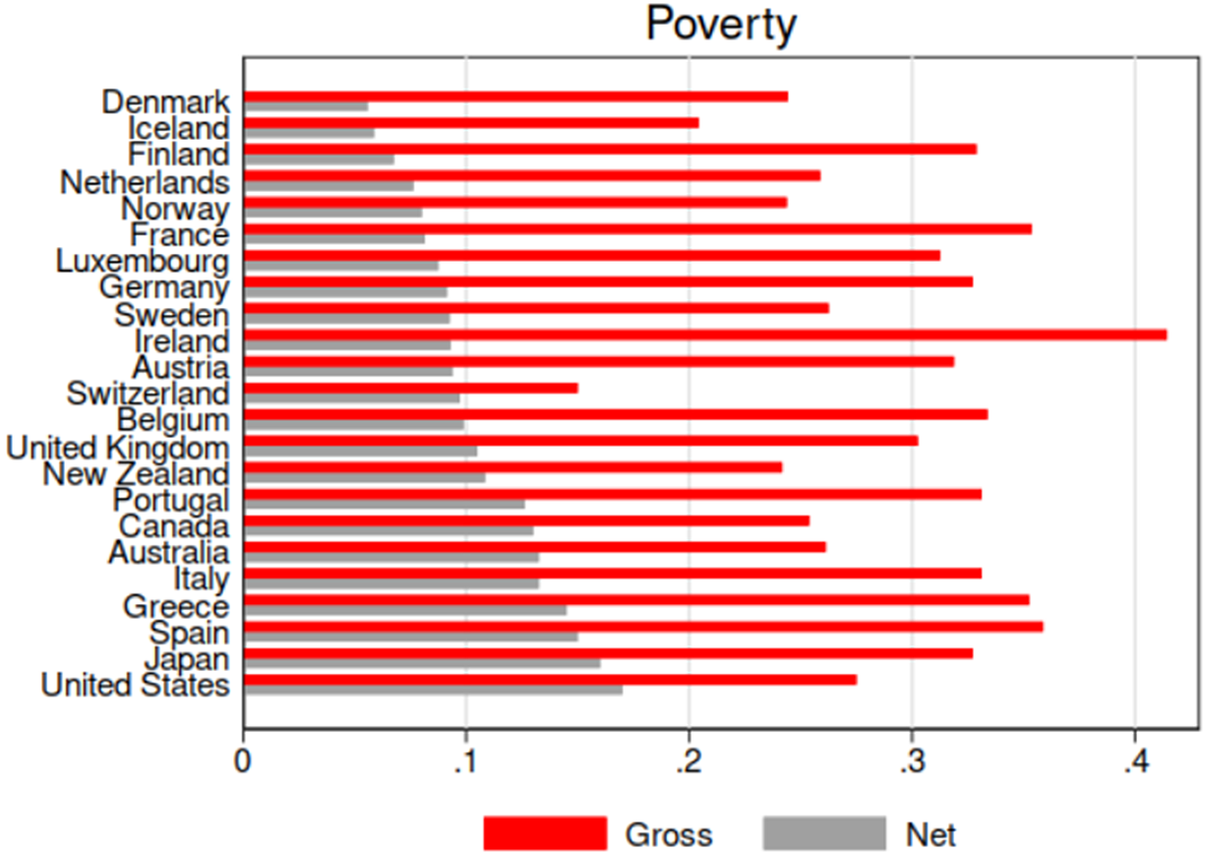
Empirically, however, we see substantial cross-national differences in the governmental efforts to reduce poverty among advanced welfare states (average values 2009–2018) as Figure 1 illustrates. Take for instance Sweden and the United States, two countries with similar gross poverty rates. Sweden arrives at a much lower net poverty rate of 9 per cent in comparison to 18 per cent in the United States.
Cross-national variation in poverty (reduction). Gross poverty: share of poverty before redistribution at 50 per cent of median income, redistribution: difference between gross and net poverty at 50 per cent of median income. Source: Own graphs based on the OECD income distribution database (OECD, 2019).
In this article, we test whether this difference is due to left politics. We start by reviewing the literature on the politics of redistribution and inequality. The focus is on the role of labour power resources, a key approach for explaining differences in governments’ redistributive capacity. We extend this literature by discussing the current challenges that the Left is facing in responding to the needs and interests of the poor. Following the review, we develop guiding research hypotheses on the political and economic conditions that shape redistribution to the poor. Empirically, we analyse the redistributive influence of the Left on two main indicators, on policies and on outcomes. We distinguish between measures focusing on the poor and those focusing more on the middle classes to test which group benefits. Our findings suggest that the interests of the poor are not entirely left behind by the Left. Strong labour powers, particularly of trade unions, tend to increase redistribution overall as well as to the poor. Yet, the empirical evidence for the influence on the specific policies is less positive and consistent. Overall, however, our findings suggest that high poverty risks are still being addressed as a political and societal concern.
Literature review: explaining patterns of redistribution and poverty alleviation
How can we explain the rise of poverty in rich democracies? Over the last decade, scholarly interest in the rise of economic inequalities has increased (Gustaffson & Johansson, Reference Gustaffson and Johansson1999; Hacker & Pierson, Reference Hacker and Pierson2010; Huber et al., Reference Huber, Huo and Stephens2017; Moene & Wallerstein, Reference Moene and Wallerstein2001; Pontusson et al., Reference Pontusson, Rueda and Way2002; Rueda, Reference Rueda2008) and scholars have disentangled the concept by describing and analysing different kinds of inequalities. After all, economic inequality can be driven by the accumulation of high incomes and wealth at the top or by the rise of poverty at the bottom or by both simultaneously. Such different kinds of inequality do not only require different policy solutions, but they are also likely to be subject to different dynamics and constraints. While a dynamic research strand has emerged investigating the politics of high incomes and wealth (cf. Emmenegger & Marx, Reference Emmenegger and Marx2019; Hacker & Pierson, Reference Hacker and Pierson2010; Huber et al., Reference Huber, Huo and Stephens2017; Limberg, Reference Limberg2019; Scheve & Stasavage, Reference Scheve and Stasavage2017), less interest has been on governments redistributive capacity to the poor (for exceptions see: Bradley et al., Reference Bradley, Huber, Moller, Nielsen and Stephens2003; Brady, Reference Brady2019; Brady et al., Reference Brady, Bloome and Kleider2016; Kenworthy & Pontusson, Reference Kenworthy and Pontusson2005; Mahler, Reference Mahler2010). In the following, we discuss the state of the art with a particular focus on poverty alleviation in advanced democratic societies. It is our main argument that due to a number of socio-economic changes, that is, globalisation and the dualization of the workforce into a richer middle and poorer lower class, it is no longer apparent, to what extent the Left is responsive to the interests of the poor.
Traditional state of the art: the politics of redistribution and poverty alleviation
Brady (Reference Brady2019) identifies three main approaches to explaining poverty: behavioural, structural, and political. While behavioural theories focus on behaviours of the poor for instance, shaped by incentives and cultural norms, structural theories look at the socio-economic contexts (ie. Alper et al., Reference Alper, Huber and Stephens2021, Moller et al. Reference Moller, Huber, Stephens, Bradley and Nielsen2003) and political theories emphasise power and institutions (ie. Brady et al., Reference Brady, Bloome and Kleider2016). In this article, we combine the structural and political perspectives and build on one of the most prominent approaches for explaining variations in inequality and redistribution is the Power Resource Theory (PRT) (Brady, Reference Brady2019; Esping-Andersen & Korpi, Reference Esping-Andersen and Korpi1984; Huber & Stephens, Reference Huber and Stephens2001; Korpi, Reference Korpi1983). The PRT has a long-standing history, as scholars from this perspective were the first to point out that variations in welfare state coverage and generosity is largely attributed to differences in working-class mobilisation (Korpi, Reference Korpi1983). Their particular organisation and relative strength either politically through labour parties or economically through trade unions affects policies and economic outcomes. While the PRT found its origins in the welfare state literature, it has been adopted more broadly for understanding patterns of inequality and redistribution (Bradley et al., Reference Bradley, Huber, Moller, Nielsen and Stephens2003; Kenworthy & Pontusson, Reference Kenworthy and Pontusson2005; Mahler et al., Reference Mahler, Jesuit, Paradowski, Gornick and Jäntti2013; Rueda, Reference Rueda2008; Wallerstein, Reference Wallerstein1999). Strong trade unions and social-democratic political parties imply a better representation of lower-income groups and are therefore assumed to lead to more egalitarian forms of capitalism (Kenworthy, Reference Kenworthy2004).
During the process of industrialisation, labour unions and left-wing parties emerged as key actors representing the economic interests of the working class vis-à-vis capital owners. The labour-capital divide has been an important societal cleavage in all advanced democratic societies although forms and extent of an organisation have certainly led to different kinds of welfare capitalism. Although unions are often regarded as first and foremost influence market inequalities, they are also influential actors for the redistributive capacities of states. They can mobilise voters, align and form coalitions with parties, and hence influence governments’ policy decisions (Western & Rosenfeld, Reference Western and Rosenfeld2011). Similarly, labour governments can address market inequalities through regulatory policies such as working standards and minimum wages (Rueda, Reference Rueda2008) or by increasing redistributive policies such as progressive taxes or social transfers and in-kind benefits.
The empirical evidence for the influence of the Left on redistribution in general and poverty in specific, is however not as clear-cut as the analytical argument of the PRT. While numerous studies support that the Left has positively influenced redistribution (Bradley et al., Reference Bradley, Huber, Moller, Nielsen and Stephens2003; Cusack, Reference Cusack1997; Cusack & Iversen, Reference Cusack and Iversen2000; Garrett, Reference Garrett1998; Korpi & Palme, Reference Korpi and Palme2003), others find no influence (Frieden, Reference Frieden1991; Kato, Reference Kato2003) or that their influence changes over time depending on the context (Busemeyer, Reference Busemeyer2009). The findings for their influence on poverty alleviation are even more ambiguous. Pontusson, Rueda, and Way (Reference Pontusson, Rueda and Way2002) find that labour governments do not significantly raise the wages of poorly paid workers. Similarly, Mahler (Reference Mahler2010) does not find a significant Left party effect on poverty reduction. However, others show a positive relationship between the power resources of the Left and redistribution to the poor (Brady, Reference Brady2009; Moller et al., Reference Moller, Huber, Stephens, Bradley and Nielsen2003). In sum, existing studies offer mixed empirical support whether the power resources of the Left positively influence redistribution in general and to people at the bottom of the income distribution in specific.
There are two main reasons for these diverging findings. First, the studies of inequality and redistribution are broad fields of research and scholars focus on different dependent variables. Generally, welfare state scholars are mostly concerned with policies, while inequality scholars focus on outcomes. As different types of welfare states often choose distinctive social policies to engage with similar problems (Castles, Reference Castles and Castles1989; Van Kersbergen & Hemerijck, Reference Van Kersbergen and Hemerijck2012), comparing one policy across countries might lead to inconclusive findings. Similarly, scholars measure inequality in different ways – and hereby mostly focus on inequality instead of poverty. We rely on several dependent variables to integrate these views in our analysis.
The second reason for the inconsistent empirical findings is the fact that the national and international context in which the Left operates has changed. Hence, left parties and trade unions might really no longer represent the interests of the poor. The next section discusses the arguments and counterarguments in more detail.
The changing nature of left politics and poverty alleviation
To what extent do labour parties and unions represent the economic interests of the poor? In much of the political economy literature, labour representatives are assumed to defend the interests of the working class as one unified group. While the labour-capital cleavage is certainly still of high significance nowadays, it neglects that important socio-economic changes have taken place, which make it unclear if the Left is (still) responsive to the risks and demands of the poor. Both domestic and international changes exist, which might constrain the ability and willingness of the Left to conduct redistributive politics in the interest of the poor. We discuss different arguments and propose guiding research hypotheses.
Traditionally, the main cleavage of capitalist welfare states was between labour and capital. As such, labour parties organised around the common interests of the skilled and semi-skilled workers. However, the rise of the knowledge economy has led to an increase in the level of education of large parts of the skilled workforce and at the same time it has generated a significant margin of workers with low skills and poor employment opportunities (Wren, Reference Wren2013). Hence, the labour market is increasingly divided into the well-off middle class with secure employment conditions and good salaries. They have the ability to accumulate wealth, buy housing and make financial investments. By contrast, the less skilled and poorer segments of society face low-pay and temporary working conditions. This in turn restricts their ability to save and invest in their future (Emmenegger et al., Reference Emmenegger, Häusermann, Palier and Seeleib-Kaiser2012; Lindvall & Rueda, Reference Lindvall and Rueda2014; Rueda, Reference Rueda2005). The interests of the richer middle class with well-paid and secure employment conditions diverges significantly from those of the poor facing low-pay and precarious conditions (Iversen & Soskice, Reference Iversen and Soskice2015).
Accepting that labour is no unified group but divided into the well-off middle and the economically deprived lower class, we need to question to what extent labour unions and parties are still willing and able to equally represent both sets of socio-economic groups. Assuming that they have a certain set of resources which allows them to conduct redistributive policies, they will have to decide who should be the main beneficiary of them. They can allocate the majority of the financial resources towards policies that benefit the middle or to the poor or they can divide them up in a way to accommodate the risks and needs of both groups.
It seems plausible to assume that the Left represent the well-off middle, as this group mobilises politically, is engaged in important societal bodies and associations, and their votes are critical for electoral outcomes (Schäfer, Reference Schäfer2015; Verba et al., Reference Verba, Nie and Kim1978). The middle class has more time and resources to take part in political decisions and to obtain influential positions in the political and economic sphere (Teorell, Reference Teorell2006). But does the Left also conduct politics in favour of the poor? There are arguments on both sides. On the one hand, the literature suggests that democratic governments are less responsive to the preferences of low-income earners (Bartels, Reference Bartels2008; Elsässer et al., Reference Elsässer, Hense and Schäfer2018; Gilens, Reference Gilens2012). This can have several reasons: for instance, parties’ redistributive responses are driven by the motivation to win an election. Hence, left-wing parties are likely to converge away from the poor towards the middle in an attempt to maximise their votes (Downs, Reference Downs1957). Moreover, studies show that the poor are less likely to get politically involved. Poorer people are less likely to vote or to become a member of a party (Schäfer, Reference Schäfer2015; Solt, Reference Solt2008; Verba et al., Reference Verba, Nie and Kim1978). Similarly, they are not necessarily covered by trade union agreements due to non-standard contingent employment including nonpermanent, agency-work, or low-paid jobs, which easily lead to working poverty. As such, the transformation towards a knowledge economy leads to a more ambiguous role of the Left in conducting redistributive politics for the poor.
Besides the previously described domestic changes, also globalisation has modified the context, in which the Left operates (Garrett & Lange, Reference Garrett and Lange1991). First, trade liberalizstion has opened up the opportunity for social dumping (Rodrik, Reference Rodrik2018). Companies of high-income countries increasingly need to compete with companies of low-income countries providing the latter a competitive advantage in the relatively cheaper production of goods. Particularly those industries of rich democracies, which largely require more unskilled labour are in competition with cheap imports and set under pressure. In an attempt to survive and to win the competitive game, governments are likely to undercut existing social standards including wages and social security payments by employers. This allows companies to lower their costs of production and stay competitive in the international context of trade liberalisation. Second, capital market liberalisation has reinforced tax competition between states leading to tax cuts for high incomes and capital (Genschel & Schwarz, Reference Genschel and Schwarz2011). This is likely to have one of the following effects: the Left accepts lower public revenues and cut (social) spending or they shift the tax burden to the middle class. In any case, economic globalisation possibly constraints the Left in conducting redistributive policy including those benefitting the poor.
While the turn towards the knowledge economy and the rise of economic globalisation both provide arguments for why the Left has left the poor behind, several arguments also exist for why they still (can) care for this economically and socially excluded group. As regards the dualization of the labour market, there are two main arguments why the Left cares about poor. First, poverty and the risk of poverty have grown among advanced democracies, which makes this group more attractive as a target electorate for labour parties (Schwander, Reference Schwander2018). Second, parties do not just attempt to maximise votes, but they also aim to leave an ideological imprint. They act according to their own understanding about what is right and wrong and can mobilise to increase support for certain values and ideas (Schmidt, Reference Schmidt1996). Looking after worker’s rights and well-being, including or even particularly of those who are left behind, is a critical part of solidarity. Similarly, trade unions do not only represent those that are being covered by collective bargaining agreements, but the better organised they are in terms of coverage and centralization, the more bargaining power they have to influence policies favourable to the poor (Rueda, Reference Rueda2005).
Similarly, for the international dimension arguments exist, which suggest that left-wing governments are able to conduct redistributive politics also in times of high economic globalisation. The compensation school argues that economic globalisation does not necessarily constrain redistributive efforts (Cameron, Reference Cameron1978; Garrett & Lange, Reference Garrett and Lange1991; Katzenstein, Reference Katzenstein1985; Rodrik, Reference Rodrik1997). By contrast, it can bring about bigger and more redistributive governments as they try to compensate groups who will not gain from globalisation. After all, globalisation cannot proceed if people increasingly feel that open markets pose a threat to their lives. Hence, redistribution can increase as a means to win the support by the groups threatened by globalisation. This school of thought originates from the observation that small open economies often also had relatively larger public sectors (Cameron, Reference Cameron1978).
In sum, we can deduce competing arguments about the role of the Left for pro-poor politics. If labour parties and unions mainly represent the interests of the middle class, we should only find a positive influence of the Left on those policies that are targeted at the middle and on inequality reduction in general terms. Alternatively, if the Left also represents the interests of the poor, we should also find a positive influence on policies targeted at the poor and on poverty reduction. In the following section, we describe our main dependent variables and the methodology applied before we revert to the empirical discussion.
Methodology and data
To evaluate the influence of the Left on the reduction of poverty and compare it with overall redistribution, we run regressions for up to 23 core OECD countries from 1981 up to 2017.Footnote 1 In the following, we explain the data and the methodology used to validate our hypotheses, before we present our key findings in the results section. As regards our dependent variables, we employ two sets of data, policy and outcome indicators (Table 1). The data are all from the OECD (2019) if not otherwise indicated. The variables were selected to represent the interests of lower-income groups and the middle classes respectively. While the selection of the outcome variable is rather straightforward, the choice for the right policy variables is more arbitrary. Our final decision is based on a mix of finding the most suitable measure and one that provides sufficient data coverage. We briefly explain our selection in the following.
Overview of dependent variables and their functions.

First, we employ two policy indicators to gauge the influence of the Left on redistributive policies. They were chosen with regards to their redistributive impacts and cover the revenue and the spending side. For “poor policies,” we include the bottom income tax rate and the minimum wage as a share of the mean wage. In all countries of our sample, the personal income tax is progressive. The lower the bottom income tax rate, the lower is the tax burden for groups with small incomes.Footnote 2 In turn, the minimum wage as a share of the mean wage shows the extent to which governments decide to intervene in the markets to narrow the wage gap between those at the bottom and those in the middle.Footnote 3 As regards policies not explicitly directed at the poor, but targeted more at the middle or top end of the income distribution, we use the top income tax rate and the unemployment replacement rate for an average worker (single without kids 2 months after losing the job). The lower the top-income tax rate, the lower is the tax burden for upper-middle classes. Certainly, one could argue that high replacement rates benefit all socio-economic groups including lower-income classes, particularly because they tend to be at higher risks of unemployment. While this policy is certainly not detrimental for the poor, unemployment benefits tend to be based on social insurance schemes, and as such payments are contingent on one’s own previous payments. The poor work often (periodically) outside of formal labour markets and are thus excluded from receiving the benefits.
Second, for the outcome variables, we use the reduction of gross poverty levels (poverty line at 50 per cent of median income) and the reduction of market inequality (Gini coefficient) through taxes and transfers. This allows us to separate governments’ redistributive efforts to the poor in comparison to those directed to society at large. As such, we calculate poverty reduction and redistribution as absolute reduction (eg. market Gini − post tax and transfer Gini), which is different from some papers that use the relative reduction [eg. (market Gini − post tax and transfer Gini)/market Gini]. It is possible that this brings about more significant coefficients for gross Gini and poverty in Table 2 – one reason for why we find some support for the median voter theorem. We further discuss this in the results section. Moreover, measuring redistribution in terms of outcome is not without flaws as it is also driven by fluctuations in the economic business cycle. Accordingly, social spending goes up not because governments actively expand benefits, but because social policies and progressive taxes serve as automatic stabilisers. To account for the ups and downs of the economy, we use several socio-economic controls as discussed below.
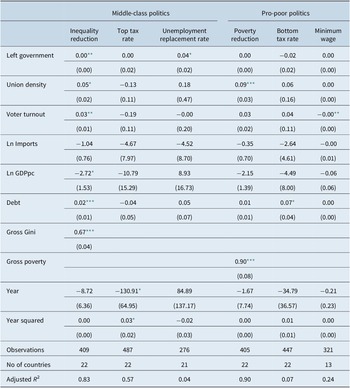
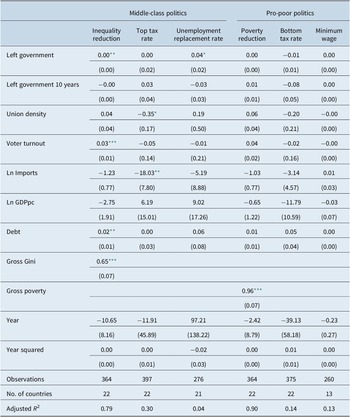
Estimation results for factors influencing inequality and poverty reduction.

Note. Robust standard errors are in parentheses.
*** p < 0.01;
** p < 0.05;
* p < 0.1.
The main independent variables of our models are the political power resources of the Left. For the political labour power, we use the percentage of cabinet posts held by left parties weighted by the days in office (Armingeon et al., Reference Armingeon, Knöpfel, Weisstanner, Engler, Potolidis and Gerber2019). Next to parties, which are the political channel of representation, trade unions are the economic representatives and likely to play a positive role for poverty reduction and redistribution. We include the union density to measure the power resources of trade unions (Visser, Reference Visser2021).
Next to our main independent variables, we control for a number of other factors. We include voter turnout (Armingeon et al., Reference Armingeon, Knöpfel, Weisstanner, Engler, Potolidis and Gerber2019), given that lower-income groups abstain more often from voting than higher ones, this should matter especially for pro-poor redistributive efforts. As regards the economic factors, we further include the level of market inequality (or poverty respectively) to account for the demand side (Kenworthy & Pontusson, Reference Kenworthy and Pontusson2005). Second, we control for the level of economic development (GDPpc) and government debt (as a percentage of GDP) to measure the capability of a government to redistribute. Lastly, we control for the level of trade openness by including the lagged share of imports per GDP. Trade is commonly used to gauge if globalisation has constrained governments redistributive preferences or if it leads to more redistribution to secure their citizens from the (negative) effects of globalisation.
Our independent variables do not correlate with each other at levels higher than 0.5. Hence, we do not need to worry about multicollinearity. To understand the general dynamics of the politics of inequality and poverty in advanced democracies in recent times, we pool data from all core OECD countries since the 1980s. Hence, our data is time-series-cross-sectional, yet unbalanced as some of the variables have missings for certain years or countries. To deal with the methodological challenges of time and space, as well as endogeneity concerns, we lag all independent variables by one year, include time and cubed time variables to deal with time dependency (Carter & Signorino, Reference Carter and Signorino2010) and cluster the standard errors by country. All models include country-fixed effects.
Empirical findings
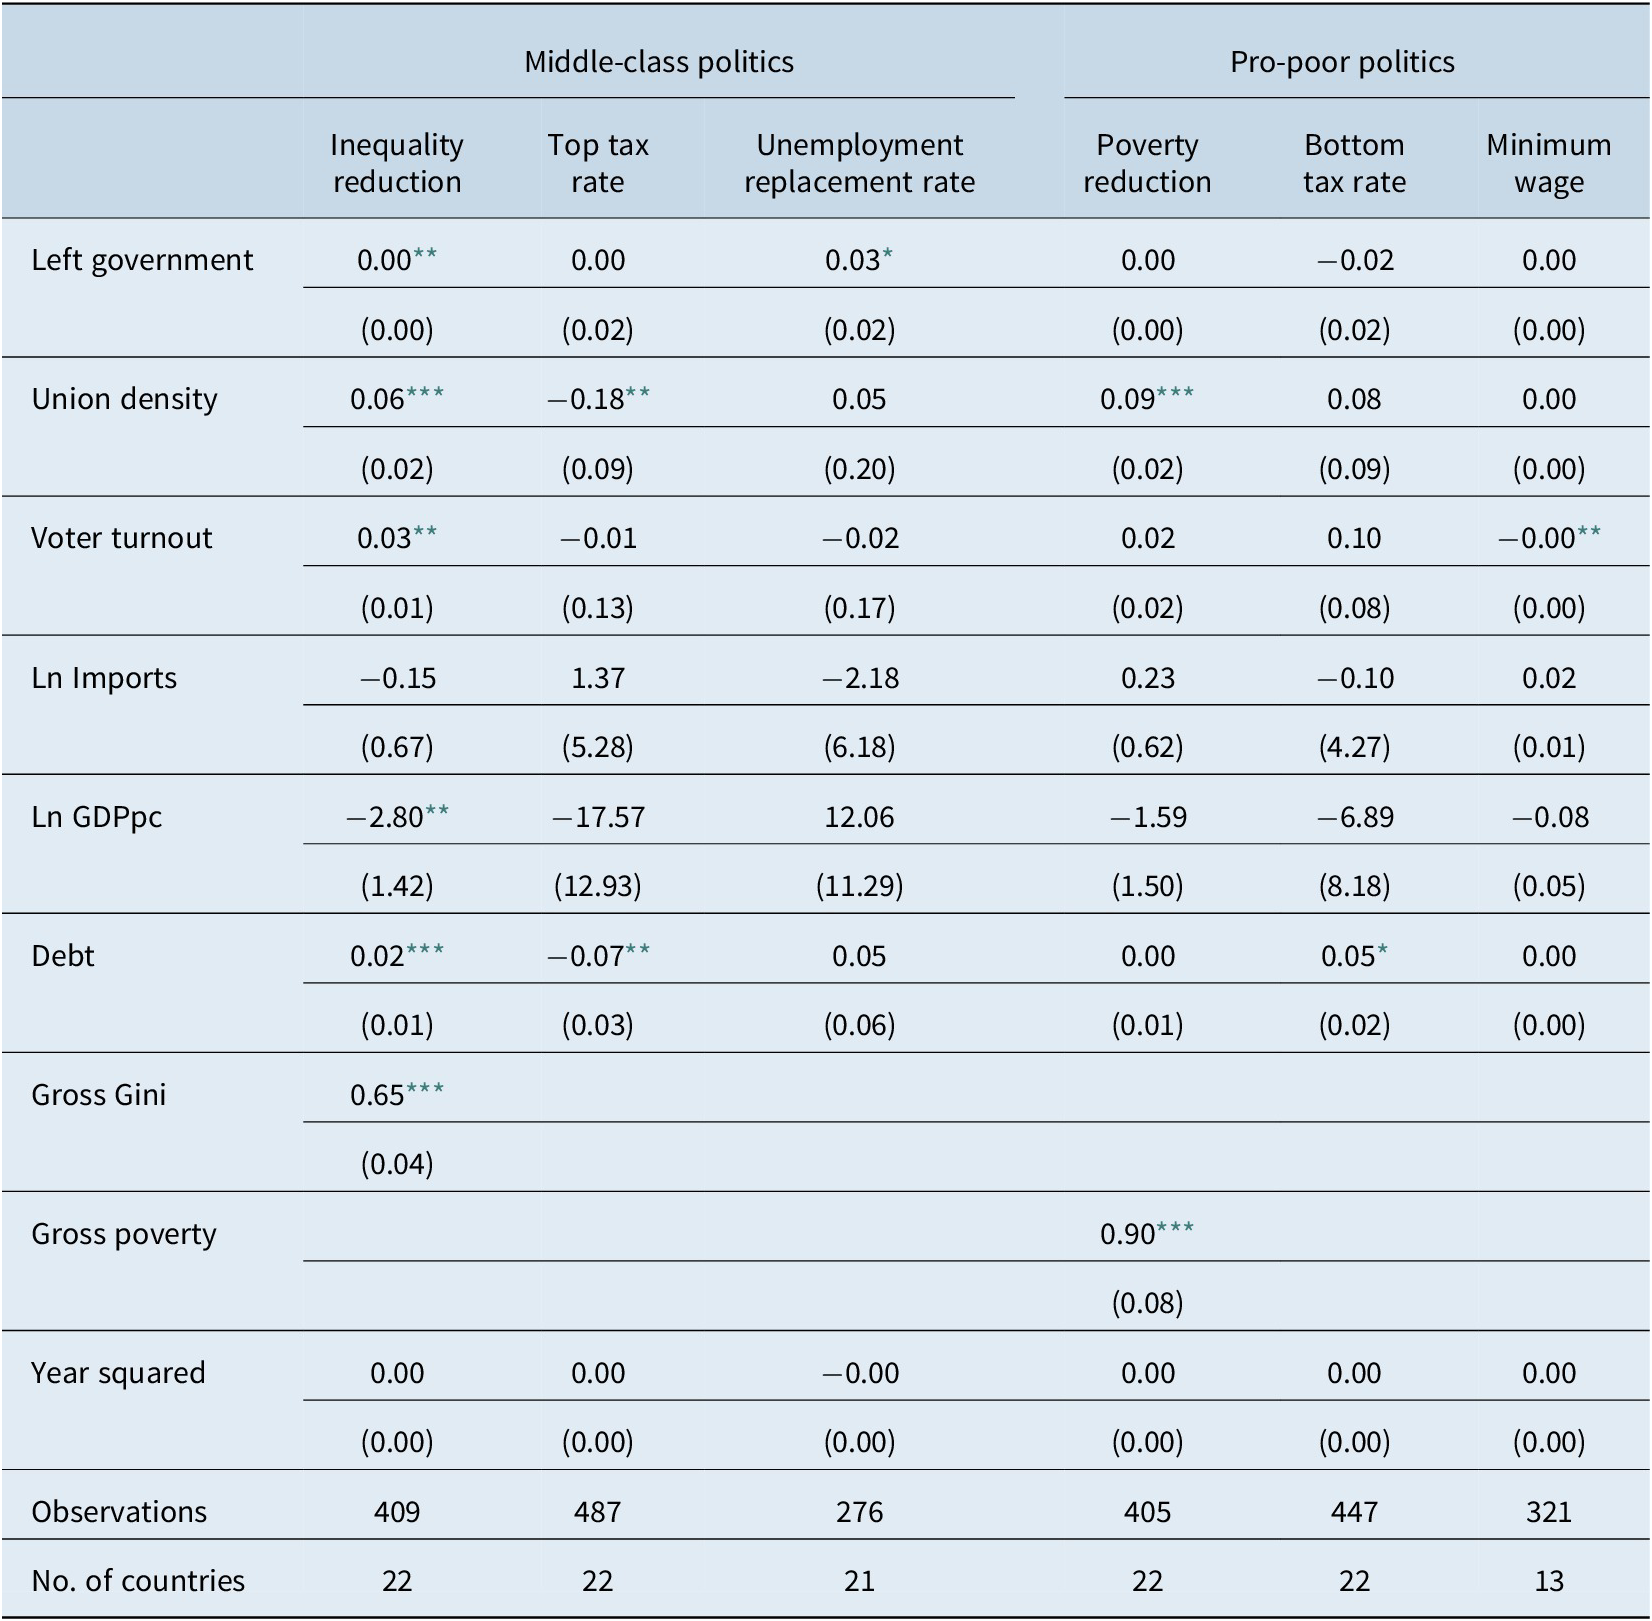
Table 2 presents our estimation results for the influence of the Left on policies and outcomes for the poor and the middle class respectively. The first three columns show the results for pro-middle-class politics and the last three columns for those outcomes and policies targeted at the poor. The respective first column presents the effects on policy outcomes and the last respective two show the factors influencing policies on the revenue and the spending side.
The findings are notable in three main respects. First, the power resources of the Left in terms of labour governments and union organisation do make a difference. They do not only positively influence redistribution targeting the middle, but they also have a positive effect on the pro-poor politics.
Second, while we find that the strength and the organisation of trade unions matters for inequality and poverty reduction, the positive influence of left-wing governments is only restricted to income inequality overall. Left-wing governments do not seem to represent pro-poor interests more than centre-conservative parties as they do not have a significantly positive effect on any of our pro-poor variables. By contrast, the effect is significant and positive as regards two out of our three pro-middle-class variables. Labour governments enhance inequality reduction overall and have a positive impact on unemployment replacement rates. Only in the case of the top income tax rates, we do not find a significant effect. The difference between policies on the spending and revenue side points towards electoral motives. Different than taxes, which belong to the area of quiet politics, unemployment rates are much more prone to public scrutiny (Culpepper, Reference Culpepper2010). With regard to the influence of trade union density, we find that it positively influences redistribution to the poor and the middle class in terms of our outcome variables. It suggests that unions are powerful actors, critical for how state resources are distributed among societal members. They are key actors with a substantial positive effect on egalitarian capitalism.
Third, the results are notable as the effects of labour power are much clearer for the outcome variables than the policy variables. This seems to indicate the complicated nature of comparing welfare states that accomplish their goals with various tax and social policy mixes. After all, to reduce poverty and inequality governments can revert to diverse policies including direct income transfer, education and housing regulation, or the distribution of the financial burden.
Reverting back to Table 2 and our controls, we find that existing market inequalities and poverty are consistent predictors for governments’ redistributive extent. Countries with higher market inequality (or poverty) also redistribute more – a result, which is in line with the median voter theorem (Meltzer & Richard Reference Meltzer and Richard1981). The theorem suggests that redistribution or demand for redistribution increases when inequality rises (Chevalier et al., Reference Chevalier, Elsner, Lichter and Pestel2019; Meltzer & Richard, Reference Meltzer and Richard1981) although empirically, the theorem has gained less clear-cut support (Lierse, Reference Lierse2018; Milanovic, Reference Milanovic2000). Our findings seem to support the suggested mechanisms of the median voter theorem, that is, governments redistribute more when inequality increases. It could suggest that poverty is regarded as an overall societal concern and that both labour and conservative parties alike attempt to address this problem. After all, poverty measures serve as an international benchmark for successful countries, for instance as part of the Sustainable Development Goals of the United Nations. As such countries are internationally evaluated and possibly named and shamed in case they do not alleviate poverty. Moreover, poverty can lead to all sorts of societal problems such as crime and unrests, outcomes that are undesirable for all (Rueda & Stegmueller, Reference Rueda and Stegmueller2016). Yet, the results do not necessarily show that governments actively increase redistributive efforts when inequality increases. They can simply demonstrate that the automatic stabilisers of advanced welfare and tax states hold.
Unsurprisingly, poorer countries are less redistributive. Maybe slightly more surprising, this effect does not seem to exist for poverty alleviation, suggesting that even poorer welfare states have the capability to support the poor. Also interestingly, higher debt rates do not seem to stop countries from redistributing. The positive effect of government debt on inequality reduction seems to indicate that this is possibly done via borrowing. Trade has no significant effect suggesting that globalisation does not necessarily lead to a race to the bottom. As theorised in the literature (Verba et al., Reference Verba, Nie and Kim1978), voter turnout leads to more redistribution as more poor people are part of the electorate. Surprisingly this effect seems to be driven by general redistribution, not by pro-poor redistribution. A higher turnout even has a negative effect on the minimum wage. However, this variable needs to be viewed with some caution as a minimum wage policy does not exist in all countries. In fact, countries such as Denmark and Sweden do not have a minimum wage, as here union coverage tends to be much higher and hence, a minimum wage is less important.
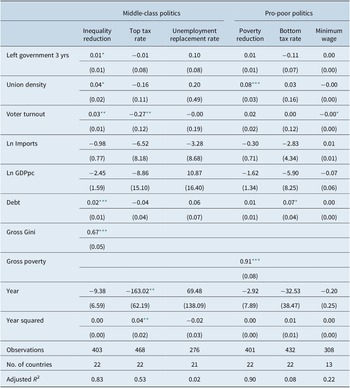
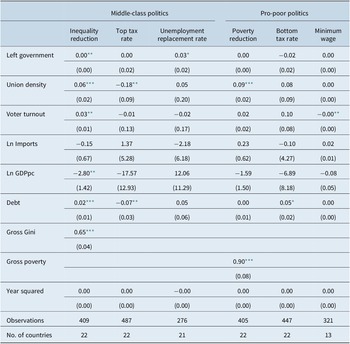
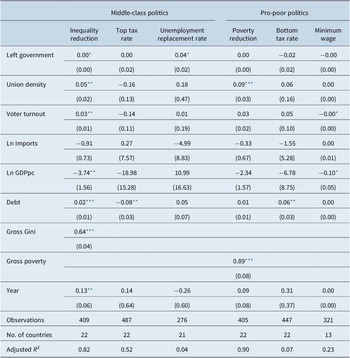
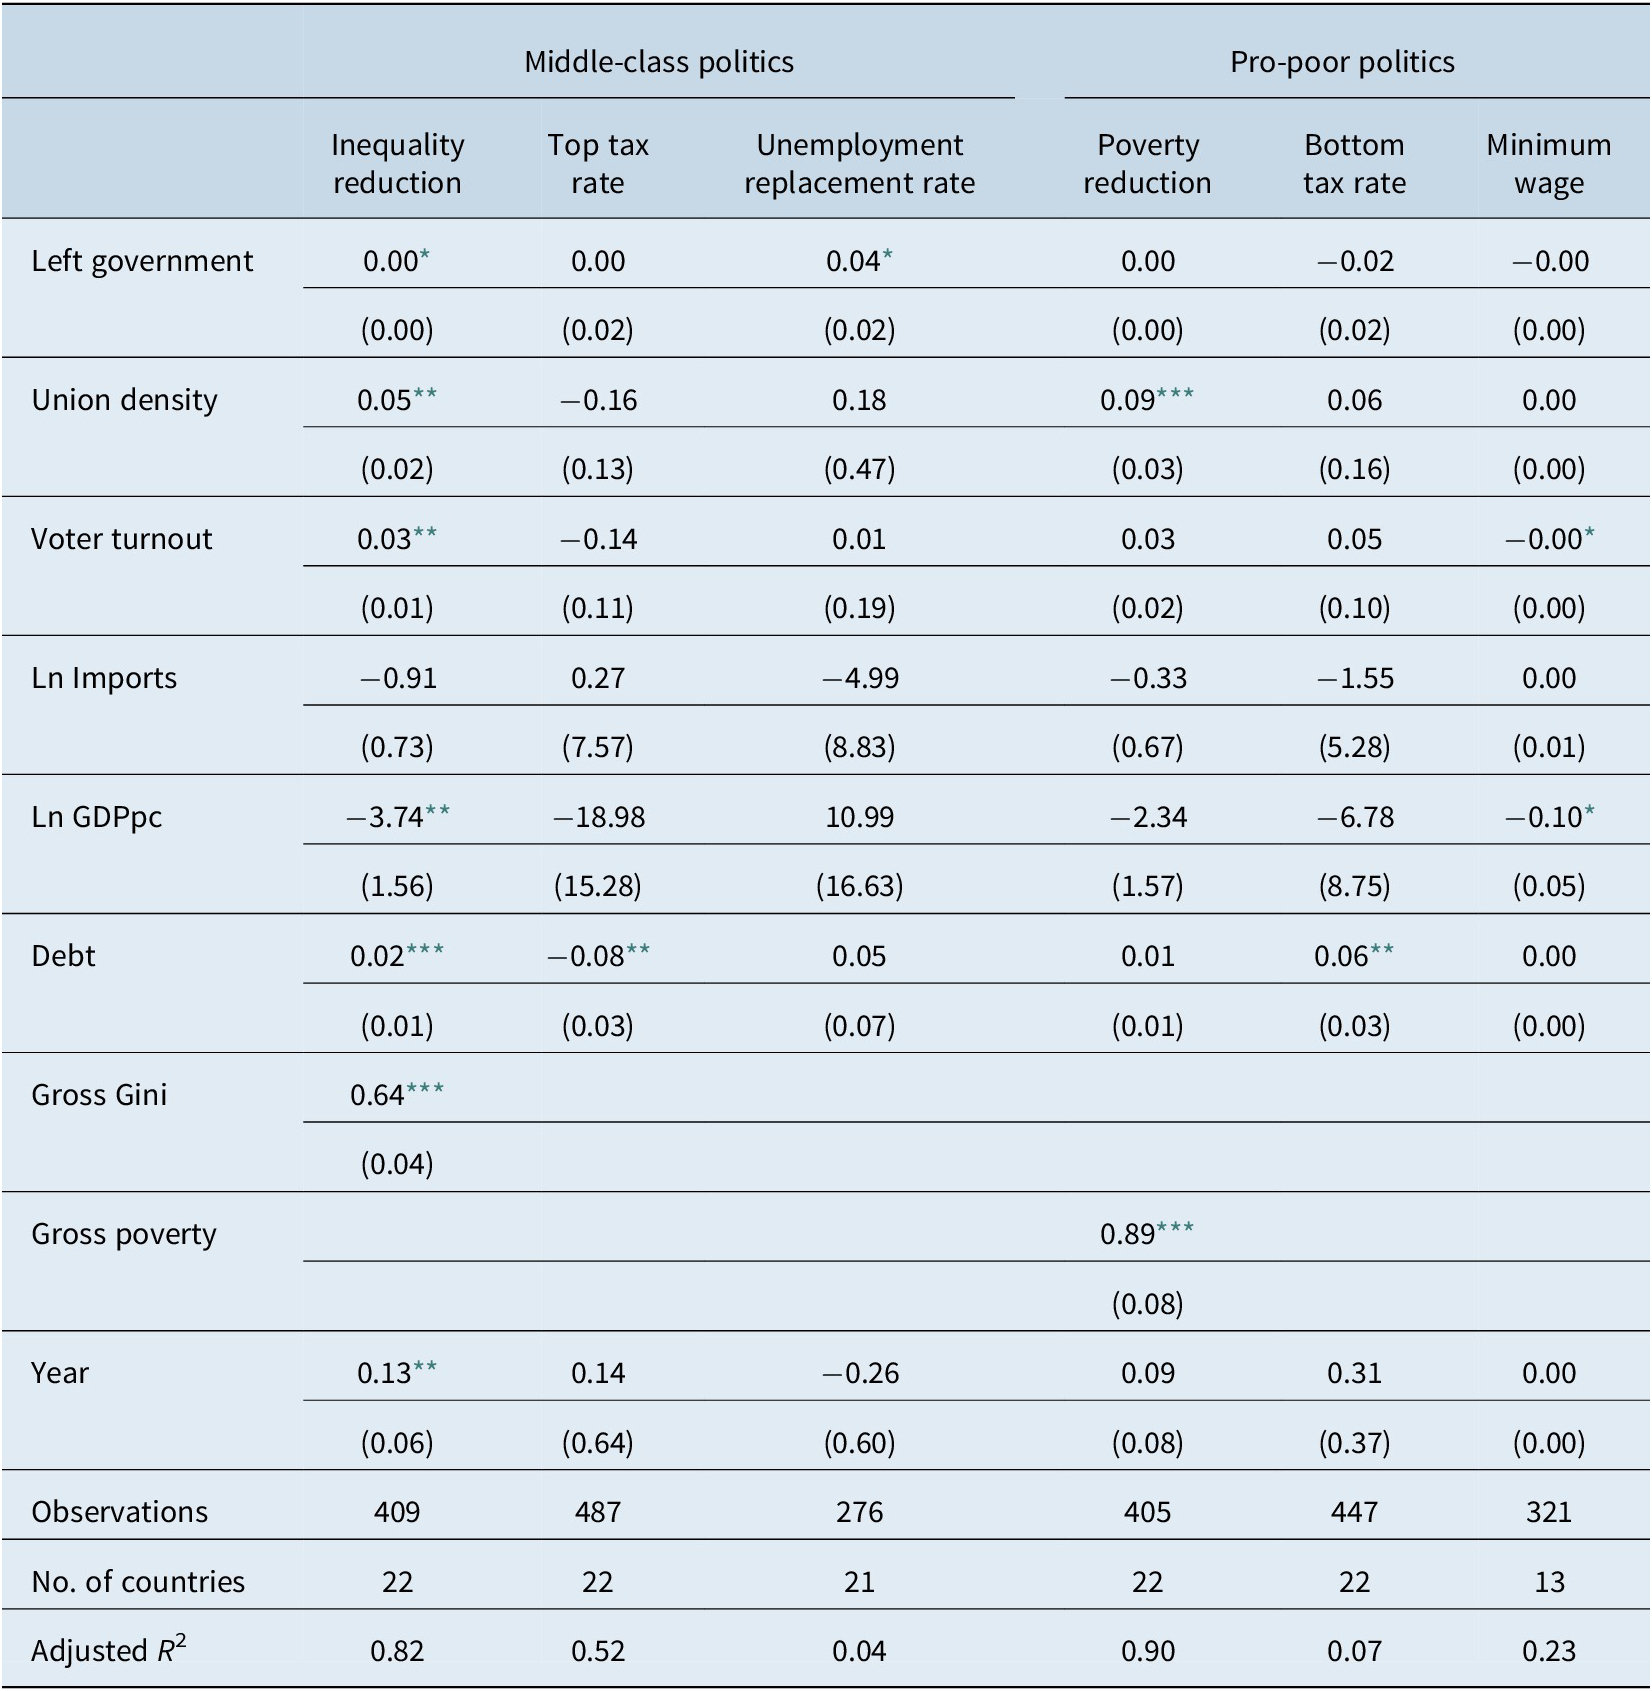
To test for the robustness of our results, we run several checks (see Appendix for regression models and interaction figures). First, we exclude all control variables from the model with the exception of time trends and gross inequality/poverty measures (Table A1). The results hold and the effect of left government on the bottom tax rate becomes borderline significant, indicating that left parties might differ from their conservative counterparts by lowering bottom tax rates. We also include only a linear time trend (Table A5) and run the model without fixed effects (Table A4). The substantive effects for remain the same. Second, we include different measures of left government. We include the average of the last three years instead of just one (Table A2) and use the share of left government seats rather than their cabinet share (Table A2). The results do not change substantively. We also add the average of the last 10 years to allow for a cumulative effect. While the current effects do not change, the long-term averages show no significant influence (Table A3) In a third step, we split the sample into an earlier (until 1999) and later (from 2000) sample to see if the effects are stable over time. Interestingly, and in line with earlier findings, the effect of Left power varies over time (Table A3). While unions seem to matter most in the earlier period, left parties seem matter more in the latter. Given the downwards trend in union membership, this is not too surprising, but also not good news for advocates of redistribution and poverty alleviation. Here, the effect of left partisanship is more promising. Whereas the original partisanship thesis was developed in the “Golden Age” of the welfare state, the diffusion of neoliberal ideas saw left parties advocate less state intervention and more market-friendly (and hence often not redistributive or pro-poor) policies. The turn towards “New Labour” represented by Tony Blair exemplifies this ideological change (King & Ross, 2010). Yet, there is increasing evidence that this has changed again with the financial crisis (Iversen & Soskice, Reference Iversen and Soskice2015; Limberg, Reference Limberg2019) and also our results point in this direction.
In a last step, we further test two potential conditioning effects, namely that globalisation and turnout affect the Left differently from the Right (Tables A4 and A5). We find no evidence that openness has a conditional effect on left governments or unions (Table A5) not even for unemployment replacement rates, but see some slight effects for turnout on left parties as indicated by the literature (Verba et al., Reference Verba, Nie and Kim1978). Interestingly, they do not go in the same direction. Whereas higher turnout leads left parties to raise unemployment replacement rates, it actually turns the general redistribution effect insignificant. This might indicate two things: first, whereas unemployment replacement rates are important for the middle classes, they are an important electoral indicator also for the poor and lower middle classes supporting the electoral importance hypothesis. Second, higher turnout matters also for more conservative or centric parties as it shifts the median voter downwards and hence turns redistribution (but not poverty reduction) more important for elections in general.
Concluding remarks
Throughout advanced democratic societies, poverty rates have gone up since the 1980s with relative poverty reaching new highs in the aftermaths of the financial crisis in 2012. Although there has been a slight decline since then, the EU remains far from its 2020 target of reducing the risk of poverty for 20 million people (European Commission, 2019). Moreover, the current COVID-19 crisis is likely to have similar effects as the previous financial crises in 2008 and to reinforce existing inequalities. People in poverty or the risk of poverty have less of a safety net, face more precarious working conditions, and hence, they are also more vulnerable to the busts and booms of the economy. Certainly, poverty in rich democratic societies is not comparable to the kind of absolute poverty found in other regions of the world. Yet, also in wealthy countries, we can see people sleeping on the streets, unable to afford medicines or to pay rent, children whose parents cannot afford enough (healthy) food, and elderly people who struggle to keep their homes warm during the winter. In fact, in Europe, over 20 per cent of the population is at risk of poverty, with the young, the old, single-parent households and the unemployed being particularly threatened (European Commission, 2020). Although rich democracies employ policy measures to fight poverty, it has not been sufficient resources to reverse the trend.
In this article, we explored to what extent democratic governments, particularly the Left is increasingly unable or unwilling to address the needs and interests by those left behind. Although labour parties and trade unions are key actors representing the interest of the working class, domestic and international socio-economic changes have occurred, which make it uncertain whether the Left still conducts more redistributive policies, especially when it comes to poverty alleviation. Both, the turn towards the knowledge economy and the rise of economic globalisation might have significantly altered the role of the Left increasingly focusing on pro-middle-class politics rather than pro-poor politics.
Based on data for 23 OECD countries, we show that although net poverty has increased, poverty alleviation has also gone up as an attempt to offset the even more drastic rise of market poverty. Moreover, labour organisation is still critical not only for redistribution but also for poverty alleviation. Particularly the strength and the political involvement of trade unions have a positive and significant influence on redistribution in general and poverty alleviation in specific. The good news is therefore that the poor are not left alone. In fact, redistribution to the poor has constantly increased over the last three decades. The bad news is, however, that in most countries it has not been sufficient to compensate for the rise in net poverty. Moreover, although trade unions seem to have a positive influence on poverty alleviation, membership has been on drastic decline and there is an indication that also left-wing parties are increasingly leaving the poor behind. After all, the empirical results only showed a positive influence of labour parties on redistribution, which is targeted more broadly towards the middle class and less specifically towards the poor.
Finally, we found that the role of the Left is generally less pronounced for policy measures in comparison to our two outcome indicators. While this leaves blurry the exact processes of governmental redistribution, it suggests that key differences exist with regards to the means and instruments of advanced welfare states to address economic inequalities and the multipillared and complex nature of poverty. This is in line with the research on social policy by other means (Castles, Reference Castles1985; Van Kersbergen & Hemerijck, Reference Van Kersbergen and Hemerijck2012) and the literature on welfare capitalism (Castles, Reference Castles1993; Esping-Andersen, Reference Esping-Andersen1990; Hall and Soskice, Reference Hall and Soskice2001), which show that governments employ different means to achieve redistributive outcomes. It also largely explains why the literature has produced divergent empirical findings on the role of the Left, which might very well stem from the different dependent variables that authors have focused upon. Finding better analytical reasons and sound empirical tools for understanding the politics of poverty alleviation and redistribution seems like a promising path ahead for future research.
Disclosure statement
The authors declare that they have no relevant or material financial interests that relate to the research described in this paper.
Notes on contributors
Hanna Lierse worked as a senior researcher at the Research Centre for Inequality and Social Policy of the University Bremen and at the Faculty for Sustainability of the Leuphana University Lueneburg. Currently she is working as Coordinator for Social Sustainability in a local German government. Her research interests are redistrbution, wealth taxation and the nexus between climate policies and inequality.
Laura Seelkopf is a professor of international comparative public policy at the Geschwister-Scholl-Institute for Political Science, LMU Munich. Her research interests lie at the intersection of international political economy, comparative politics, and public policy with a focus on two main topics: taxation and social policy.
A. Appendix
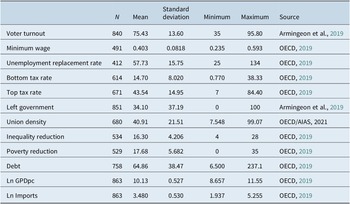
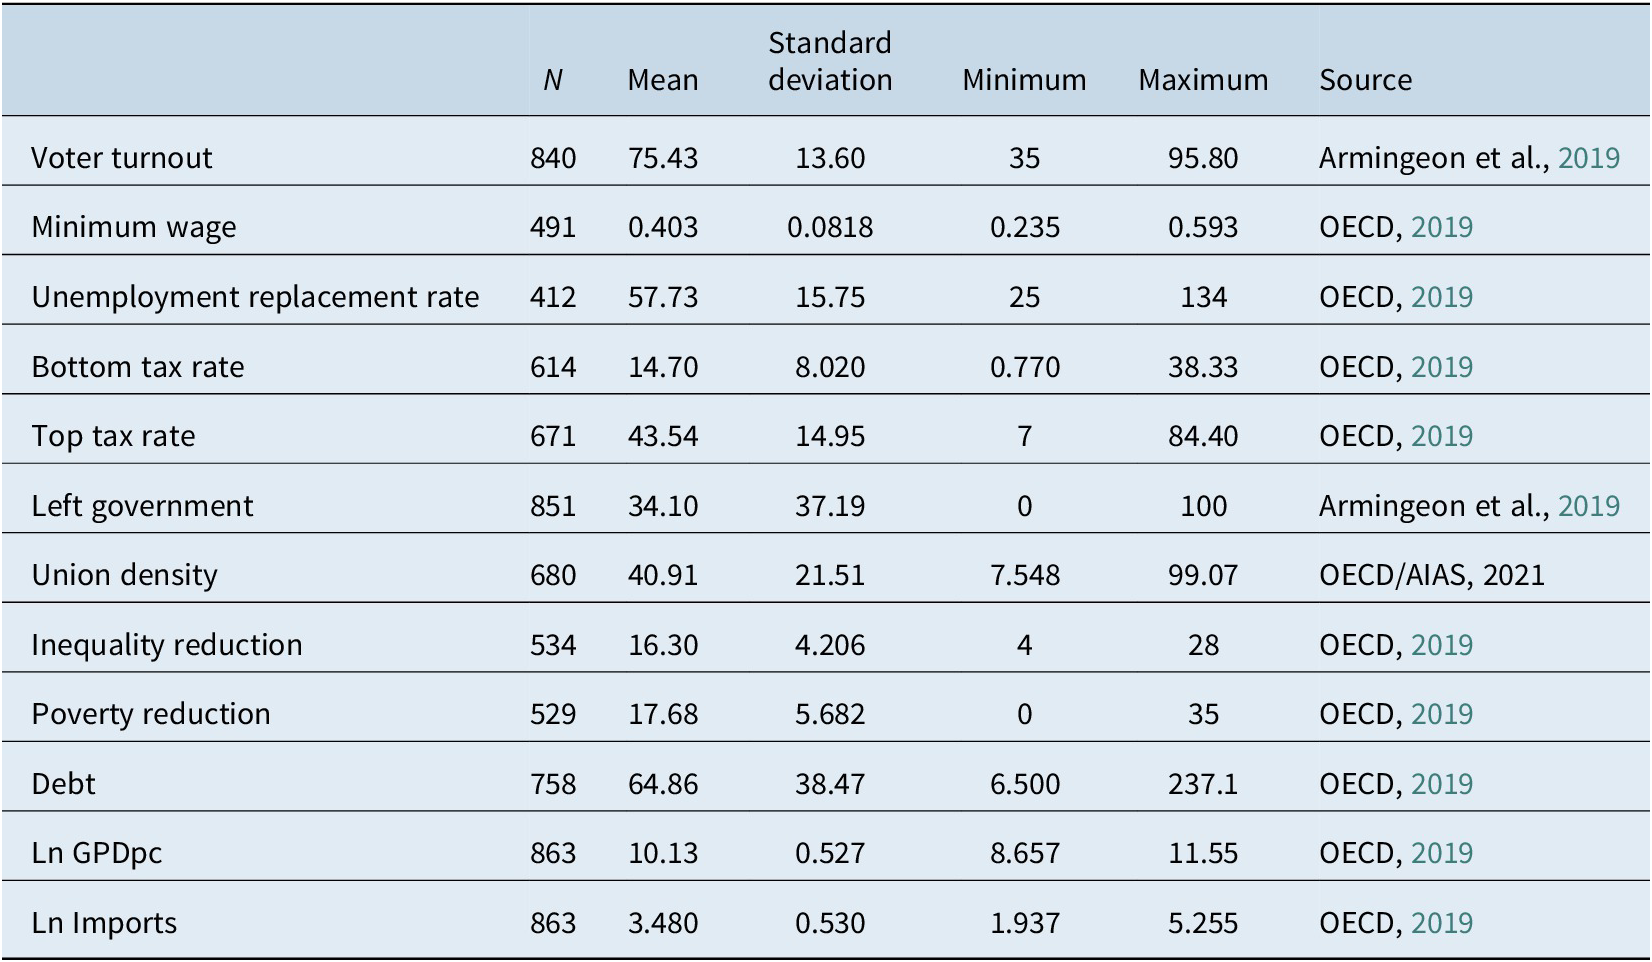
Descriptive statistics.
A.1 Robustness checks
Estimation results with left government share as averages for last 3 years.

Note. Robust standard errors are in parentheses.
Estimation results with left government and left government share as averages for last 10 years.

Note. Robust standard errors are in parentheses.
Estimation results without fixed effects.
Note. Robust standard errors are in parentheses.
Estimation results with linear time trend.
Note. Robust standard errors are in parentheses.