Structure of transition-metal dichalcogenides
Atomically thin transition-metal dichalcogenides (TMDCs) provide a wide range of unique electrical, optical, and thermal properties that do not exist in their bulk counterparts (see the Introductory article in this issue of MRS Bulletin).Reference Chhowalla, Shin, Eda, Li, Loh and Zhang1,Reference Huang, Zeng and Zhang2 Monolayer molybdenum disulfide (MoS2),Reference Ganatra and Zhang3 one of the most important and frequently studied TMDCs, exhibits good chemical stability and mechanical flexibility. Meanwhile, its semiconducting nature provides a high ON/OFF current ratio in transistors, and TMDC monolayers (MoS2, WS2, MoSe2, and WSe2) with a direct bandgap give strong bandgap emission.Reference Radisavljevic, Radenovic, Brivio, Giacometti and Kis4–Reference Bertolazzi, Krasnozhon and Kis6 With large carrier mobility and good mechanical properties, two-dimensional (2D) TMDCs are considered as promising candidates for wearable and flexible systems.Reference Radisavljevic, Radenovic, Brivio, Giacometti and Kis4,Reference Wang, Yu, Lee, Shi, Hsu, Chin, Li, Dubey, Kong and Palacios7
Other TMDC materials, such as molybdenum diselenide (MoSe2), tungsten disulfide (WS2), and tungsten diselenide (WSe2), have also attracted much recent attention.Reference Ji, Zhang, Zhang and Liu8,Reference Shi, Li and Li9 Being an inorganic graphite analogue, all TMDCs share a similar material structure. Each TMDC layer has a sandwich structure formed by hexagonally packed transition-metal atoms located between two layers of chalcogen atoms. Similar to graphite, a weak van der Waals (vdW) force holds each TMDC layer together; thus, the bulk crystal can be exfoliated along the 2D surface.
Three main polytypes
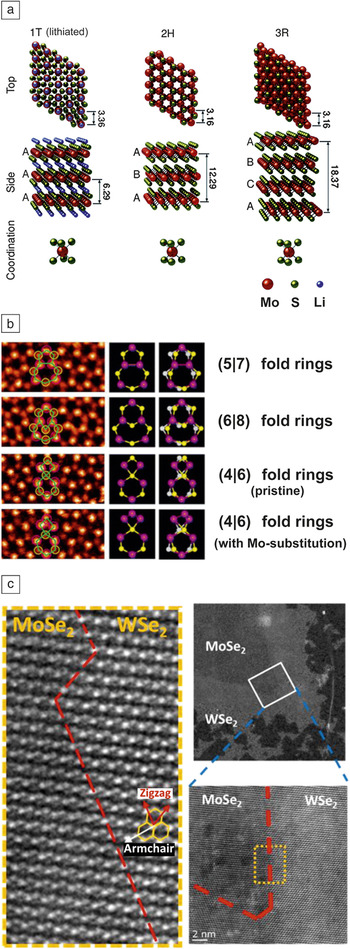
In a TMDC monolayer, the transition-metal and chalcogen atoms form strong covalent bonds, giving rise to several stacking polytypes and polymorphs. The commonly found structural polytypes of TMDC are 1T, 2H, and 3R, which refer to one (1), two (2), and three (3) layers per unit cell stacking in the tetragonal (T), hexagonal (H), and rhombohedral (R) symmetry, respectively. Considering MoS2 as an example, all three polytypes of MoS2 have regular layered structures with six-fold trigonal prismatic coordination of transition-metal atoms (Mo) surrounded by chalcogen atoms (S).Reference Stephenson, Li, Olsen and Mitlin10 One tetragonal-MoS2 is a metastable metallic phase, while 2H-MoS2 and 3R-MoS2 are thermodynamically stable phases that can be found in nature. One tetragonal- and 2H-MoS2 differ only by a transversal displacement of one of the two sulfur planes. As shown in Figure 1a, it has been suggested that lithium-ion intercalation results in the 2H to 1T phase transformation.Reference Eda, Yamaguchi, Voiry, Fujita, Chen and Chhowalla11 Since the 1T structure is typically unstable, a 1T'′ structure can also form by a spontaneous lattice distortion.Reference Eda, Fujita, Yamaguchi, Voiry, Chen and Chhowalla12,Reference Qian, Liu, Fu and Li13 On the other hand, the incorporation of impurity elements, such as Re and Nb in the MoS2 layers, leads to a partial substitution of the Mo atoms and results in more stable 3R packing.
Structure of transition-metal dichalcogenides (TMDCs). (a) Three main structural polytypes identified as one tetragonal (1T)-MoS2, two hexagonal (2H)-MoS2, and three rhombohedral (3R)-MoS2. (b) Scanning tunneling microscopy images showing the structure with (5|7) fold rings and new core structures with (4|4), (4|6), (4|8), and (6|8) fold rings. The yellow white and purple spheres represent top and bottom S and Mo, respectively. (c) High resolution high-angle annular dark-field scanning transmission electron microscopy image of MoSe2/WSe2 heterostructures. The image in the yellow dotted box is a close-up of the region highlighted on the right. (left) The close-up shows the in-plane lateral heteroepitaxial growth of the TMDC materials results in well-defined lateral heterostructures of MoSe2/WSe2 with an atomically abrupt lateral interface, as indicated by the red dashed line in the left micrograph. (a) Reproduced with permission from Reference 10. © 2014 Royal Society of Chemistry. (b) Reproduced with permission from Reference 17. © 2013 American Chemical Society. (c) Reproduced with permission from Reference 21. © 2014 American Chemical Society.

Interfacing and quantum confinement in 2D materials
Because of a large aspect ratio, the interfacing and quantum confinement in 2D materials are commonly intertwined and thus, determine their electronic and/or optical properties.Reference Lee, Yan, Brus, Heinz, Hone and Ryu14 Both computational and experimental results have confirmed that the coupling between electronic transitions and phonons are significantly improved when MoS2 is scaled down from three-dimensional to 2D geometry. For example, bulk MoS2 is an indirect bandgap semiconductor with very weak photoluminescence (PL).Reference Splendiani, Sun, Zhang, Li, Kim, Chim, Galli and Wang15 Surprisingly, when the MoS2 layers are thinned down to just a few or to a monolayer thickness, the PL becomes significant.Reference Splendiani, Sun, Zhang, Li, Kim, Chim, Galli and Wang15 The striking contrast in PL emission between bulk and monolayer MoS2 originally arises from the quantum confinement in layered d-electron materials, where the characteristics of the d-electron orbitals comprise the conduction and valence bands. Therefore, the emergence of strong PL in monolayer TMDCs and indirect to direct bandgap conversion have also been observed in other layered TMDCs such as MoSe2, WS2, and WSe2.Reference Huang, Zeng and Zhang2,Reference Ji, Zhang, Zhang and Liu8,Reference Shi, Li and Li9
Grain boundary and edge reconstruction
The mechanical, electronic, optical, and chemical properties of TMDC materials strongly depend on their structure. Intrinsic point defects, dislocations, grain boundaries, and type of edges in TMDC layers have been experimentally identified.Reference Ly, Chiu, Li, Zhao, Perello, Cichocka, Oh, Chae, Jeong, Yao, Li and Lee16–Reference Najmaei, Liu, Zhou, Zou, Shi, Lei, Yakobson, Idrobo, Ajayan and Lou19 MoS2 growth has been shown to follow a layer-plus-island (or Stranski–Krastanov) growth mode,Reference Ji, Zhang, Zhang and Liu8,Reference Ji, Zhang, Gao, Zhang, Ma, Liu, Chen, Qiao, Tan, Kan, Feng, Sun and Liu20 where monolayer MoS2 domains initially gather and interconnect with each other until the full coverage of the monolayer is complete.Reference Ji, Zhang, Gao, Zhang, Ma, Liu, Chen, Qiao, Tan, Kan, Feng, Sun and Liu20 Najmaei et al. have demonstrated that coalescence of TMDC grains leads to the formation of grain boundaries with arrays of dislocations of pristine and sulfur-substituted (5|7) fold rings,Reference Najmaei, Liu, Zhou, Zou, Shi, Lei, Yakobson, Idrobo, Ajayan and Lou19 where (5|7) means that dislocations consist of 5 and 7 atom ring structures folded together. Furthermore, a rich variety of point defects and dislocation cores have been identified in MoS2 layers using aberration-corrected scanning transmission electron microscope (STEM). Figure 1b shows the core structures of (5|7), (6|8), and (4|6), and other core structures such as (4|6) and (4|8) fold rings, which have also been identified by Zhou et al.Reference Zhou, Zou, Najmaei, Liu, Shi, Kong, Lou, Ajayan, Yakobson and Idrobo17
Monolayer MoS2 has a direct bandgap with strong PL. PL mapping can also be used to distinguish the grain boundary from pristine TMDC regions. Since the reconstruction of atoms along the grain boundaries may generate new states near the Fermi level, a locally modified PL emission around the junction of different grains is typically observed. Van der Zande et al. used PL mapping to image the grain boundaries of polycrystalline TMDC monolayers.Reference van der Zande, Huang, Chenet, Berkelbach, You, Lee, Heinz, Reichman, Muller and Hone18 Significant differences in PL intensity and peak shift have also been observed from polycrystalline MoS2 with mirror symmetric and faceted tilt grain boundaries. The mirror boundary shows an 8 meV upshift in peak energy and a decrease in peak intensity, while the tilted boundary shows enhanced PL emission and a 26 meV upshift in peak energy.Reference van der Zande, Huang, Chenet, Berkelbach, You, Lee, Heinz, Reichman, Muller and Hone18
Additionally, TMDC materials can also form in-plane heterostructures, which lead to interesting edge reconstruction of atoms along the TMDC heterojunctions. As shown in Figure 1c, in-plane lateral heteroepitaxial growth of TMDCs has recently been realized. Well-defined lateral WS2/MoS2 heterostructures were synthesized via chemical vapor deposition (CVD) and further demonstrated the ability to form an intrinsic monolayer p–n junction.Reference Zhang, Lin, Tseng, Huang and Lee21 Gong et al. have fabricated an atomically abrupt lateral interface between MoS2 and WS2 with atomic precision.Reference Gong, Lin, Wang, Shi, Lei, Lin, Zou, Ye, Vajtai, Yakobson, Terrones, Terrones, Tay, Lou, Pantelides, Liu, Zhou and Ajayan22 An atomically coherent lateral interface between WS2 and MoS2 appears as a straight line and preferentially along the zigzag direction, with occasionally observed lateral junctions along the armchair direction. Transition-metal elements are found to diffuse over a width of 1–3 unit cells around the armchair interfaces, which is likely due to the relatively low stability of armchair edges during epitaxial growth.
Duane et al. has also reported nearly coherent heterostructure between WS2 and WSe2.Reference Duan, Wang, Shaw, Cheng, Chen, Li, Wu, Tang, Zhang, Pan, Jiang, Yu, Huang and Duan23 However, energy dispersive x-ray spectroscopy line scan profiles suggest there is no atomically abrupt junction formation, and the WS2 to WSe2 phase transition typically exists over a length range of ∼35 nm. This gradual interface was attributed to the slow switching of vapor-phase reactants during growth. Zhang et al. have also demonstrated direct synthesis of lateral MoS2/WS2 and MoSe2/WSe2 heterostructures.Reference Zhang, Lin, Tseng, Huang and Lee21 Atomic-resolution STEM has revealed that the lateral heterostructure picks the zigzag direction of the lattice instead of the armchair direction. Note that an abrupt heterojunction may present interesting interlayer excitonic features and distinct p–n junction properties.
Chemical exfoliation of TMDCs
The mechanical cleavage technique, first used to produce graphene in 2004,Reference Novoselov, Geim, Morozov, Jiang, Zhang, Dubonos, Grigorieva and Firsov24 is the typical exfoliation method to prepare monolayers and multilayers from their bulk crystals.Reference Novoselov, Jiang, Schedin, Booth, Khotkevich, Morozov and Geim25–Reference Coleman, Lotya, O’Neill, Bergin, King, Khan, Young, Gaucher, De, Smith, Shvets, Arora, Stanton, Kim, Lee, Kim, Duesberg, Hallam, Boland, Wang, Donegan, Grunlan, Moriarty, Shmeliov, Nicholls, Perkins, Grieveson, Theuwissen, McComb, Nellist and Nicolosi29 Although pristine, large-size, single-layer TMDC nanosheets can be obtained by mechanical cleavage, its low throughput has limited practical applications. Alternatively, chemical exfoliation has been developed to realize high-yield and large-scale production of TMDC nanosheets in solution phase. In this section, we focus on various kinds of chemical exfoliation approaches for TMDC nanosheets, with an emphasis on the advantages and disadvantages of each method.
Direct sonication in common solvents or polymer aqueous solutions
As a typical example, Coleman and co-workers demonstrated that bulk TMDC crystals can be effectively exfoliated by direct sonication in common solvents (e.g., N-methyl-pyrrolidone [NMP] and dimethylformamide [DMF]).Reference Coleman, Lotya, O’Neill, Bergin, King, Khan, Young, Gaucher, De, Smith, Shvets, Arora, Stanton, Kim, Lee, Kim, Duesberg, Hallam, Boland, Wang, Donegan, Grunlan, Moriarty, Shmeliov, Nicholls, Perkins, Grieveson, Theuwissen, McComb, Nellist and Nicolosi29 A number of single or a few-layer TMDC nanosheets, such as MoS2, WS2, MoSe2, NbSe2, TaSe2, NiTe2, and MoTe2, were prepared from their bulk crystals using this method. Both theoretical calculation and experimental results revealed that the degree to which the surface energies match between the solvent and the layered crystal can be used to minimize the enthalpy of exfoliation and is a key factor for achieving effective exfoliation. For example, in the case of exfoliation of MoS2, NMP is the most effective solvent whose surface tension matches well with the surface energy of MoS2.
Typically, solvents with surface tensions close to 40 mJ/m2 are required to exfoliate most layered compounds.Reference Coleman, Lotya, O’Neill, Bergin, King, Khan, Young, Gaucher, De, Smith, Shvets, Arora, Stanton, Kim, Lee, Kim, Duesberg, Hallam, Boland, Wang, Donegan, Grunlan, Moriarty, Shmeliov, Nicholls, Perkins, Grieveson, Theuwissen, McComb, Nellist and Nicolosi29–Reference Nicolosi, Chhowalla, Kanatzidis, Strano and Coleman32 Unfortunately, it was found that water, the most commonly used solvent, has a surface tension of 72 mJ/m2, which is not suitable for exfoliation of TMDC sheets. Intriguingly, Zhang and co-workers reported that a water–ethanol mixture is suitable to exfoliate and disperse 2D TMDC nanosheets by sonication, although individually, neither water nor ethanol has proved to be a suitable solvent for the exfoliation of TMDC crystals.Reference Zhou, Mao, Wang, Peng and Zhang30 This obvious difference is attributed to the change in solubility parameters upon mixing of the solvents. This method is convenient, economical, and potentially scalable since water and ethanol are commonly used solvents.
Coleman and co-workers also reported on the exfoliation of TMDC crystals by sonication in a polymer aqueous solution.Reference Smith, King, Lotya, Wirtz, Khan, De, O’Neill, Duesberg, Grunlan, Moriarty, Chen, Wang, Minett, Nicolosi and Coleman31 They found that a number of layered crystals can be exfoliated in water in the presence of a polymer, resulting in well-dispersed TMDC nanosheets coated with the polymer. Large-scale production of 2D TMDC nanosheets can be achieved by direct exfoliation or polymer-assisted methods.Reference Nicolosi, Chhowalla, Kanatzidis, Strano and Coleman32 Due to limitations of the sonication process, however, the yield of single-layer sheets produced by these methods is relatively low, and the lateral size of the sheets is relatively small and non-uniform (from several nm to several hundred µm range).Reference Nicolosi, Chhowalla, Kanatzidis, Strano and Coleman32 Moreover, the polymers coated on the TMDC nanosheets are undesirable for some applications.Reference Smith, King, Lotya, Wirtz, Khan, De, O’Neill, Duesberg, Grunlan, Moriarty, Chen, Wang, Minett, Nicolosi and Coleman31
Ion intercalation and exfoliation
The intercalation of layered TMDC crystals with n-butyllithium in hexane followed by exfoliation in water via sonication was developed in the 1970s to produce single-layer TMDC nanosheets.Reference Joensen, Frindt and Morrison33–Reference Ramakrishna Matte, Gomathi, Manna, Late, Datta, Pati and Rao36 In this process, the lithium (Li) ions were intercalated into the layered spacing, and they reacted with the TMDC crystals to form Li-intercalated compounds (e.g., for MoS2, the compound is LixMoS2, where x is the number of Li atoms).Reference Joensen, Frindt and Morrison33,Reference Dines34 The Li-intercalated compounds were then sonicated in water or ethanol to obtain well-dispersed single-layer sheets.
Note that the H2 gas generated from the reaction between lithium and water (or ethanol) also helps to further push the stacked TMDC layers apart. Based on this method, a range of well-dispersed TMDC monolayers, such as MoS2, WS2, and TiS2, have been prepared in high-yield and large amounts. It is worth pointing out that the yield of single layers obtained by this method is much higher than that using the direct sonication or sonication in polymer aqueous solution. A unique advantage of this method is the phase transformation from the 2H to the 1T phase of some TMDC nanosheets (e.g., MoS2 and WS2) during the interaction process. This offers great opportunities to realize superior performance for specific applications (e.g., electrocatalysis and transistors) via phase engineering.Reference Voiry, Yamaguchi, Li, Silva, Alves, Fujita, Chen, Asefa, Shenoy, Eda and Chhowalla37,Reference Kappera, Voiry, Yalcin, Branch, Gupta, Mohite and Chhowalla38
Recently, Loh and co-workers reported a modified method to produce TMDC sheets with large size. First, bulk TMDC crystals were expanded with hydrazine (N2H4) by the hydrothermal method.Reference Zheng, Zhang, Dong, Liu, Nai, Shin, Jeong, Liu and Loh84 Sodium naphthalenide rather than n-butyllithium was used as the intercalation agent. By using their method, a variety of TMDC sheets, such as MoS2, TiS2, TaS2, and WS2, with lateral sizes up to tens of micrometers, were obtained. However, the intercalation process needs high temperatures (e.g., 100°C) and long reaction times (e.g., three days). Moreover, uncontrollable lithium/sodium intercalation leads to incomplete lithium intercalation or over-insertion of lithium, resulting in either a low yield of single layers or decomposition of TMDC nanosheets into metal nanoparticles and Li2S.
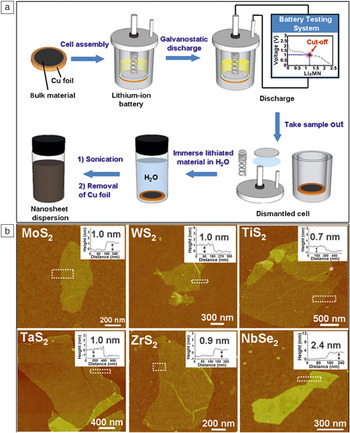
Recently, Zhang developed an electrochemical Li-intercalation and exfoliation method to produce various TMDC nanosheets (Figure 2a), including MoS2, WS2, TiS2, TaS2, ZrS2, and NbSe2.Reference Zeng, Yin, Huang, Li, He, Lu, Boey and Zhang39–Reference Zeng, Tan, Huang, Bao and Zhang41 The layered bulk crystals were integrated in a Li-ion battery cell as the cathode, and a lithium foil was used as an anode. The Li interaction process was conducted during the discharge process. Based on this method, a series of single or few-layer TMDC nanosheets, such as MoS2, TiS2, TaS2, and WS2 (Figure 2b), could be prepared with high yield and at a large scale, in which the yield of single-layer MoS2 and TaS2 sheets reached over 90%. In contrast to intercalation with organometallic compounds, this electrochemical Li-intercalation method can be easily carried out at room temperature in less than six hours. Importantly, the Li-intercalation process could be well controlled by monitoring the discharge curve to avoid insufficient Li intercalation or over Li insertion.
Chemical exfoliation of transition-metal dichalcogenides (TMDCs). (a) Schematic illustration of the electrochemical Li-intercalation and exfoliation process for synthesis of single- or few-layer TMDC nanosheets. First, bulk layered materials were coated on a Cu foil and used as the cathode; lithium foil was used as the anode. The electrochemical lithium intercalation was performed, and finally the lithium-intercalated material on Cu foil was sonicated in water to obtain the nanosheet dispersion. (b) Atomic force microscopy images of the TMDC nanosheets deposited on SiO2 substrates and the corresponding height profiles at the indicated edge sites (white dotted boxes). (a) Reproduced with permission from Reference 39. © 2011 Wiley. (b) Reproduced with permission from Reference 40. © 2012 Wiley.

Vapor phase deposition of TMDCs
The synthesis of uniform and large-area TMDC layers is an essential requirement for their practical application in electronic and optical devices.Reference Ji, Zhang, Zhang and Liu8,Reference Shi, Li and Li9 Vapor phase deposition, a bottom-up synthesis strategy, provides a synthetic route that can be employed to obtain monolayer TMDCs, heterostructure alloys, and multilayer stackings. It shows great promise to generate high-quality TMDC layers with scalable size, controllable thickness, and excellent electronic properties.
Vapor phase reaction for monolayer TMDC growth
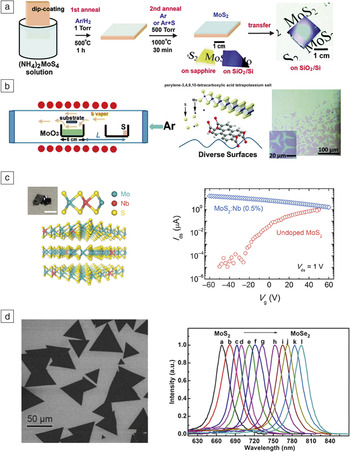
As shown in Figure 3, there have been attempts to produce TMDC layers via sulfurization of a transition-metal or metal oxide thin film, thermal decomposition of thiosalts,Reference Liu, Zhang, Lee, Lin, Chang, Su, Chang, Li, Shi and Zhang42 and vapor phase transport of TMDC powders.Reference Shi, Li and Li9 However, it remains a challenge to obtain a high-quality TMDC with a desired number of layers, since the thickness of the precursor coating or the amount of reactant needs to be precisely controlled. Li et al. have reported a strategy for growing large-area atomically thin MoS2 layers via chemical vapor reaction of MoO3 and sulfur powder (Figure 3b).Reference Lee, Zhang, Zhang, Chang, Lin, Chang, Yu, Wang, Chang, Li and Lin43 During TMDC growth, the transition-metal oxide in the vapor phase undergoes a two-step reaction, where a suboxide compound likely forms during the reaction, which serves as an intermediate that diffuses to the substrate and further reacts with sulfur vapors to grow TMDC layers.
Synthesis of transition-metal dichalcogenide monolayer and substitutional doping. (a) MoS2 growth via thermal decomposition of thiosalts. Precursor (NH4)2MoS4 was dip-coated onto SiO2/Si or sapphire substrates followed by the two-step annealing process. The as-grown MoS2 film can be transferred onto other arbitrary substrates. (b) Schematic of the strategy for growing large-area atomically thin MoS2 layers via chemical vapor reaction of MoO3 and sulfur powder. MoO3 evaporates at the growth temperature and reacts with sulfur vapor to form monolayer MoS2 on the substrate. (c) Lattice structure illustration for substitutional Nb doping of MoS2 and charge-transport behavior comparison between Nb doped and pristine MoS2. A digital photograph (inset) shows the synthesized crystal (scale bar = 3 mm). The I-V measurement (right) shows the gate voltage (V g) dependence of the channel current of undoped MoS2 and Nb-doped multilayer MoS2. The Nb-doped multilayer MoS2 exhibits p-type conduction with much weaker gate voltage dependence and much higher ON-current compared to monolayer MoS2. (d) Typical scanning electron microscopy morphology (left) and photoluminescence spectrum (right) of the obtained ternary MoS2xSe2(1–x) nanosheets. Note: I ds, drain current; V ds, drain voltage; L, distance between MoO3 and S powder. (a) Reproduced with permission from Reference 42. © 2012 American Chemical Society. (b) Reproduced with permission from Reference 43. © 2012 Wiley. (c) Reproduced with permission from Reference 52. © 2014 American Chemical Society. (d) Reproduced with permission from Reference 53. © 2014 American Chemical Society.

It is anticipated that the surface energy control of the growth substrate is critical for the nucleation and crystallization of TMDC layers.Reference Lee, Zhang, Zhang, Chang, Lin, Chang, Yu, Wang, Chang, Li and Lin43,Reference Ling, Lee, Lin, Fang, Yu, Dresselhaus and Kong44 The presence of aromatic molecules has been shown to provide better wetting between precursors and the substrate surface to promote TMDC nucleation.Reference Ling, Lee, Lin, Fang, Yu, Dresselhaus and Kong44 Van der Zande et al. have reported a refined chemical vapor reaction route for ultra-large MoS2 synthesis.Reference van der Zande, Huang, Chenet, Berkelbach, You, Lee, Heinz, Reichman, Muller and Hone18 The growth of the TMDC layer was found to be sensitive to the properties of the substrate surfaces. By using clean substrates and fresh precursors, ultra-large MoS2 crystalline islands with an average size between 20 μm and 100 μm were obtained. Najmaei et al. found MoS2 crystals with triangular shapes commonly nucleate and form on the step edges.Reference Najmaei, Liu, Zhou, Zou, Shi, Lei, Yakobson, Idrobo, Ajayan and Lou19 Therefore, it is possible to control the growth location of MoS2 layers by patterning the substrates using conventional lithography processes. The patterns on the growth substrate can significantly reduce the nucleation energy barrier of MoS2, thus realizing the synthesis of TMDC layers at predefined locations. Eichfeld et al. have demonstrated a highly scalable synthesis approach of large-area WSe2 (yielding >8 µm size domains) via metal–organic CVD (MOCVD) using tungsten hexacarbonyl (W(CO)6) and dimethylselenium ((CH3)2Se) as growth precursors.Reference Eichfeld, Hossain, Lin, Piasecki, Kupp, Birdwell, Burke, Lu, Peng, Li, Azcatl, McDonnell, Wallace, Kim, Mayer, Redwing and Robinson45 The MOCVD method allows for excellent control over the process conditions, which is critical for large-scale, high-quality TMDC production.
The direct vapor phase reaction of transition-metal oxide and sulfur/selenium has been widely applied by many research groups to produce TMDC layers such as MoS2, WS2, MoSe2, and WSe2.Reference Ji, Zhang, Zhang and Liu8,Reference Shi, Li and Li9 The vapor phase reaction method allows the growth of single-crystalline TMDC flakes directly on arbitrary substrates without the need for an additional transfer process for electronic device fabrication. It has become a widely adopted approach for producing TMDC monolayers for electrical property studies.
Substitutional doping of TMDC layers for bipolar transport
Both n- and p-type TMDC-based field-effect transistors are required in order to integrate them in low-power consumption, high-performance, complementary logic circuits. Meanwhile, bipolar carrier conduction is also essential for TMDC-based optoelectronic devices, such as light-emitting diodes and photodetectors, which require electron–hole pair generation and recombination. MoS2 has been widely accepted as an n-type semiconductor due to omnipresent sulfur vacancies.Reference McDonnell, Addou, Buie, Wallace and Hinkle46
Although p-type doping for TMDCs can be achieved by surface adsorptionReference Chen, Wu, Pu, Chiu, Kumar, Takenobu and Li47 or intercalation of electron accepting molecules,Reference Shi, Huang, Jin, Hsu, Yu, Li and Yang48–Reference Mouri, Miyauchi and Matsuda50 substitutional doping is considered a more practical and stable approach since the dopant is secured by covalent bonding. Density functional theory has been used to study possible substitutional doping strategies for MoS2 monolayers,Reference Dolui, Rungger, Das Pemmaraju and Sanvito51 where the replacement of Mo by Nb is the most promising p-doping method.
Experimentally, Suh and co-workers have demonstrated that Nb doping in the MoS2 layer leads to stable p-type conduction, as shown in Figure 3c.Reference Suh, Park, Lin, Fu, Park, Jung, Chen, Ko, Jang, Sun, Sinclair, Chang, Tongay and Wu52 The Nb-doped MoS2 crystals with a nominal 0.5% Nb doping were grown by a chemical vapor transport method, where iodine was used as the transport agent. However, this method could only produce MoS2:Nb bulk crystals, which need further exfoliation to obtain atomically thin-layered 2D materials for electronic device fabrication. The MoS2:Nb device exhibits p-type conduction, but the gate voltage (V g) dependence becomes much weaker, which can be attributed to the degeneracy of the Nb doping level.
TMDC ternary van der Waals alloys
The intrinsic bandgap of TMDCs can be engineered by their stoichiometry. Recently, both Mo1–xWxS2 and MoS2xSe2(1–x) (x = 0 – 1) alloys have been synthesized via CVD.53–55 As shown in Figure 3d, the successful synthesis of TMDC alloys provides a versatile change in their band structure, and a tunable bandgap emission has been observed.
Additionally, being an important 2D diluted magnetic semiconductor, Co-doped MoS2 has recently been investigated both theoretically and experimentally.Reference Li, Huang, Zhong, Huo, Li, Yang, Fan, Yang, Hu, Wei and Li56 Li et al. reported the synthesis of large-scale CoxMo1–xS2 (x = 0.16) nanosheets by an adapted CVD method,Reference Li, Huang, Zhong, Huo, Li, Yang, Fan, Yang, Hu, Wei and Li56 where Co3O4 and MoO3 powder were used as precursors, and sulfur was placed at a hot zone to generate sulfur vapor for the growth. The CoxMo1–xS2 nanosheets exhibit n-type semiconducting transport behavior. Interestingly, when the growth temperature is increased from 680°C to 750°C, CoS2 gradually grows on the surface of CoxMo1–xS2 following the shape of the underlying 2D layers.
Synthesis of artificial TMDC heterostructures
vdW layered materials have strong in-plane bonding and weak vdW interplanar interactions. Combining the unique properties of different 2D layered materials, including graphene, h-BN, and TMDCs, into hybrid vdW heterostructures offers the possibility to create novel 2D building blocks with new functionalities for versatile applications.Reference Geim and Grigorieva57 The success of vdW hybrid materials is manifested in flexible photovoltaic devicesReference Britnell, Ribeiro, Eckmann, Jalil, Belle, Mishchenko, Kim, Gorbachev, Georgiou, Morozov, Grigorenko, Geim, Casiraghi, Neto and Novoselov58,Reference Tsai, Su, Chang, Tsai, Chen, Wu, Li, Chen and He59 and field-effect tunneling transistors.Reference Britnell, Gorbachev, Jalil, Belle, Schedin, Mishchenko, Georgiou, Katsnelson, Eaves, Morozov, Peres, Leist, Geim, Novoselov and Ponomarenko60 MoS2/graphene or graphene/MoS2 heterostructures also have shown great potential in many novel applications, such as electronic logic and memory devices,Reference Wang, Yu, Lee, Shi, Hsu, Chin, Li, Dubey, Kong and Palacios7 ultrasensitive detection of deoxyribonucleic acid (DNA) hybridization,Reference Loan, Zhang, Lin, Wei, Li and Chen61 hydrogen evolution reaction,Reference Chang, Wu, Chen, Hsu, Chen, Wiryo, Wei, Chiang and Li62,Reference Smith, Chang, Raidongia, Chen, Li and Huang63 and energy storage.Reference Shi, Wang, Wong, Tan, Hsu, Li, Lu and Yang64,Reference Cao, Shi, Shi, Rui, Yan, Kong and Zhang65
On the other hand, considerable effort has been made in creating heterostructures formed by different 2D semiconducting TMDCs. The main theme originates from the heterostructures of conventional Group IV or III–V semiconductors with different bandgaps, which already lie at the heart of modern semiconductor electronics and optoelectronics. Layer-by-layer stacking of TMDCs with different bandgaps thus represents a 2D analogue, which opens up opportunities for engineering material properties for device applications. For example, by combining n-type MoS2 and p-type WSe2 monolayers, it is possible to realize atomically thin vdW p–n junctions. Artificial stacking through “peel-and-paste” processes (i.e., mechanical transfer of one TMDC monolayer onto another) is the most straightforward method to construct TMDC heterostructures.
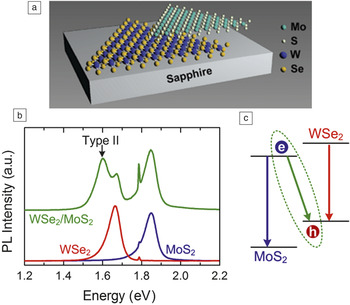
Theoretical studies based on first-principles ab initio calculations suggest that the MoX2/WX2 (X = S, Se) heterostructure exhibits a Type II semiconductor heterojunction with a staggered bandgap alignment.Reference Kang, Tongay, Zhou, Li and Wu66–Reference Terrones, López-Urías and Terrones68 Observation of the interlayer Type II optical transition is a fingerprint of interlayer coupling between two dissimilar TMDC monolayers. Indeed, PL from interlayer Type II excitons has been observed in artificially stacked MoS2/WSe2,Reference Fang, Battaglia, Carraro, Nemsak, Ozdol, Kang, Bechtel, Desai, Kronast, Unal, Conti, Conlon, Palsson, Martin, Minor, Fadley, Yablonovitch, Maboudian and Javey69–Reference Lee, Lee, van der Zande, Chen, Li, Han, Cui, Arefe, Nuckolls, Heinz, Guo, Hone and Kim71 WS2/MoS2,Reference Tongay, Fan, Kang, Park, Koldemir, Suh, Narang, Liu, Ji, Li, Sinclair and Wu72 and WSe2/MoSe2Reference Rivera, Schaibley, Jones, Ross, Wu, Aivazian, Klement, Seyler, Clark, Ghimire, Yan, Mandrus, Yao and Xu73 heterobilayers. Figure 4 shows the PL spectra for an artificially stacked MoS2/WSe2 heterobilayer with interlayer coupling. Apart from the band edge PL from the MoS2 (1.85 eV) and WSe2 (1.67 eV), a Type II PL at 1.60 eV can be observed, indicative of interlayer coupling.
Photoluminescence (PL) from vertically stacked transition-metal dichalgonide heterostructure. (a) Schematic of the MoS2/WSe2 van der Waals heterojunction; (b) PL spectra of monolayer MoS2 (blue), monolayer WSe2 (red), and stacked MoS2/WSe2 heterostructure (green) after thermal annealing. The recombination of the electron–hole pairs at the interface gives lower energy than MoS2 and WSe2 itself. (c) Schematic of the band alignment of the MoS2/WSe2 heterostructure. The MoS2 and WSe2 junction is a Type II heterojunction. Excited electrons in WSe2 tend to accumulate in the MoS2 conduction band, and holes in MoS2 tend to accumulate in the WSe2 valence band at the interface. Note: e, electrons; h, holes. Reproduced with permission from Reference 70. © 2014 American Chemical Society.

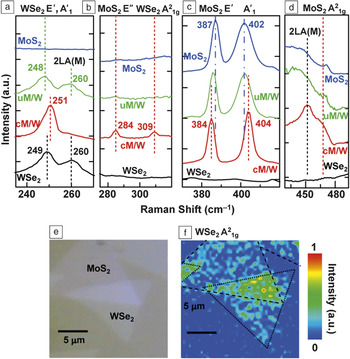
However, the fabrication of such artificial heterobilayers with the anticipated interlayer coupling remains challenging, since peel-and-paste processes would contaminate the heterointerface, which could completely destroy the interlayer coupling and result in two independent monolayers. This problem can be partially resolved by post-fabrication annealing.Reference Chiu, Li, Zhang, Hsu, Chang, Terrones, Terrones and Li70,Reference Tongay, Fan, Kang, Park, Koldemir, Suh, Narang, Liu, Ji, Li, Sinclair and Wu72 Figure 5 shows, in addition to the interlayer Type II PL emissions, the layer-number sensitive Raman out-of-plane mode AReference Huang, Zeng and Zhang21g for WSe2 (309 cm–1) and MoS2 (463 cm–1), as well as the appearance of the anomaly E″ mode for MoS2 (286 cm–1), which are also good indicators for the presence of interlayer coupling.Reference Chiu, Li, Zhang, Hsu, Chang, Terrones, Terrones and Li70
Raman spectra of the MoS2/WSe2 heterojunction. (a–d) Raman spectra of MoS2 (blue), uncoupled MoS2/WSe2 heterojunction (green; uM/W), coupled MoS2/WSe2 heterojunction (red; cM/W), and WSe2 (black). The curves are shifted for better comparison. The characteristic peaks for MoS2 are at 387 cm–1 (E′ mode; in-plane vibration) and 402 cm–1 (A′1 mode; out-of-plane vibration), and those for WSe2 are located at 250 cm–1 (E′ and A′1 degenerated mode). Raman bands at 260 cm–1 and 450 cm–1 correspond to the second order LA(M) phonon (2LA(M)). Raman band at around 284 cm–1 is a characteristic peak for bulk MoS2. In an odd number of layers, it is called E′′ due to the symmetry involved. The presence of the layer-sensitive Raman bands suggests strong MoS2 and WSe2 layer interaction. (e) Optical microscopy image of the MoS2/WSe2 heterostructure. (f) Spatial mapping of the Raman intensity for WSe2 A21g peak in the selected area shown in (e). The Raman bilayer signature is only observed and distributed uniformly in the stacked region. (a–f) Reproduced with permission from Reference 70. © 2012 American Chemical Society.

Compared to the approach based on artificial stacking, direct CVD growth is more promising for the mass production of various high-quality TMDC heterostructures with scalable size, controllable thickness, contamination-free interfaces, and reproducible electronic and optical properties. Remarkably, Gong et al. reported a scalable single-step vapor phase growth method for the formation of WS2/MoS2 heterostructures.Reference Gong, Lin, Wang, Shi, Lei, Lin, Zou, Ye, Vajtai, Yakobson, Terrones, Terrones, Tay, Lou, Pantelides, Liu, Zhou and Ajayan22 By controlling the growth temperature, either vertically stacked or in-plane interconnected WS2/MoS2 heterostructures can be formed. At high growth temperatures, vertically stacked WS2 layers on top of the MoS2 monolayer with the preferred 2H stacking can be formed. On the other hand, low temperature growth mostly results in lateral heterostructures of WS2 on MoS2 with atomically sharp heterojunctions.
Similar MoSe2–WSe2 lateral heterojunctions have also been fabricated by Huang et al. using the vapor–solid growth method.Reference Huang, Wu, Sanchez, Peters, Beanland, Ross, Rivera, Yao, Cobden and Xu74 Atomically resolved transmission electron microscopy (TEM) of the lateral heterostructure shows an undistorted lattice structure with substitution of one transition metal by another at the interface. Lateral heterostructures of the same transition metal but with different chalcogen atoms, such as MoS2–MoSe2 and WS2–WSe2, have also been realized by Duan and co-workers using in situ modulation of the chalcogenide vapor-phase reactants (sulfur/selenium) during growth.Reference Duan, Wang, Shaw, Cheng, Chen, Li, Wu, Tang, Zhang, Pan, Jiang, Yu, Huang and Duan23 Lateral heterojunctions can be formed epitaxially at the edges of existing TMDC domains. In particular, by combining n-type WS2 and p-type WSe2 laterally, monolayer p–n diodes or even complementary metal oxide semiconductor inverters can be constructed.Reference Duan, Wang, Shaw, Cheng, Chen, Li, Wu, Tang, Zhang, Pan, Jiang, Yu, Huang and Duan23
For better control of the synthesis of either vertical or lateral TMDC heterostructures via CVD growth, independent and programmable control of chemical vapor sources of transition metals and chalcogens are desired. If such a CVD system becomes available, more sophisticated TMDC heterostructures, such as one-dimensional quantum wires, sandwiched 2D quantum wells, or vertical/lateral superlattices, can be realized by programmable control of the vapor sources as a function of time during growth. With rapid advances in the synthesis of novel TMDC heterostructures, new device concepts and fascinating physics phenomena will emerge in the near future.
Synthesis and properties of heterostructures based on TMDC/other layer materials
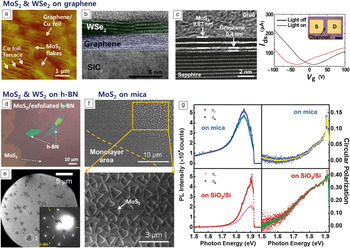
Since h-BN has an atomically flat surface without dangling bonds or charged impurities,Reference Shi, Hamsen, Jia, Kim, Reina, Hofmann, Hsu, Zhang, Li, Juang, Dresselhaus, Li and Kong75 it is expected that TMDC/h-BN heterostructures will show enhanced intrinsic properties such as high PL quantum yield and mobility compared to TMDCs on SiO2.Reference Mak, He, Shan and Heinz76,Reference Lee, Yu, Cui, Petrone, Lee, Choi, Lee, Lee, Yoo, Watanabe, Taniguchi, Nuckolls, Kim and Hone77 Recently, various approaches for the growth of TMDCs on graphene or h-BN templates have been tried. Kong et al. first reported, in 2012, a method for epitaxial growth of MoS2 on a graphene/Cu foil for a vertical heterostructure by low-pressure chemical vapor deposition (LPCVD) (Figure 6a).Reference Shi, Zhou, Lu, Fang, Lee, Hsu, Kim, Kim, Yang, Li, Idrobo and Kong78 They used (NH4)2MoS4 dissolved in an organic solvent, N,N-DMF, as a precursor, which formed MoS2 epitaxially on the graphene surface via thermal decomposition at low temperatures of 400°C. Even though there is relatively large lattice mismatch between MoS2 and graphene (∼28%),Reference Ma, Dai, Guo, Niu and Huang79 the intrinsically weak vdW interaction between the two materials plays an important role in the formation of the MoS2/graphene heterostructure, indicating that graphene can be a template for epitaxial growth of MoS2.
Synthesis and properties of heterostructures based on transition-metal dichalcogenide/2D layered materials. (a) Atomic force microscopy image of MoS2 flakes grown on graphene/Cu foil substrate. (b) Cross-sectional high-resolution transmission electron microscopy (HRTEM) images of WSe2/epitaxial graphene. (c, left) Cross-sectional HRTEM image of MoS2/graphene. White lines denote layer-to-layer distance for MoS2 (0.67 nm) and graphene (0.4 nm). (c, right) The I ds–V g characteristics of a MoS2/graphene transistor device. Inset optical microscopy (OM) image shows the device architecture (scale bar = 50 µm). The photoresponse of the device suggests a Fermi level shift of the graphene channel due to hopping of photoexcited electrons from MoS2 to graphene. (d) Typical OM image of MoS2/exfoliated h-BN using F16CuPc as a promoter. The monolayer MoS2 is light purple; h-BN is light green and dark green due to their thickness differences. (e) Low-energy electron microscopy image and (inset) low-energy electron diffraction pattern (marked by dotted white circle and “1” in microscopy image, at 50 eV) of a WS2 crystal grown on h-BN. (f) Scanning electron microscopy images of monolayer MoS2 on a mica substrate. (g) Helicity resolved photoluminescence (PL) spectra (left) and the corresponding circular polarization scatter-plot as function of emissive photon energy (right). The high value of PL helicity at room temperature indicates a long lifetime for the photogenerated excitons in their original valley at the K point. (a) Reproduced with permission from Reference 78. © 2014 American Chemical Society. (b–c) Reproduced with permission from Reference 80. © 2014 American Chemical Society. (d) Reproduced with permission from Reference 44. © 2014 American Chemical Society. (e) Reproduced with permission from Reference 83. © 2014 American Chemical Society. (f–g) Reproduced with permission from Reference 20. © 2014 American Chemical Society. Note: I ds, drain current; V g, gate voltage; S, source; D, drain; σ+, right-handed polarization component; σ–, left-handed polarization component.

Lin et al. also demonstrated the direct growth of MoS2 or WSe2 on epitaxial graphene on a SiC substrate, as shown in Figure 6b.Reference Lin, Lu, Perea-Lopez, Li, Lin, Peng, Lee, Sun, Calderin, Browning, Bresnehan, Kim, Mayer, Terrones and Robinson80,Reference Lin, Chang, Ghosh, Li, Zhu, Addou, Diaconescu, Ohta, Peng, Lu, Kim, Robinson, Wallace, Mayer, Datta, Li and Robinson81 Strain, wrinkling, and defects on the surface of graphene can be nucleation centers, and, in particular, MoS2 on graphene can lead to a 103 times improvement in photoresponse compared to MoS2 alone, possibly due to the higher crystal quality of MoS2 with an atomically sharp interface and the screening of the charge scattering from SiC by graphene. Subsequently, Lin et al. reported uniform MoS2/graphene heterostructures on sapphire substrates.Reference Lin, Chang, Wang, Su, Chen, Lee and Lin82 Sapphire was used to maximize the film size of the heterostructure and avoid possible chemical reactions between growth substrates. The number of MoS2 layers were controlled by changing the amount of the precursor, MoCl5. The cross-sectional high-resolution TEM image shown in Figure 6c (left) reveals direct evidence for a vertical heterostructure of MoS2 and graphene with interlayer spacing of 0.67 nm and 0.4 nm, respectively. A Fermi level shift of the graphene channel on the MoS2/graphene heterostructure was observed due to hopping of photoexcited electrons from MoS2 to graphene (Figure 6c, right).
Kong et al. grew MoS2 monolayers on mechanically exfoliated h-BN substrates using F16CuPc as a seeding promoter, which was deposited on h-BN by thermal evaporation (Figure 6d).Reference Ling, Lee, Lin, Fang, Yu, Dresselhaus and Kong44 Okada et al. reported the growth of WS2 single layers on mechanically exfoliated h-BN using WCl6 and elemental sulfur as precursors by an atmospheric pressure CVD system.Reference Okada, Sawazaki, Watanabe, Taniguch, Hibino, Shinohara and Kitaura83 The WS2 grown on h-BN exhibited an intense sharp PL emission peak centered at 2.01 eV with a very small full width at half maximum of ∼26 meV, indicating high-quality WS2. Moreover, they measured low-energy electron diffraction patterns of WS2/h-BN, shown in Figure 6e, indicating a distinct crystallographic relation between WS2 and h-BN. This observation reveals the presence of substantial interaction between WS2 and h-BN.
Similar to graphene and h-BN, fluorophlogopite mica (KMg3AlSi3O10F2) is also atomically flat and has a hexagonal crystalline structure with small lattice mismatch (∼2.7%) with MoS2. Thus, it is considered to be a good template for TMDC growth by CVD methods. Ji et al. reported that centimeter scale, single-layer MoS2 could be grown on mica using LPCVD (Figure 6f).Reference Ji, Zhang, Gao, Zhang, Ma, Liu, Chen, Qiao, Tan, Kan, Feng, Sun and Liu20 They suggested that even a small lattice mismatch between mica and MoS2 can induce intrinsic strain that quenches the PL. Figure 6g shows helicity-resolved PL spectra and corresponding circular polarization for MoS2 on mica and on SiO2/Si after transfer.Reference Ji, Zhang, Gao, Zhang, Ma, Liu, Chen, Qiao, Tan, Kan, Feng, Sun and Liu20 The complementary colored curves inside the circular polarization scatter-plot are the adjacent-point-averaged results. The degree of circular polarization is defined as:
 $$P\left( {{\sigma _ + }} \right) = {{\left( {I\left( {{\sigma _ + }} \right) - I\left( {{\sigma _ - }} \right)} \right)} \mathord{\left/ {\vphantom {{\left( {I\left( {{\sigma _ + }} \right) - I\left( {{\sigma _ - }} \right)} \right)} {\left( {I\left( {{\sigma _ + }} \right) + I\left( {{\sigma _ - }} \right)} \right),}}} \right. \kern-\nulldelimiterspace} {\left( {I\left( {{\sigma _ + }} \right) + I\left( {{\sigma _ - }} \right)} \right),}}$$
where I(σ+) and I(σ–) denote the PL intensity of the right- and left-handed components, respectively. MoS2 on mica exhibited a low PL helicity, P(σ+), of less than 0.1, whereas MoS2 transferred onto SiO2/Si from mica showed a PL helicity of ∼0.35 because of a dramatically decreased I(σ–) at room temperature. This phenomenon is due to the released strain of MoS2 being transferred onto the SiO2/Si substrate. The high PL helicity means a long lifetime for the photogenerated excitons, indicating high-quality MoS2.
Summary
Semiconducting TMDC materials with tunable doping levels make them complementary to graphene and other 2D materials. Various methods have been developed for the synthesis of monolayer and few-layer TMDC nanosheets, among which the exfoliation method generates a range of well-dispersed TMDC monolayers in high-yield and large amounts, while chemical synthesis approaches can produce TMDC materials on the wafer-scale that are useful for the fabrication of electronic and optoelectronic devices. In addition, the electrodispersive properties and the semiconducting nature of TMDCs can be tailored by chemical doping and bandgap engineering. Novel properties and new phenomena also arise from 2D heterostructural stacking. To realize practical applications, more effort is required to address many issues related to the growth, including layer number control, size control, selective-area growth, and direct growth of heterostructures.
Acknowledgments
L.J.L. and Y.S. thank support from King Abdullah University of Science and Technology and the USA AFOSR BRI grant. W.H.C. and L.J.L. acknowledge support from the Center for Interdisciplinary Science of NCTU, Taiwan Consortium of Emergent Crystalline Materials (TCECM) and Ministry of Science and Technology, Taiwan (Grant No.: NSC102–2119-M-009 -002 -MY3). H.S.S. thanks support from the NRF grant (No. 20140610011) and a grant (CASE-2014M3A6A5060939) from the Center for Advanced Soft Electronics under the Global Frontier Research Program through the National Research Foundation funded by the Ministry of Science, ICT, and Future Planning, Korea. This work was supported by MOE under AcRF Tier 2 (ARC 26/13, No. MOE2013-T2–1-034), AcRF Tier 1 (RG 61/12, RGT18/13, and RG5/13), and Start-Up Grant (M4080865.070.706022), and Singapore Millennium Foundation in Singapore. Research was also conducted by NTU-HUJ-BGU Nanomaterials for the Energy and Water Management Programme under the Campus for Research Excellence and Technological Enterprise, which is supported by the National Research Foundation, Prime Minister’s Office, Singapore.