INTRODUCTION
The dominance of planktivore animals in pelagic and also in benthic fauna of coral reefs is an obvious fact (Emery, Reference Emery1968; Harmelin-Vivien, Reference Harmelin-Vivien1981; Sorokin, Reference Sorokin1993). However, the information on composition, abundance and productivity of plankton in waters of the Great Barrier Reef (GBR) is still insufficient and rather controversial. Especially it concerns such key components as microzooplankton and mesozooplankton. More is known about bacterioplankton (Duclow, Reference Duclow and Dubinski1990; Sorokin, Reference Sorokin and Dubinski1990; Gast et al., Reference Gast, Wiegman, Wieringa, Duyl and Bak1998; Torreton et al., Reference Torreton, Pagès and Talbot2002) and phytoplankton (Ferrier-Pages & Gattuso, Reference Ferrier-Pages and Gattuso1998; Crosbie & Furnas, Reference Crosbie and Furnas2001). Pitifully, most of the published data on the phytoplankton density are expressed only in chlorophyll units (Furnas et al., Reference Furnas, Mitchell, Gilmartin and Revelante1990; Liston et al., Reference Liston, Furnas, Mitchell and Drew1992), thus being only an indefinite approximation because of a wide range of biomass to chlorophyll ratios. The data by Ayukai (Reference Ayukai1995) on the ciliate density in the GBR waters are a grave underestimation combined with the use of a sedimentation method non-applicable for this purpose. The naked ciliates do not sustain fixatives such as formalin used in this case. More research efforts were undertaken to quantify the mesozooplankton (Hodgeson, Reference Hodgeson1982; Sammarco & Crenshaw, Reference Sammarco and Crenshaw1984; Hamner et al., Reference Hamner, Jones, Carleton, Hauri and McWilliams1988; Roman et al., Reference Roman, Furnas and Mullin1990; McKinnon et al., Reference McWilliam, Sale and Anderson2005). These results might be also recognized only as an approximation to the side of underestimation of real biomass. The main cause was the use of plankton nets and traps with their indefinite catching efficiency, and prevalence of daytime net tows during the routine sampling. The zooplankton density data were often presented only as numbers of specimens counted.
The aim of our research was the estimation of the standing stock of principal plankton components in waters of deep lagoon and reef shallows in the Capricornia zone of GBR. These data were used to evaluate production of these components and to calculate whole plankton biomass, in order to characterize the trophic conditions of reef planktivore fauna. Special attention was paid to evaluation of the role of demersal zooplankton in reef food webs.
MATERIALS AND METHODS
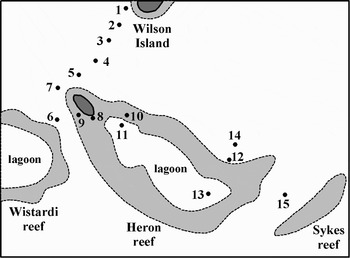
Field research was accomplished at the Heron Island Research Station of Queensland University in October 1999. The sampling was done at the cross-section between Heron and Wilson Islands, in the Wistari channel and in the Heron Island inner lagoon and over reef flat (Figure 1). The sampling missions were carried out during the daytime and also at night. The time series sampling missions were accomplished from the afternoon until early morning to observe the time scale of the emergence of demersals from bottom habitats up to the water column.
Scheme for position of stations in the Heron Island area.

Microplankton was quantified within its principal groups: bacterioplankton, phytoplankton, planktonic protozoa and metazoan larvae. Wet biomass (biovolume), expressed as mg m−3 was determined after measuring its numerical abundance and mean individual cell volume. Bacterioplankton, phytoplankton, zooflagellates and nanocilicates were quantified by epifluorescence microscopy after Hobbie et al. (Reference Hobbie, Daley and Jasper1977) and Caron (Reference Caron1983). Phytoplankton was accounted within the fractions of picoalgae (1 to 2 µm), nanoalgae (2 to 15 µm) and microalgae (>15 µm). Larger ciliates >30 µm size were quantified by viable counting in a chamber 4 mm deep of 30 cm3 capacity (Sorokin, Reference Sorokin1999).
Mesozooplankton was collected over the reef shallows by filtration of 50 l of water via 40 µm plankton net (Glynn, Reference Glynn1973; Sorokin, Reference Sorokin1994). In the deep lagoon, it was collected with the aid of a standard 220 µm conical net. The net was pre-calibrated for the catching efficiency by comparison with the method mentioned above, which was accepted as the reference one. The procedure was accomplished in the Sykes channel at Station 15 (14 m deep) during the coming tide, when the water column was intensively mixed by strong tidal current providing uniform zooplankton distribution on the vertical profile. Catching efficiency of the conical net was established as the per cent ratio between zooplankton biomass estimated in the net tow sample and its mean biomass estimated in samples collected before and after the tow by filtration of 100 l of water via 40 µm plankton net, both expressed as mg m−3. This procedure was repeated 3 times and resulted in the coefficient of catching efficiency of this conical net at 18%. Biomass of zooplankton was expressed in wet weight units calculated after number of key size–taxonomic groups and of their mean individual weights (Glynn, Reference Glynn1973; Afrikova et al., Reference Afrikova, Lutzarev and Petipa1977).
The demersal zooplankton hidden by the daytime in bottom substrates was quantified in washes of the substrate samples. The samples of coral rubble and macrophytes were collected underwater and carefully stowed into the plastic bags. The demersals were washed out from the pre-weighted samples. The washes were concentrated at 200 µm net and fixed with Lugol. The demersals were counted in the sub-samples of this concentrate. Their number and biomass were calculated per 1 m2 of bottom area.
The biomass data are given in tables as the wet weight. To express these data in the carbon units, the following convenient coefficients might be employed: pico- and nanophytoplankton—0.15, larger phytoplankton—0.08, bacterioplankton—0.2 and micro and mesozooplankton—0.1.
RESULTS
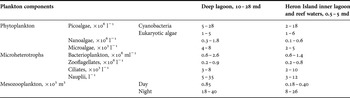
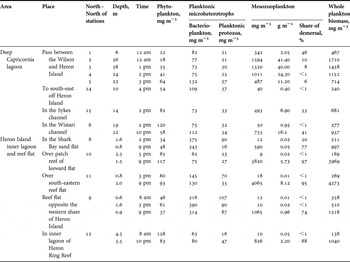
Data on the number and wet biomass of principal plankton components are summarized in Tables 1 and 2. Phytoplankton was dominated by fraction of small pico- and nanoalgae composed mainly of picocyanobacteria, with a minor presence of prochlorophyte algae and minute phytoflagellates. Their number varied between 3 to 30×106 l−1. This fraction contributed 70 to 90% of whole phytoplankton biomass (Table 2). The larger algae were represented by diatoms and dinoflagellates, numbered from 2 to 8·103 l−1. Phytoplankton biomass ranged between 28 to 105 mg m−3 in the deep lagoon, and between 37 and 128 mg m−3 in shallow waters. The greatest biomass was recorded at Station 12 in the inner lagoon.
Numerical density of basic plankton components. md, depths, m.

Biomass of principal plankton components in waters of Heron Island Reef and surrounding deep lagoon.

Numbers of bacterioplankton in the deep lagoon ranged between 0.6 and 2.6·106 ml−1 and their biomass ranged between 73 and 132 mg m−3. In shallow reef waters, bacterioplankton biomass was over 200 mg m−3 at most stations (Tables 1&2), thus being several times greater on comparison with the phytoplankton biomass.
The protozoan community included phagotrophic zooflagellates 2–5 µm in size and ciliates 15 to 50 µm size. Their joint biomass varied between 20 to 100 mg m−3. The number of zooflagellates was 0.2 and 0.9×10⁶ l−1 and biomass between 3 and 15 mg m−3. Their population was dominated by the genera Bodo, Bodomorpha, Monas and Rhynchomonas. Share of zooflagellates in joint protozoan biomass varied between 5 to 15%. The rest was contributed mostly by small oligotrich ciliates from the genera Strombidium, Strobilidium and Tontonia numbered between 2 and 10·103 l−1 (Tables 1&2).
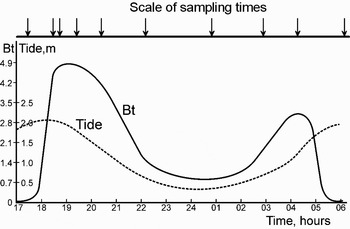
The daytime mesozooplankton was most abundant in the passes between the Heron and the Wilson reefs and between the Heron and the Sykes reefs at Stations 1 to 5 and Station 15 (Table 2). The water column in these passes experiences turbulent mixing induced by fast tidal currents, which elevate plankton, including the demersals, from the near-bottom layer. The daytime zooplankton biomass was at these stations over 480 mg m−3. At Station 2 it reached 1590 mg m−3. At this station 26 m deep, the water column biomass reached 41 g m−2. The demersal species contributed up to 40% of whole zooplankton biomass even during the daytime. In the Wistari channel, where the tidal currents were moderate, the daytime biomass was 50 mg m−3 rising at night to over 700 mg m−3 (water column biomass there was 16 g m−2). In the shallow waters over the reefs and in the inner lagoon, the daytime zooplankton biomass was less than 20 mg m−3. At night, it elevated to over 600 mg m−3 in the inner lagoon with sandy bottom, and up to 4000 mg m−3 over the rubble–macrophyte dominated reef flat. The number of zooplankton reached there up to 30×103 m−3. The share of demersals in total zooplankton biomass rose night up to 70–90% (Tables 1&2). The maximal nocturnal biomass nearly 5 g m−3 was recorded between 7 and 8 pm over patch reefs in the inner lagoon (Figure 2). The daytime zooplankton population at shallows was dominated by calanoid and cyclopoid copepods. During the dark, its basic biomass was composed of bentho-planktonic demersals, including harpacticoid and calanoid copepods, mysids, zoea, ostracods and amphipods.
Diel time course curves of zooplankton biomass (Bt, gm−3) and tide heights in the Heron Island lagoon.

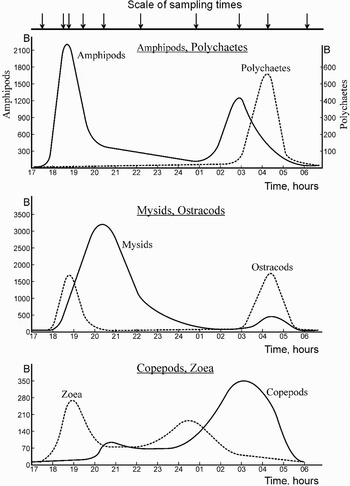
Previous research had demonstrated a definite periodicity in appearance of principal demersal groups in the water column during the night (Alldredge & King, Reference Alldredge and King1977; Sale et al., Reference Sale, McWilliam and Anderson1978; McWilliam et al., Reference Moriarty, Pollard, Hunt, Moriarty and Wassenburg1981; Jacoby & Greenwood, Reference Jacoby and Greenwood1988). We accomplished nocturnal time series sampling over a lagoon patch reef of Station 13 to the depth 2.5 m. The results showed rapid build up of total zooplankton biomass after the sunset with its maximum between 6.30 and 8.00 pm. Within one hour of twilight, the biomass rose up 2 orders of magnitude from 20 mg up to 4.9 g m−3 (Figures 2&3). Thus a rapid buildup of zooplankton biomass related to amphipods, ostracods, mysids and zoea emerged from the bottom substrates. The first two groups of demersals demonstrated maximal rate of emerging in the evening and in the morning. Mysids displayed one maximum at late evening, zoea displayed two maxima: one in the evening and the second after midnight. The copepods began to build up their abundance also at dusk. After midnight, their biomass reached 350 mg m−3 being contributed largely by harpacticoids.
The sum of maximal biomasses of principal demersals species recorded during the dark might be accepted as an approximation to their stock in bottom substrates where they were hiding during the daytime. In our case, this stock was nearly 15 g m−2 (Figure 3) versus the moment of maximum total demersal biomass of approximately 4.9 g m−2 at 7.30 pm (Figure 2). These data show that only a part of the whole demersal community appears in the water column during the dark at a given time interval.
Fluctuations of biomass (B, mg m−3) of zooplankton components within the diel time scale at Station 11 among patch reefs in the Heron Island lagoon up to 4 m depth.

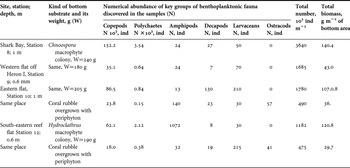
To evaluate biomass and composition of the whole community hidden by the daytime in bottom substrates, abundance and composition of bentho-planktonic fauna were assessed also in the washes of macrophyte thickets and coral rubble, which are most common at the reef flat and at the lagoon patch reefs. The numerical abundance of bentho-planktonic communities calculated per bottom area varied between 490×103 m−2 in the coral rubble biotopes up to 3600×103 m−2 in the thickets of macrophyte Chnoospora. Harpacticoid copepods and amphipods were found most numerous in the washes. Among other groups, calanoid copepods, decapods, ostracods, zoea and polychaetes were also present. Their joint wet biomass in the macrophyte thickets was between 43 to 140 g m−2. In the coral rubble overgrown with periphyton this biomass was nearly 20 g m−2 (Table 3). That was roughly 10 to 30 times greater than the joint maximal biomass of key demersals recorded in the water column overnight during the diel observations (Figure 3).
Numerical abundance (N) and wet biomass of benthoplanktonic demersal fauna found in the samples of bottom substrates collected by the daytime at the reef flat and in the shallow lagoon sites of Heron Island.

DISCUSSION
Results of this study offer an explanation of the principal phenomenon on coral reef ecosystems: the dominance of planktivore fauna versus prevailing benthic autotrophic production and versus relative paucity of pelagic primary production (Davis & Birdsong, Reference Davis and Birdsong1973; Harmelin-Vivien, Reference Harmelin-Vivien1981; Sorokin, Reference Sorokin and Dubinski1990, Reference Sorokin1993). Data on abundance composition and on abundance of pelagic communities provide information on structure of reef food webs. Adequate data on the standing stocks of animal plankton components enables to calculate their production using known coefficients of their daily specific production. Phytoplankton and bacterioplankton production might be measured directly with the use of radioisotopic techniques (Moriarty et al., Reference Panov and Sorokin1985; Sorokin, Reference Sorokin and Dubinski1990, Reference Sorokin1999). Reasonable coefficients of daily specific production (μ) were assumed in planktonic protozoans and these were estimated between 0.8 and 1.5, in holoplanktonic and zooplankton between 0.12 and 0.25, and in bentho-planktonic demersals between 0.05 and 0.1 (Zaika, Reference Zaika1973; Grese, Reference Greze and Kinne1978; Sorokin, Reference Sorokin1993, Reference Sorokin1994; Crosbie & Furnas, Reference Crosbie and Furnas2001; McKinnon & Duggan, Reference McKinnon, Talbot and De'ath2003, McKinnon et al., Reference McWilliam, Sale and Anderson2005). Data on the standing stock of reef plankton groups reflect the moment of dynamic balance between production and mortality rates. Therefore, only their production might be available for the grazers, but not just the standing stock itself as has been suggested by some authors (Alldredge & King, Reference Alldredge and King1977). By a quasi-stable mean daily standing stock of plankton components, their mortality should be balanced with their production. In accordance with the above μ coefficients, reef fauna may graze daily over 100% of the microplankton standing stock, but only around 10% of the of mesozoolankton stock is composed of holoplanktonic species and demersals. More intense grazing will result in its depletion. But this does not happen in the reef habitats even by extremely high grazing of zooplankton by abundant planktivore fauna.
The standing stock of zooplankton was found significant in the reef waters (Table 2). It was up to 40 g m−2 in the pass between the Heron and Wilson Islands, where strong tidal currents elevate the demersal plankters up to the water column, even by the daytime (Hamner & Hauri, Reference Hamner and Hauri1981). Daily production by the mixed stock of holoplanktonic and demersal zooplankton might be expected there around 6 g m−2 of wet biomass, assuming mean specific production 0.15 per day, and accounting for the zooplankton standing stock accessible for grazing at 40 g m−2, out of which 10 g m−2 is contributed by holoplanktonic copepods and 30 g m2 by whole demersal community, meaning that only a third part of this fraction appears in the water column at night. The food demand of planktivore fauna in this reef habitat might be expected at about 5 to 6 g m−2. The biomass of principal grazer planktivore fish and fish larvae is the range 3–4 g m−3 or 40 to 60 g m−2. Meat biomass of other planktivore fauna such as hydropods, zoantharians, cirripedes and polychaetes is between 10 and 20 g m−2 (Sorokin, Reference Sorokin1993). This production is sufficient to meet the daily food demand by planktivore fish which might be estimated at 3–4 g m−2 if their most probable biomass is at 40–50 g m−2, μ ~0.015 and secondary production efficiency coefficient K1 ~0.2. This standing stock of planktivore fish is usual in the GBR lagoon with the total fish biomass 120–150 g m−2 and the share of planktivore fish in their reef communities 30 to 40% (Harmelin-Vivien, Reference Harmelin-Vivien1981; Williams & Hatcher, Reference Williams and Hatcher1983; Venier & Pauly, Reference Venier and Pauli1997). The remaining 2–3 g m−2 of daily zooplankton production can satisfy the food demand of invertebrate grazers such as hydroids, zoantharians and crustaceans, with their joint meat biomass in such habitats at 10 to 20 g m−2 (Sorokin, Reference Sorokin1993). The above balance between zooplankton production and grazing rate becomes possibly evident only on condition of adequate assessment of zooplankton standing stock, which results in its mean daily biomass between 1 and 2.5 g m−3 in the deep lagoon (Table 2; Figure 2).
On the reef shallows during the dark, zooplankton biomass varied between 0.6 and 4 g m−3, depending on the character of bottom substrates: less over the sand and more over the coral rubble with macrophytes. Its mean daily production might be expected at 0.05 to 0.4 g m−3, by μ ~0.08. In reality, the production of whole demersal bentho-planktonic community hidden in the bottom substrates must be also accounted. A most probable rate might be assumed at 4 to 8 g m−2 d−1, if its real standing stock is 50 to 100 g m−2 of wet biomass (Table 4). Some 2 to 4 g m−3 of their daily production might be grazed in the water column of reef shallows at night, if we assume that some 30% of whole demersal populations appear in the water column by turns overnight and is grazed by planktivore fauna. This level of zooplankton production is sufficient to support an abundant planktivore fauna of reef flat and slope without depletion of basic zooplankton stock. It explains why the demersals' fraction dominates in the guts of planktivore and omnivore reef fish (Harmelin-Vivien, Reference Harmelin-Vivien1981). The nocturnal zooplankton maximum in the reef waters is well documented (Alldredge & King Reference Alldredge and King1977; Sale et al., Reference Sale, McWilliam and Anderson1978; McWilliam et al., Reference Moriarty, Pollard, Hunt, Moriarty and Wassenburg1981). In accordance with the above data, the standing stock of zooplankton is measured by grams of wet biomass per 1 m−3. This stock is created basically by the demersals, which use presumably the energy sources of bottom biotopes.
However, the above mentioned balance between zooplankton production and food demand of reef planktivore fauna will be lost if we consider the published data on zooplankton standing stock in the GBR waters (Hodgeson, Reference Hodgeson1982; Sammarco & Crenshaw, Reference Sammarco and Crenshaw1984; Hamner et al., Reference Hamner, Jones, Carleton, Hauri and McWilliams1988; Roman et al., Reference Roman, Furnas and Mullin1990). These authors estimated mean wet biomass in the GBR waters ranging between 30 and 100 mg m−3 (3 to 10 mg C m−3). Corresponding mean zooplankton production might be expected between 2 and 7 mg C m−3 d−1. This is about one order of magnitude less than the food demand of reef planktivore fauna. The cause of this probable underestimation of zooplankton density might be the use of plankton nets with indefinite catching efficiency, which might be less than 10% in conical nets ~250 µm mesh (Shushkina & Vinogradov, Reference Shushkina, Vinogradov, Zatsepin and Flint2002; personal observation). This might also be due to the nets supplied with the current meters fixed in the centre of their upper ring (McKinnon et al., Reference McWilliam, Sale and Anderson2005). The current speed and even its direction might be different in the centre of the net's mouth and at its margins (the ‘bucket’ effect). The biomass data provided by the above authors are approximately twice as greater on comparison with our data (10–30 mg C m−3). Anyway, these data still might be considered as an underestimation of 3 to 10 times.
An adequate evaluation of plankton abundance has other important aspects. The nutrition efficiency of planktivore animals critically depends on the plankton concentration in water below its limit 0.5–0.8 g m−3.of wet biomass, at which the curve of dependence of their nutrition rate upon the food concentration bends thus approaching the plateau. This limit is practically the same in the filterers and in the catchers as well (Panov & Sorokin, Reference Panov and Sorokin1967; Gaudy, Reference Gaudy1974; Petipa, Reference Petipa1981; Sorokin & Giovanardi, Reference Sorokin and Giovanardi1995; Sorokin, Reference Sorokin1999). By the food concentrations below 150 mg m−3 in filterers, and below 250 mg m−3 in catchers, the assimilated food does not cover their energy expenditures. This food concentration level is the survival (the threshold) (Figure 4). The zooplankton concentration in reef waters corresponding to the above mentioned publications are even below this threshold level. So, they cannot explain how abundant reef planktivore fauna, and omnivore reef fauna flourish.
The standing stock of particulate food accessible for reef filterers and for sedentary feeders is formed of the holoplanktonic microplankton and of the benthic microflora which is re-suspended by surf and by tidal currents (Hansen et al., Reference Hansen, Alongi, Dayton and Riddle1992; Ferrier-Pages & Gattuso, Reference Ferrier-Pages and Gattuso1998). Joint stock of this food in the deep lagoon was estimated at 150 to 250 mg m−3 or 3 to 6 g m−2 of wet biomass in the water column (Table 2). Its daily production might be expected at 4 to 8 g m−2 assuming mean specific production (μ) close to 1.3 (see above). Phytoplankton contributes some 30%. The primary production in these waters ranges between 1.5 and 2 g m−2 d−1 as wet biomass (Sorokin, Reference Sorokin1993, Reference Sorokin1994). The remaining microplankton production was replenished by heterotrophic microplankton and by the benthic microflora washed out from the surrounding reef shallows. This production appeared to be quasi-sufficient to meet the daily food demand of filtering fauna in deep lagoon represented presumably by copepods (10 to 30 g m−2) and clams (3 to 5 g m−2 of meat biomass; Sorokin Reference Sorokin1993). The microplankton abundance over the reef shallows, increases about twice in comparison with the deep lagoon, attaining 400–640 mg m−3 (Table 2). This approaches here to an optimum needed for efficient nutrition of the reef filterers.
A number of publications suggest plankton depletion over the reefs and relate this phenomenon to the grazing impact of reef fauna (Glynn, Reference Glynn1973; Auyukai, Reference Ayukai1995; Gast et al., Reference Gast, Wiegman, Wieringa, Duyl and Bak1998; Yahel et al., Reference Yahel, Post, Fabricius, Marie, Vaulot and Genin1998, Reference Yahel, Yahel and Genin2005). This phenomenon was even used to quantify this grazing. However, the depletion evidently cannot be used as an evidence for this purpose. The depletion of plankton standing stock itself reflects only a misbalance between the rates of its production and elimination. This misbalance might be caused, besides the grazing, by other factors such as change of environmental parameters in waters arriving to the reef shallows or by plankton vertical migration. The assessments of plankton fluxes after the depletion data moreover cannot be realistic not accounting for the production rate. Anyway, we did not record any plankton depletion over the reefs during this study (Table 2).