1 Introduction
Understanding how people perceive politicians and other political actors is of central importance to many research areas in political science. But measuring these perceptions is far from straightforward. Of central concern is whether survey respondents may interpret the meaning of response scales in different ways. The use of these response scales is common in many areas of survey research. Perhaps most notably, in American politics, the seven-point ideological rating scale has been analyzed in countless studies. But it has long been known that different people may interpret the meaning of this and other scales in different ways (e.g. Brady Reference Brady1985). For example, if one respondent rates the ideology of Hillary Clinton as a 3 (somewhat liberal) and another respondent rates her as a 1 (very liberal), this difference could be caused by two different things. First, the two respondents might perceive these two candidates identically but use the rating scale differently to express their perceptions. This is the classic version of differential item functioning (DIF). In this case, it could be that the first respondent thinks about the terms “somewhat liberal” and “very liberal” differently than does the second respondent. But this difference in responses could also be due to differing perceptions of Clinton rather than scale use differences. In other words, even if these two respondents actually interpreted and used the seven-point ideology scale in the same way, it could be that the first respondent actually thinks that Clinton has a different ideology than the second respondent does perhaps because they hold different understandings of the policy positions Clinton supports or otherwise differ in their perceptions of her.
Aldrich and McKelvey (Reference Aldrich and McKelvey1977), in a classic article, introduce a method for estimating and adjusting for differences in scale use. Later, Hare et al. (Reference Hare, Armstrong, Bakker, Carroll and Poole2015) propose a Bayesian version of a similar model, which retains the benefits of the original, while better handling missing data and more appropriately quantifying uncertainty in the estimates. This Aldrich–McKelvey (hereafter A–M) approach assumes that all respondents perceive the same ideology for political stimuli (e.g. candidates, elected officials, or political parties), but that their ratings may not agree due to differences in the way each person interprets the response scale.Footnote 1 In other words, the works of Aldrich and McKelvey (Reference Aldrich and McKelvey1977) and Hare et al. (Reference Hare, Armstrong, Bakker, Carroll and Poole2015) are focused on estimating and correcting for the nature of respondent-specific DIF and do this by assuming that all respondents perceive the stimuli mentioned in surveys (typically politicians or political parties) identically.
The political actors thus serve as “anchors” that allow for the adjustment of individuals’ responses onto an interpersonally comparable scale. Any difference in respondents’ ratings of a politician’s ideology is assumed to be driven not by one respondent actually thinking of the politician as more liberal or conservative than another respondent does, but instead by respondents thinking of the meaning of the response scale differently. This necessarily prevents the estimation of varying perceptions of a given stimulus across respondents. It also prevents the investigation of how much of respondents’ response differences are the result of DIF and how much they are caused by differences in actual perceptions. If, for example, Republican respondents tend to rate Clinton as more liberal on the seven-point scale than Democrats do, the A–M approach cannot determine whether this is due to differences in scale use, differences in underlying perceptions, or both. This is because the A–M framework is built on the assumption that these differences are driven by DIF rather than true perceptual differences.
DIF is most commonly defined in the context of standard item response or similar models (e.g. Rasch Reference Rasch1966). In the A–M framework, the model is somewhat different. In particular, the slope and intercept parameters vary by individual respondent rather than by item, while what is typically called the “ability” parameter in the context of item response models (here the true ideological location of a political stimulus) varies by item. Therefore, the exact interpretation of DIF is different and, one could argue, somewhat less clear in the A–M framework. Here I think of DIF as occurring when two respondents who hold identical perceptions of a political actor’s ideological position would provide different answers in expectation when rating that actor on the same response scale (e.g. the seven-point ideological rating scale). DIF is thus defined here based on the relationship for individual respondents between their perceptions and their responses. Under this definition, examining the degree of DIF in Americans’ ratings of political actors requires being able to separately estimate individual respondents’ perceptions of political actors and also estimating the characteristics of the relationship between each individual’s perceptions and her responses (i.e. her seven-point ideology ratings of each stimulus).
In their discussion of the A–M framework, Hare et al. (Reference Hare, Armstrong, Bakker, Carroll and Poole2015) consider this identical perceptions assumption, arguing, for example, that “ideological centrists and extremists view the political world differently” (p. 761). They further suggest that people may rate politicians they generally agree with as more moderate, while pushing ones they disagree with to the extremes of the ideological scale. But it is not clear whether these sorts of dynamics represent pure DIF or differences in underlying perceptions. In other words, do extremists (or other types of respondents) simply interpret the values of the rating scale differently or do they hold different perceptions of the stimuli being rated? Under the standard A–M setup, it is not possible to differentiate between these two things without making very strong assumptions. For example, one could obtain estimates of individual DIF characteristics if one assumes that all respondents perceive political stimuli in exactly the same way. To the extent that Aldrich and McKelvey (Reference Aldrich and McKelvey1977) and Hare et al. (Reference Hare, Armstrong, Bakker, Carroll and Poole2015) maintain the assumption of identical perceptions, it appears to be due more to the limitations of the models used rather than a true belief that individuals hold identical perceptions in reality.
One strategy that has been used to estimate and adjust for differing interpretations of various response scales, for example, political efficacy, is the inclusion of so-called anchoring vignettes. These vignettes are survey items in which hypothetical stimuli are described and respondents are asked to rate them on a given responses scale (King et al. Reference King, Murray, Salomon and Tandon2004; King and Wand Reference King and Wand2007). By giving respondents the same vignettes, we can learn about their response scale use from the variation in their ratings of the vignettes. Then, their ratings of other stimuli can be adjusted based on the nature of the DIF revealed by the vignette responses. This approach has been used in a variety of settings, including the estimation of ideological positions of European political parties (e.g. Bakker et al. Reference Bakker, Jolly, Polk and Poole2014; Struthers, Hare, and Bakker Reference Struthers, Hare and Bakker2019). A related approach was taken by Simas (Reference Simas2017), who analyzes ideological ratings data with vignettes using a compound hierarchical ordered probit and finds that Republican respondents are more likely to use lower response options to rate the same vignettes that Democratic respondents would rate higher.
In this paper, I propose an approach built on the A–M framework, which incorporates anchoring vignettes to allow for the simultaneous estimation of each respondent’s particular scale use characteristics as well as their perceptions of each political stimulus. After introducing the modeling approach and describing its advantages over the standard A–M framework, I illustrate its potential using data on citizens’ perceptions of American political parties and politicians from the 2016 Cooperative Congressional Election Study (CCES). When compared to the standard A–M setup, the results of this new model indicate that the in ideology ratings between Democratic and Republican respondents are mostly due not to DIF, as the A–M approach would assume, but rather to differing perceptions of the actual ideology of politicians, political parties, or other things. While Democratic and Republican respondents do have some differences in the way they use ideological rating scales, these differences are dwarfed by the large inter-party differences in perceptions, particularly of liberal stimuli such as Hillary Clinton or Barack Obama. Analyzing additional data from the American National Election Studies (ANES), I also provide evidence that these basic patterns of partisan perception have held for several decades. Finally, I discuss how the results of this application cast doubt on the assumptions underpinning the A–M framework, suggesting that the use of vignettes can help overcome these problems.
2 Model: Estimating DIF-Adjusted Individual Perceptions
The model here begins with the basic setup of Aldrich and McKelvey (Reference Aldrich and McKelvey1977) and the Bayesian version later proposed by Hare et al. (Reference Hare, Armstrong, Bakker, Carroll and Poole2015), with some minor changes. This model is related to a standard latent factor model but with the slope and intercept terms indexed by individual and the latent trait value indexed by item. The central benefit of this setup is that respondents’ ratings of a stimulus (a politician, political party, or, here, a hypothetical individual described in a short vignette) are assumed to depend on the stimulus’s true position on an underlying ideological scale as well as the individual respondents’ scale use (or DIF) parameters.
Formally, the rating for respondent
 $i$
of stimulus
 $j$
, where a stimulus can be either an actual political actor (candidate, party, etc.) or a vignette describing a hypothetical person, is denoted as
 $z_{ij}$
and assumed to be generated according to the model
 $$\begin{eqnarray}z_{ij}=\unicode[STIX]{x1D6FC}_{i}+\unicode[STIX]{x1D6FD}_{i}\unicode[STIX]{x1D701}_{j}+\unicode[STIX]{x1D700}_{ij},\end{eqnarray}$$
where
 $\unicode[STIX]{x1D700}_{ij}\sim N\left(0,\unicode[STIX]{x1D70F}_{j}^{2}\right)$
with these error terms assumed to be independent across both individuals and stimuli. The actual (underlying) ideology of stimulus
 $j$
is
 $\unicode[STIX]{x1D701}_{j}$
, while
 $\unicode[STIX]{x1D6FC}_{i}$
and
 $\unicode[STIX]{x1D6FD}_{i}$
are called the shift and stretch terms, respectively. Intuitively, we can think of a respondent’s shift term
 $\unicode[STIX]{x1D6FC}_{i}$
as the expected rating she would give to a stimulus whose underlying ideology is zero. A higher (lower) value of
 $\unicode[STIX]{x1D6FC}_{i}$
indicates a respondent that is more prone to use the higher (lower) values on the seven-point ideology scale, i.e. someone who tends to rate stimuli more conservatively (liberally). The stretch parameter
 $\unicode[STIX]{x1D6FD}_{i}$
indicates how strongly a respondent’s rating of a stimulus is related to these stimuli’s underlying ideology. A stretch parameter of zero would mean that the respondent’s ratings are unrelated to the ideology of stimuli. A positive stretch parameter indicates that a respondent will tend to rate more conservative stimuli higher on the liberal–conservative scale. Some respondents could even have negative
 $\unicode[STIX]{x1D6FD}_{i}$
’s which would suggest that as a stimulus becomes more liberal, the respondent is likely to rate them as more conservative, and vice versa.
Because each respondent in applications of the A–M model typically provides a relatively small number of ratings, estimating these respondent-specific parameters can be difficult. Here, I employ a hierarchical structure that allows for partial pooling of these DIF parameters, which should result in more accurate estimates. I adopt a Bayesian approach and use the following hierarchical prior structure for the shift and stretch parameters:
 $$\begin{eqnarray}\displaystyle \unicode[STIX]{x1D6FC}_{i} & {\sim} & \displaystyle N(\unicode[STIX]{x1D707}_{\unicode[STIX]{x1D6FC}},\unicode[STIX]{x1D70E}_{\unicode[STIX]{x1D6FC}}^{2})\nonumber\\ \displaystyle \unicode[STIX]{x1D6FD}_{i} & {\sim} & \displaystyle N(\unicode[STIX]{x1D707}_{\unicode[STIX]{x1D6FD}},\unicode[STIX]{x1D70E}_{\unicode[STIX]{x1D6FD}}^{2})\nonumber\end{eqnarray}$$
with accompanying hyperpriors:
 $$\begin{eqnarray}\displaystyle \unicode[STIX]{x1D70F}_{j},\unicode[STIX]{x1D70E}_{\unicode[STIX]{x1D6FC}},\unicode[STIX]{x1D70E}_{\unicode[STIX]{x1D6FD}} & {\sim} & \displaystyle U(0,100)\nonumber\\ \displaystyle \unicode[STIX]{x1D707}_{\unicode[STIX]{x1D6FC}},\unicode[STIX]{x1D707}_{\unicode[STIX]{x1D6FD}} & {\sim} & \displaystyle N(0,10^{2}).\nonumber\end{eqnarray}$$
Standard normal priors are used for the latent ideologies of the stimuli
 $\unicode[STIX]{x1D701}_{j}$
subject to the restriction that they have mean zero, variance 1 across all stimuli, which identifies the model. This restriction also allows for the interpretation that values of
 $\unicode[STIX]{x1D701}_{j}$
near zero are moderate or centrist, while positive (negative) ones are more conservative (liberal).Footnote
2
As discussed above, in the standard A–M approach, all respondents are assumed to base their ideological ratings on the same positions for a given stimulus as represented by
 $\unicode[STIX]{x1D702}_{j}$
. Any systematic differences between respondents in their ratings are thus attributed to DIF as captured by
 $\unicode[STIX]{x1D6FC}_{i}$
and
 $\unicode[STIX]{x1D6FD}_{i}$
.Footnote
3
In order to relax the assumption of common perceptions across individuals, we require a separate set of “anchors” that can be used to estimate and adjust for each respondent’s particular response scale use characteristics. Imagine, then, that in addition to respondents stating their perceptions of the ideology of several different political actors, each respondent is also asked to rate the ideology of several hypothetical individuals, each described in a vignette by their positions on multiple policies. The approach here uses these vignettes, rather than actual politicians, as anchors, allowing for the adjustment of respondent ratings to correct for DIF.
Using anchoring vignettes in this way has two key advantages. First, assuming that all respondents will view a hypothetical individual, described in the same way to each respondent, as having the same ideology may be more plausible than assuming that all respondents would view a real world political actor (e.g. Donald Trump or Nancy Pelosi) in the same way. Second, by adding a second set of stimuli (the vignettes), it is possible to estimate respondent-specific DIF parameters and then to use those estimates to adjust each respondent’s ratings of other (nonvignette) stimuli in order to estimate each respondent’s potentially different perception of a given politician while also adjusting these perceptions for respondent-specific DIF.
To accomplish this, I estimate the parameters of the model described above, using respondents’ ratings of the hypothetical individuals described in the vignettes. We thus obtain estimates of the ideological position of each vignette and, more importantly for our purposes, estimates of each respondent’s DIF parameters. This later set of parameters tells us how each respondent uses the ideology rating response scale. Using these estimates, it is then possible to obtain DIF-adjusted estimates of each respondent’s perceptions of each politician based on their estimated individual shift and stretch terms. This is done simply by transforming respondent
 $i$
’s rating of politician
 $k$
, denoted as
 $z_{ik}$
according to
 $$\begin{eqnarray}x_{ik}=\frac{z_{ik}-\unicode[STIX]{x1D6FC}_{i}}{\unicode[STIX]{x1D6FD}_{i}}.\end{eqnarray}$$
In other words, the vignette anchors setup allows us to gain the benefits of the A–M framework—specifically adjusting ideology estimates for each respondent’s scale use—while also estimating each respondent’s perceptions of the ideological positions of various real world political actors. We simply transform their ratings by “undoing” the particular shift and stretch that each individual utilizes in her responses on the seven-point ideology response scale.Footnote
4
Specifically, for each iteration of the sampling procedure used to estimate the model’s parameters, we take the values of
 $\unicode[STIX]{x1D6FC}_{i}$
and
 $\unicode[STIX]{x1D6FD}_{i}$
for that iteration and, for each respondent’s perception of each politician
 $z_{ik}$
, use the formula in equation (2) to produce a corresponding draw from the posterior for each of these DIF-adjusted perceptions
 $x_{ik}$
. From these sets of posterior draws, we can easily obtain estimates (e.g. posterior means) and measures of uncertainty for each respondent’s DIF-adjusted perception of each politician.
These estimated perceptions can be used to answer important questions about whether different types of people tend to perceive political actors differently. Furthermore, these estimates can actually be used to test the assumption, inherent in the A–M approach, that respondents only differ in their scale use, but all respondents will perceive a given politician identically. Perhaps more interestingly, we can test not whether this statement is exactly true, but whether it is a reasonable approximation. For example, estimates from the vignette anchors approach can help determine how much of the variation in reported perceptions across respondents is attributable to DIF and how much is instead due to differences in actual perceptions of the ideology of the political actors being rated. In the following section, I apply this approach to data on Americans’ perceptions of parties, elected officials, and other political actors.
3 Application: Partisan Perceptual Differences in the 2016 CCES
Popular perceptions of political actors play a central role in democratic accountability. In particular, citizens must be able to form perceptions of the policy positions and overall ideologies of elected officials and candidates for office in order to vote in a way that encourages representation of their views. The work of Campbell et al. (Reference Campbell, Converse, Miller and Stokes1960) and others, however, emphasizes the role of partisanship as a “perceptual screen” through which citizens view the political world. If citizens’ political perceptions differ systematically and, in particular, if these systematic differences are strongly related to voters’ partisan predispositions, this could distort the basic mechanics of democratic accountability.
I use the vignette-based A–M model introduced above to investigate a key component of partisan perceptual influence in the United States, namely the degree to which individuals’ party identification (PID) relates to their perceptions of the ideology of politicians and political parties. The results show that while partisan differences in ideological evaluations have sometimes previously been attributed to DIF, under which survey different respondents perceive response scales in different ways, this cannot account for the partisan discrepancies found in perceptions of politicians’ ideologies. While partisanship does appear to be related to response scale use, this relationship is shown to be quite small in magnitude when compared with partisan differences in actual perceptions of political actors.
Specifically, while perceptions of more conservative political actors are similar for respondents of all PID, Democratic and Republican respondents perceive other politicians quite differently. Republican respondents perceive Democratic politicians and the Democratic Party as significantly more liberal than do Democratic respondents. These differences remain strong even after adjusting ratings for DIF using respondents’ ratings of anchoring vignettes. In a later section, I also show that these findings appear to hold similarly over the past several decades, although the partisan differences are estimated to be smaller in magnitude in earlier years.
Since the classic work of Converse (Reference Converse, Nieme and Weisberg1964), several notable accounts have been provided for how partisans may form evaluations of the ideology of political actors. Brody and Page (Reference Brody and Page1972) discuss projection, in which people assume that a politician who shares their party affiliation has the same views as themselves (see also Conover and Feldman Reference Conover and Feldman1982). Relatedly, Brady and Sniderman (Reference Brady and Sniderman1985) argue that respondents will tend to assign characteristics similar to their own to politicians they like and do the reverse for those they dislike. Levendusky and Malhotra (Reference Levendusky and Malhotra2015) show that people view opposing partisans as more ideologically extreme and Westfall et al. (Reference Westfall, Van Boven, Chambers and Judd2015) argue that perceptions of polarization differ based on respondent characteristics such as political engagement and strength of partisanship. Simas (Reference Simas2018) finds that individuals perceive more ideological heterogeneity within their own political party than in the opposing party. Other work has also focused on asymmetries in the nature of ideology between the two parties. For example, Grossmann and Hopkins (Reference Grossmann and Hopkins2016) argue that the modern Republican party can most appropriately be thought of as an ideological movement, while Democrats represent more of a coalition of group interests. These arguments might suggest that ideological perceptions may not be symmetric across the two parties.
Here, I focus on perceptions of overall ideology as represented by the so-called ideological scale. The use of ordinal ideology scales has a long history in American survey research, and questions regarding how liberal or conservative a political actor is perceived to be, as well as whether these perceptions differ by respondent characteristics such as partisanship, are of obvious importance. But it has long been known that different people may interpret the meaning of this scale in different ways (e.g. Brady Reference Brady1985). For example, Democratic respondents could associate a different meaning with a term such as “somewhat liberal” than do Republican respondents. Therefore, looking at the raw values of these placements may produce inappropriate conclusions if the observed differences result from some unknown combination of DIF and actual differences in perceptions.
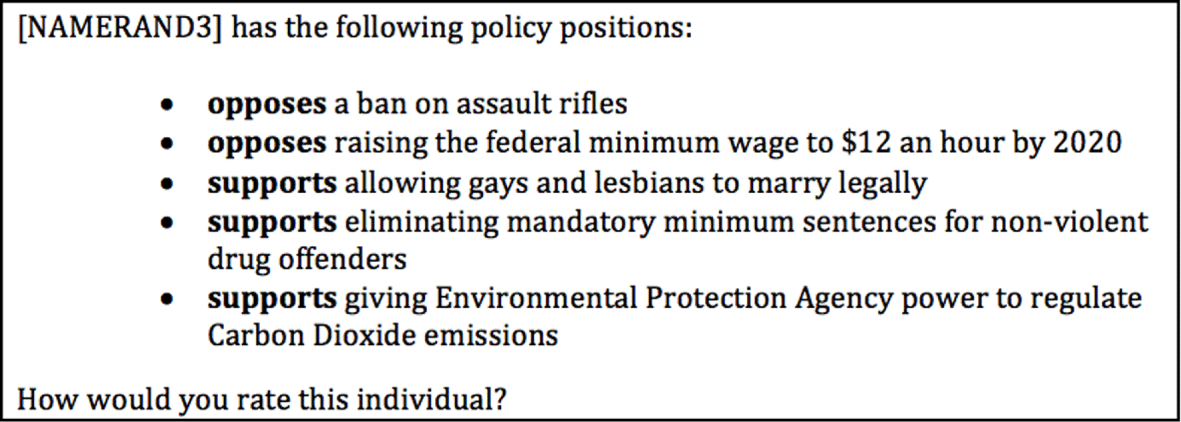
In order to assess how results from the standard A–M setup, which uses politicians, parties, or other political actors to anchor the ideological scale, change when using descriptions of hypothetical individuals (so-called vignettes), I analyze data from the University of Texas module of the 2016 CCES. This module was administered to 1000 respondents and included several sets of ideological placement items, each asking respondents to indicate a rating on a seven-point scale ranging from “very liberal” to “very conservative,” following the standard format.Footnote 5 In addition to rating their own ideology on this scale, respondents were asked to rate six specific politicians: Barack Obama, Hillary Clinton, Donald Trump, the Democratic Party, the Republican Party, and the Supreme Court.Footnote 6 Beyond these standard ideological rating questions, I also showed each respondent six vignettes, each one describing a hypothetical individual through their positions (support or oppose) on five different specific policies such as banning assault weapons, raising the minimum wage, or allowing same-sex couples to marry. The hypothetical vignettes, which were presented in random order to respondents, ranged from consistently liberal (five out of five policy positions) to consistently conservative (five out of five conservative positions). While some of the policies listed overlapped across vignettes, they were not identical. An example of these items, each of which described a person whose name was randomized from a list of six possible names, is shown in Figure 1.Footnote 7 The full list of questions, as well as a discussion of the motivation behind the design of these vignettes, is available in the online appendix.
Example of anchoring vignette. Respondents were given six of these hypothetical individuals and asked to rate each one on a 1–7 ideology scale. The full list of vignette wordings can be found in the appendix.

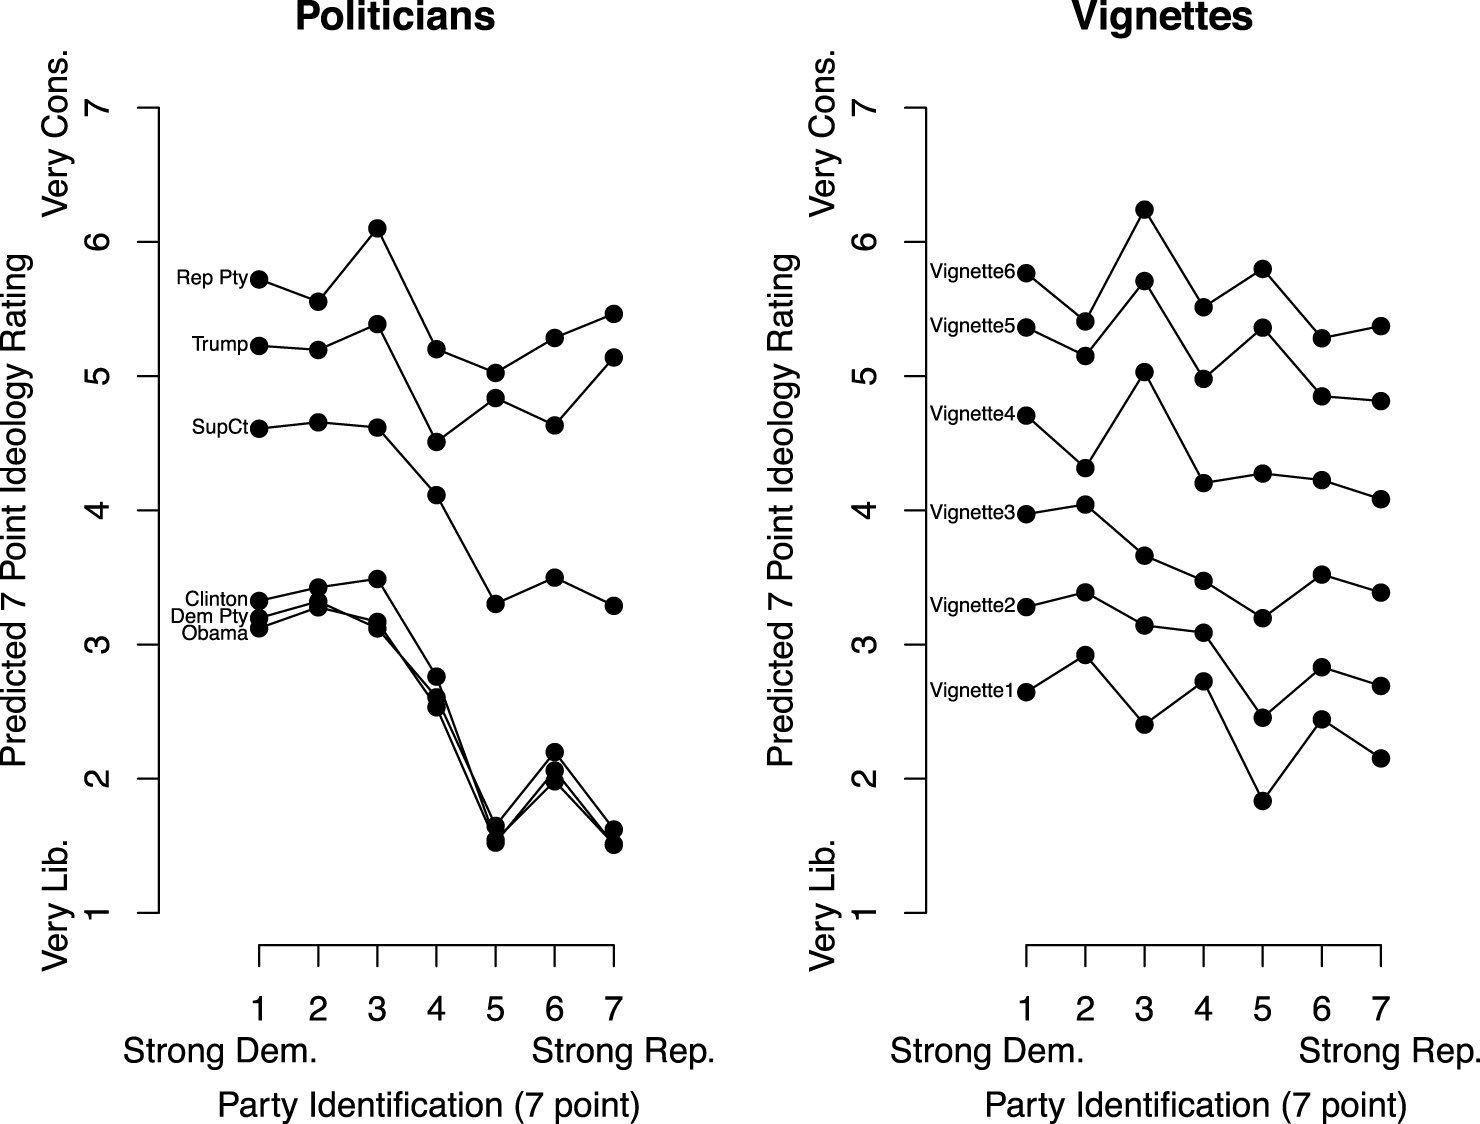
Figure 2 plots the average of raw (unadjusted) seven-point scale ratings of the six politicians (left pane) and the six vignettes about hypothetical individuals (right pane) separated by respondent PID.Footnote 8 The ratings of Obama, the Democratic Party, Clinton, and the Supreme Court show quite strong associations with PID. It is clear that Republican identifiers rate these stimuli as much more liberal on average than other respondents do. These partisan differences are much less prominent for ratings of Trump and the Republican Party.
Seven-point scale ratings of politicians and vignettes by PID. Left (right) panel plots averages of raw, i.e. unadjusted, seven-point ideology ratings for each politician (vignette) calculated separately for each respondent PID category. The appendix shows full question wordings for the six vignettes.

Ratings of hypothetical individuals, as described in the vignettes, show much smaller differences by respondent partisanship. This suggests that respondents’ scale use may not be the only, or even the primary, driver of these partisan differences in respondents’ ratings of politicians. If the differences, for example, the tendency of Republicans to rate more liberal stimuli quite differently from the way Democrats do, were due to differences in how Democratic and Republican respondents interpret the meaning of the rating scale’s values, we would expect to see similar partisan differences in their ratings of the vignettes.
The findings presented in Figure 2 are suggestive, but in order to better understand these patterns, we need a more rigorous analysis. The goal of this analysis is to asses whether the differences in scale use previously found between partisans in the United States (e.g. Aldrich and McKelvey Reference Aldrich and McKelvey1977, Hare et al.
Reference Hare, Armstrong, Bakker, Carroll and Poole2015) are actually due to DIF or whether they result from differences in actual perceptions. To this end, I estimate the model described in the previous section in two ways. First, I estimate the model in “politician anchors” setup that is standard in the A–M framework, where all respondents are assumed to view the six political actors identically, but respondents are allowed to differ in their use of the seven-point scale. In the notation of equation (1), the stimuli terms
 $\unicode[STIX]{x1D701}_{j}$
in this politician anchors setup represent the true underlying ideological positions (assumed to be invariant across respondents) of Obama, Clinton, and others, while
 $\unicode[STIX]{x1D6FC}_{i}$
and
 $\unicode[STIX]{x1D6FD}_{i}$
are the respondent-specific “shift” and “stretch” terms, respectively, describing how each respondent translates a stimulus’s underlying ideology into a seven-point scale rating. In this “politician anchors” setup, the data used (
 $z$
in equation (1)) is a matrix of ideological ratings, where each row represents a respondent and each column represents ratings of a given politician.
Second, I estimate the same model, but instead of using actual political actors to anchor the scale, I use the six vignettes describing the policy views of hypothetical individuals as the anchors. In this “vignette anchors” setup,
 $\unicode[STIX]{x1D702}_{j}$
from equation (1) represents the true position of a hypothetical individual described in a vignette, while
 $z_{ij}$
is respondent
 $i$
’s rating of the ideology of that hypothetical individual. The assumption in this setup is that respondents perceive these vignettes in the same way. This might be seen as more plausible given that they all receive the same information about each vignette. By contrast, respondents may differ in the information they have about actual politicians or parties and respondents may harbor biases, partisan or otherwise, that color their perceptions of real world political actors. In addition to resting on this more plausible anchoring assumption, the vignette anchors model allows for the estimation of DIF parameters
 $\unicode[STIX]{x1D6FC}_{i}$
and
 $\unicode[STIX]{x1D6FD}_{i}$
for each respondent while also providing estimates of each respondent’s perception of the ideology of politicians. This later quantity can be estimated by using the same approach typically used in the standard A–M setup to estimate a respondent’s ideology based on her ideological self-placement, given her estimated DIF parameters (see equation (2) above). Therefore, using the vignette anchors approach, it is possible to separate ordinary DIF from differences in the perceptions of politicians’ ideologies. In this “vignette anchors” setup, the data used (
 $z$
in equation (1)) is a matrix of ideological ratings, where each row represents a respondent and each column represents ratings of a given hypothetical individual as described in a vignette.
Both the standard “politician anchors” model and the “vignette anchors” model are estimated using JAGS (Plummer et al. Reference Plummer, Hornik, Leisch and Zeileis2003). Each estimation begins with 50,000 burn-in iterations which are discarded, then 250,000 iterations are run, storing every 50th iteration for a total of 5000 iterations saved. Multiple convergence and sampling diagnostics suggest that the sampler converged properly and that the number of iterations stored was sufficient. Replication data and code is available on the Political Analysis Dataverse.
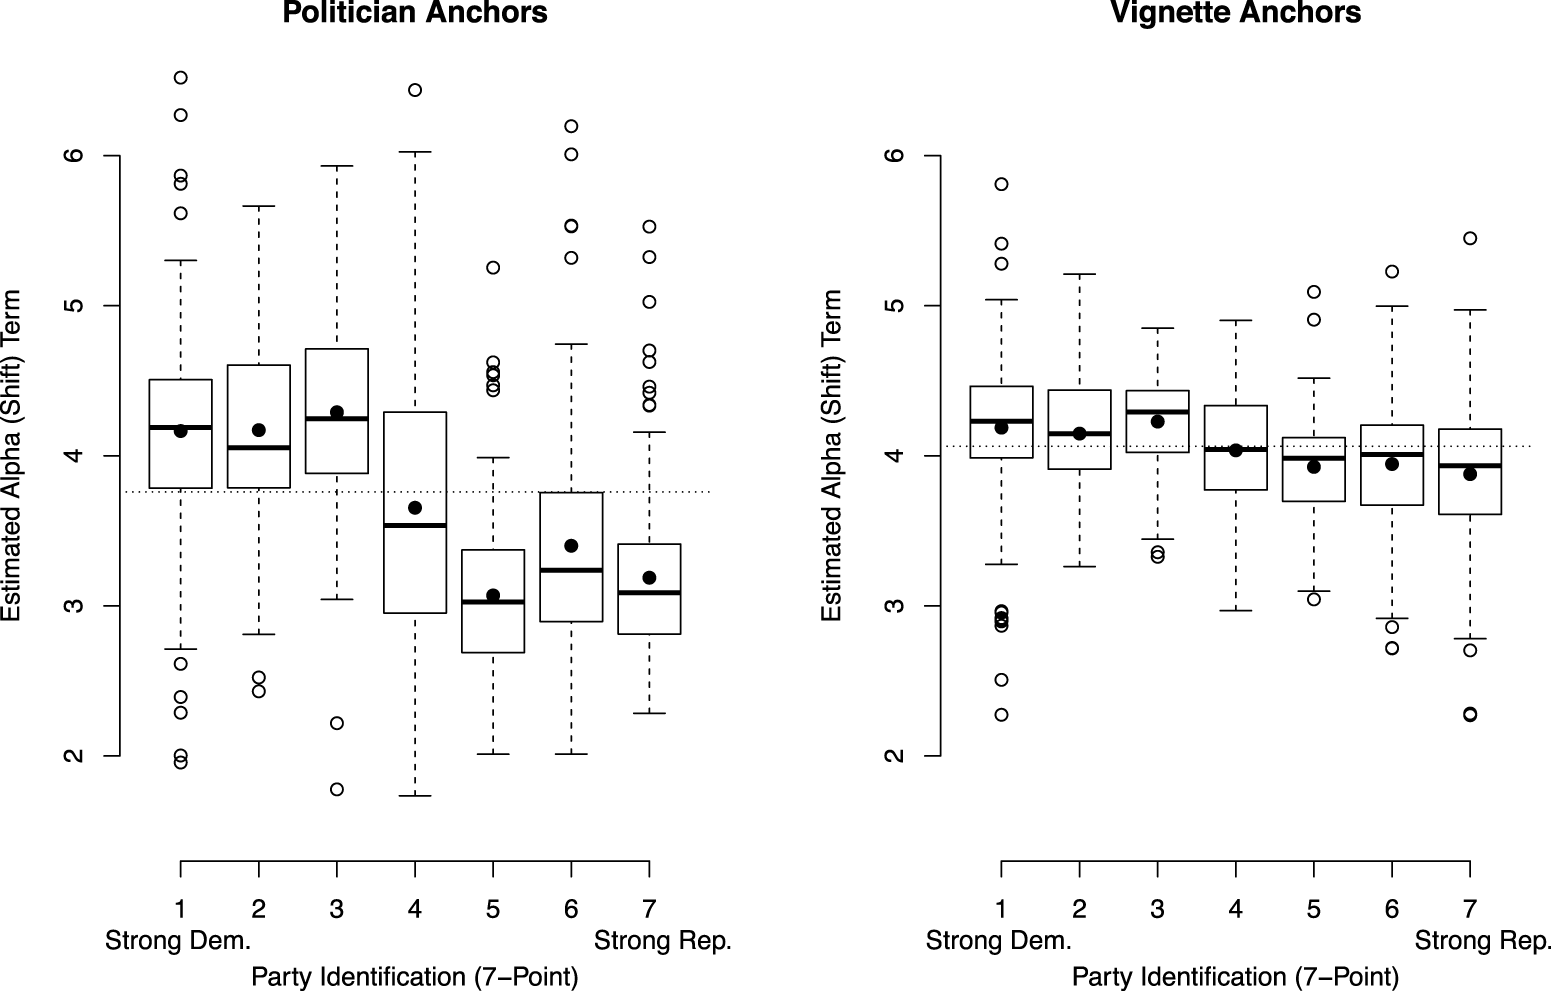
Boxplots of alpha (shift) term by partisanship for politician anchors and vignette anchors estimates. Horizontal tick marks indicate PID category medians and solid dots indicate PID category means. Horizontal dashed lines indicate overall means for all respondents.

Figure 3 plots estimates (posterior means) for respondent-specific
 $\unicode[STIX]{x1D6FC}_{i}$
(shift) parameters from the model estimated under the politician anchors setup and, separately, those estimated under the vignette anchors setup against respondents’ PID.Footnote
9
As the left panel shows, the standard politician anchors approach produces shift parameter estimates that differ strongly by PID. Democratic respondents have much higher
 $\unicode[STIX]{x1D6FC}_{i}$
values than Republicans do, with independents falling in between. This finding is broadly consistent with Hare et al. (Reference Hare, Armstrong, Bakker, Carroll and Poole2015) and has been interpreted as showing that Democrats and Republicans interpret the seven-point scale and its terminology such as “very liberal” or “somewhat conservative” differently.Footnote
10
But as discussed above, these partisan differences could be due to ordinary DIF or due to Democrats and Republicans perceiving politicians as having different ideologies. The standard A–M setup cannot arbitrate between these two possibilities because it estimates the DIF parameters by assuming that all respondents perceive a given politician’s ideology as being the same on the underlying ideology scale.
The right panel of Figure 3 shows estimates of the same shift parameters by PID, this time from the vignette anchors setup. Although there remain partisan differences, they are much smaller in magnitude than in the politician anchors model. This suggests that while there are some differences in the ways that Democratic, Republican, and independent respondents utilize the ideological rating scale, much of the partisan difference estimated in the candidate anchors setup was not true DIF but rather differing perceptions of the candidates.
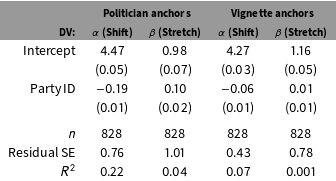
We can also look at these relationships in a more formalized way. Table 1 shows the results of linear regression predicting shift parameters with PID under the candidate anchors and vignette anchors setups. In both cases, there is a negative and highly significant coefficient estimated on PID, but the magnitude is much larger for the politician anchors parameters. Furthermore, the proportion of the shift parameter’s variance across respondents that is explained by PID is roughly three times larger in the politician anchors estimates than in the vignette anchors setup.
Relationship between shift or stretch parameters and party identification for politician anchors and vignette anchors models. Table shows estimates from linear regression models predicting either shift (
 $\unicode[STIX]{x1D6FC}_{i}$
) or stretch (
 $\unicode[STIX]{x1D6FD}_{i}$
) terms from politician anchors and vignette anchors models.

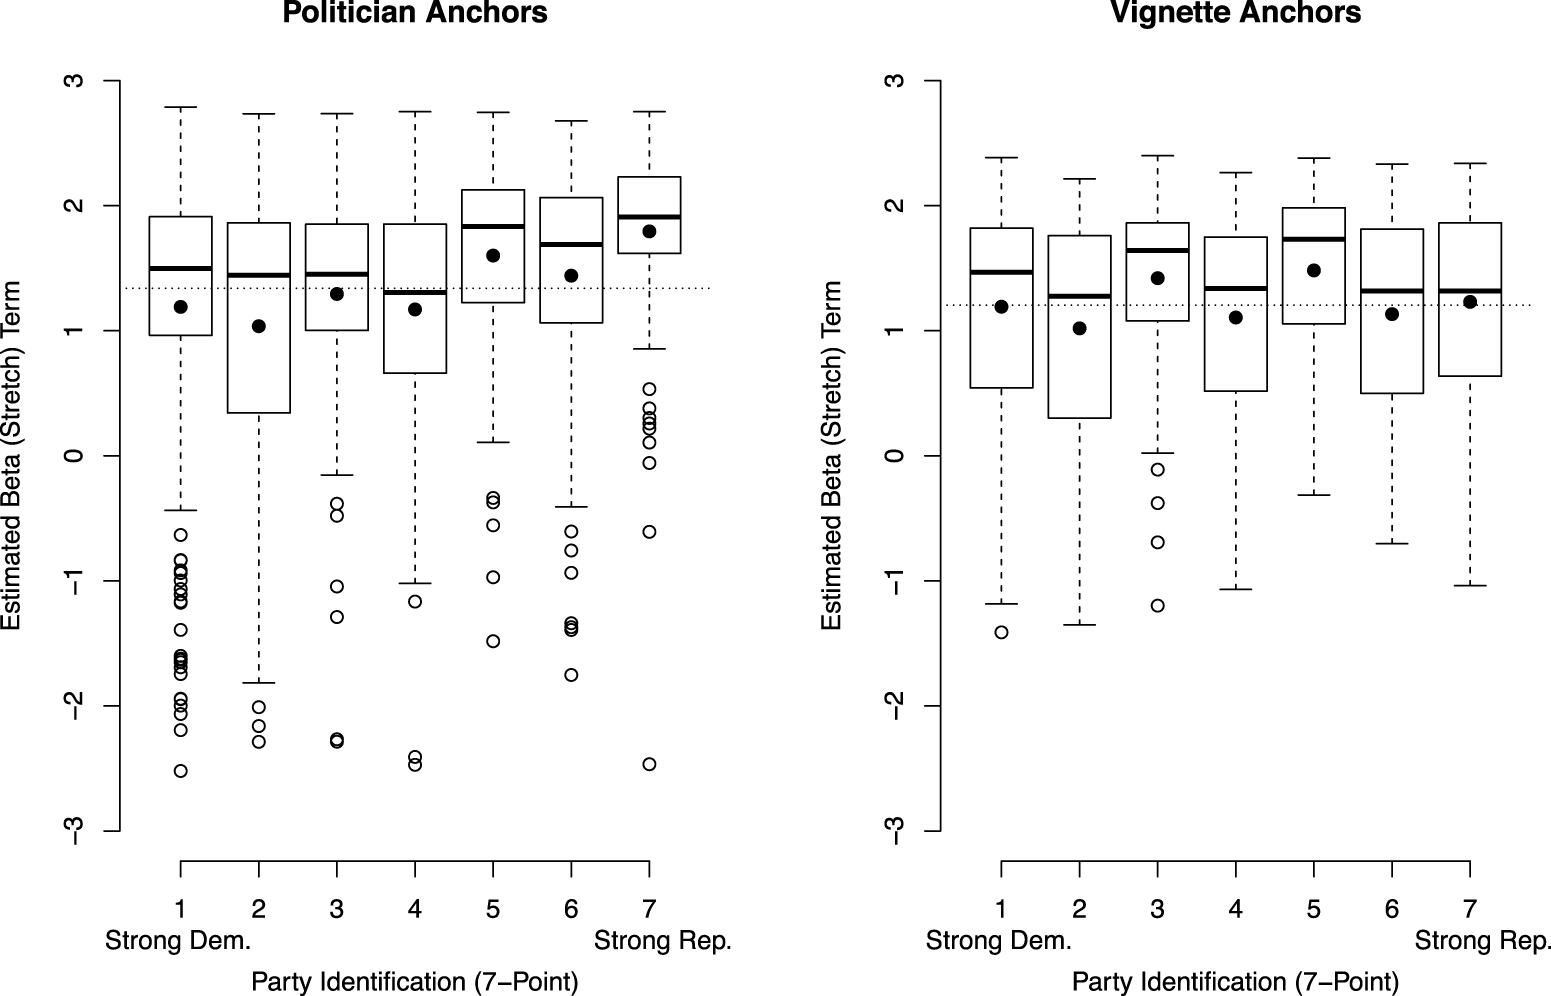
Figure 4 plots estimates of the stretch (
 $\unicode[STIX]{x1D6FD}_{i}$
) parameters against PID from the two setups. For the politician anchors setup, Republicans appear to have a larger stretch term, meaning that increasing the ideology of a politician by a given amount would cause them to increase their seven-point scale rating more than a Democrat would. The vignette anchors estimates, by contrast, do not show a strong relationship between PID and the stretch terms. Table 1 also shows the results of linear regressions predicting the stretch parameters with PID for both politician anchors and vignette anchors estimates. The corresponding vignette anchors estimates of
 $\unicode[STIX]{x1D6FD}_{i}$
show essentially no relationship with respondents’ partisanship.
Boxplots of beta (stretch) term by partisanship for politician anchors and vignette anchors estimates. Horizontal tick marks indicate PID category medians and solid dots indicate PID category means. Horizontal dashed lines indicate overall means for all respondents.

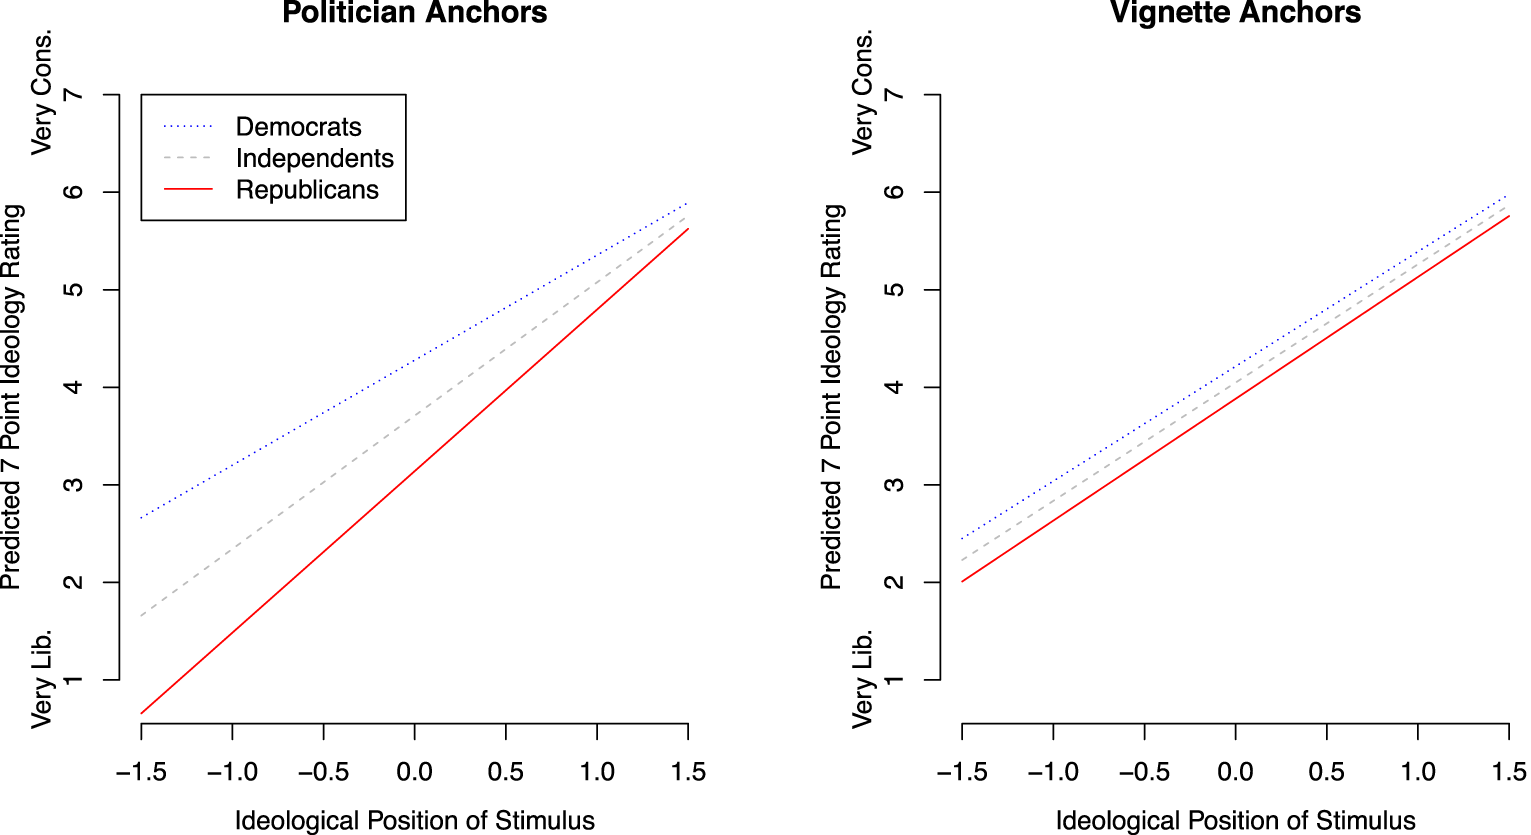
Another way to look at these results is to ask what the predicted relationship would be between a politician’s or vignette’s underlying ideological position (
 $\unicode[STIX]{x1D701}_{j}$
) and respondents’ seven-point ratings of them for Democrats, independents, and Republicans. Figure 5 plots these predicted relationships, using the fitted values for the shift and stretch terms for strong Democrats, pure independents, and strong Republicans, based on Table 1’s estimates. The left panel of Figure 5 plots relationships based on the politician anchors setup. The most obvious feature of this plot is the high degree of divergence between partisans, particularly when evaluating more liberal politicians. For example, a politician at
 $-1$
(roughly where Obama’s ideological position is estimated under the politician anchors setup) would be predicted to be rated nearly two points more liberal on the seven-point scale by a strong Republican than by a strong Democrat—an expected rating of 1.5 compared to 3.2, with independents falling roughly midway between the two partisan groups. This divergence narrows as respondents assess more conservative stimuli such that a Democratic and a Republican respondent presented with a stimulus whose ideology is 1.28 (the estimated position of the Republican party from the politician anchors setup) would differ by 0.4 in their expected seven-point rating. While this difference is still important, the partisan difference in ratings of conservative stimuli is less than one-fourth the size of the difference for a more liberal one.
Predicted seven-point scale ratings of stimuli as a function of underlying ideology, by respondent PID, from politician anchors (left pane) and vignette anchors (right pane) estimation. The left panel plots predicted ratings of a politician as a function of the politician’s underlying ideology based on the average respondent-specific intercept and slope estimates from the politician anchors setup (where
 $\unicode[STIX]{x1D6FC}_{i}$
and
 $\unicode[STIX]{x1D6FD}_{i}$
are estimated based on respondents’ ratings of politicians). The right panel plots predicted ratings of a vignette as a function of the vignette’s underlying ideology based on the average respondent-specific intercept and slope estimates from the vignette anchors setup (where
 $\unicode[STIX]{x1D6FC}_{i}$
and
 $\unicode[STIX]{x1D6FD}_{i}$
are estimated based on respondents’ ratings of vignettes).

As discussed above, however, the standard politician anchors setup of the A–M model assumes that all respondents view the ideology of a given political actor in the same way. This results in the shift and stretch parameters capturing not only DIF in its traditional form—people interpreting and using the seven-point scale values differently—but also any partisan differences in perceptions of the actors’ ideological positions. In other words, the large partisan differences between the seven-point scale ratings of a liberal stimulus could be due to Democrats thinking of terms like “very liberal” or “somewhat liberal” in different ways than Republicans do. But this same pattern could also result from partisan respondents understanding the meaning of the response scale identically but perceiving politicians’ ideologies differently.
By contrast, the vignette anchors setup estimates the DIF parameters (
 $\unicode[STIX]{x1D6FC}_{i}$
and
 $\unicode[STIX]{x1D6FD}_{i}$
) for each respondent based on the assumption that they perceive the hypothetical vignettes, rather than real politicians or parties, similarly. As Figures 3 and 4 as well as Table 1 showed, the partisan differences in the shift and stretch terms for the vignette anchors setup are much smaller than that in the politician anchors setup. The right panel of Figure 5 plots the expected ratings under the vignette anchors setup for strong Democrats, strong Republicans, and independents as a function of a stimulus’s underlying ideology (
 $\unicode[STIX]{x1D701}_{j}$
). While some partisan difference exists, these differences are much smaller than those estimated under the assumption that all respondents perceive politicians identically.
Appendix section A3 presents the results of additional regression specifications predicting these DIF terms. Most notably, the strong relationship between the shift terms and PID remains when controlling for political interest, education, and a policy-based ideology measure. Ideology does not appear to predict either of the DIF terms and does not meaningfully change the estimated coefficient on partisanship under any of these new specifications. The relationship between partisanship and these
 $\unicode[STIX]{x1D6FC}_{i}$
terms is estimated to be stronger for respondents who report being more politically interested. It is also shown that the shift terms are larger in magnitude for more politically interested respondents, although this relationship is strongest in magnitude for Democrats. The estimated coefficient for strong Republicans on political interest for predicting these
 $\unicode[STIX]{x1D6FD}_{i}$
terms is much smaller in magnitude and not statistically significant at the 0.05 level. While the findings presented in the Appendix are exploratory in nature, they suggest potential for future study, including looking at whether the sources of political information (e.g. Fox News vs. MSNBC) may impact the interpretation or use of these ideology rating scales.
These results suggest that the vast majority of what was estimated as partisan DIF in the politician anchors setup is actually due to partisan differences in the perceptions of politicians and parties, particularly when evaluating more liberal stimuli, rather than differing interpretations of the rating scale itself. To investigate this more directly, we can examine the estimated perceptions of politicians, calculated based on the formula in equation (2) above, including whether they differ significantly by respondent partisanship.
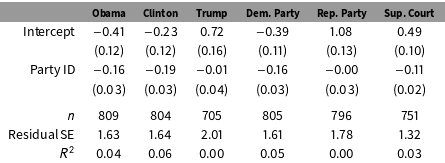
Table 2 presents the results of six regression models, each one predicting respondents’ estimated perceptions of a given stimulus under the vignette anchors setup with seven-point PID.Footnote
11
Most notably, the coefficients on PID are negative, highly statistically significant, and relatively large in magnitude for all of the stimuli except Trump and the Republican Party. For example, each unit increase in a respondent’s PID (e.g. from “strong Democrat” to “weak Democrat”) is estimated to move their perception of Obama by
 $-0.16$
. This translates in a difference between strong Democrats and strong Republicans of nearly one unit on the latent scale or, roughly, the distance between the position of the most liberal vignette (someone taking five consistently liberal policy positions) and the third most liberal one (someone taking liberal positions on three out of five specific policies). The relationship between perceptions and PID are similar for Clinton and the Democratic Party and, to a somewhat lesser extent, for perceptions of the Supreme Court. Interestingly, perceptions of Trump and of the Republican Party show little, if any, partisan difference, with coefficients on PID in both of these models being estimated quite close to zero and not coming near statistical significance.
Relationship between estimated perception of politician ideologies from vignette anchors model and party identification. Columns show results of linear regression models for respondents’ estimated perceptions (posterior medians) for each political actor as predicted by seven-point party identification.

These regression results are consistent with the results in Figure 5 and they confirm that much of the so-called partisan DIF estimated by the A–M model under the standard politician anchors setup is not actually driven by differential use of the ideological rating scale but, instead, by differential perceptions of politicians, parties, and other political stimuli. Republican respondents do tend to utilize the seven-point ideological rating scale differently from independents or Democrats. But these scale use differences are much smaller in magnitude than the partisan differences in perceptions of the ideology of politicians or parties. To put it differently, the right panel of Figure 5 suggests that DIF is unlikely to be a major driver of partisan differences in ideological ratings of politicians given that scale use differences should show up in the ratings of the hypothetical individuals’ ideologies, but only very small partisan differences are observed for vignette ratings.
The estimates from the vignette anchors setup demonstrate that the common perceptions assumption that is implicit in the standard A–M setup does not hold for Americans evaluating the ideology of politicians, political parties, and other stimuli. While relatively small differences observed between Democratic, independent, and Republican respondents’ ratings of the ideology of Trump or the Republican Party appear to be driven mainly by differing use of the response scale (i.e. standard DIF), the large partisan divergence in ratings of more liberal stimuli are not principally the result of partisan DIF but, instead, are overwhelmingly driven by large partisan divergence in actual perceptions of the ideology of these stimuli. Republican respondents perceive these stimuli, such as Democratic politicians, the Democratic Party, and even the Supreme Court, as being much more liberal than do Democratic respondents.
4 The Relationship Between Respondent Partisanship and Ideological Ratings of Parties Over Time
The above analyses provide strong findings about partisan differences in ideological perceptions. But the 2016 presidential election campaign, during which these data were gathered, was a unique political environment to say the least. In this section, I examine whether the patterns identified in 2016 appear similar in previous years going back nearly a half century. In other words, is it the case that in past years, Republicans tended to perceive the Democratic Party as much more liberal than did Democratic and independent identifiers, while perceptions of the Republican Party differed minimally by respondent partnership?
Obviously, previous surveys like the ANES do not typically include vignette questions of the type required to estimate the model used above. But by looking at basic associations between respondents’ partisanship and their ideological ratings of the parties, we can see whether these patterns were similar in previous years to the ones identified above for 2016. If this is the case, it might imply that these findings are more general. Furthermore, if one is willing to assume that the findings above of very small partisan differences in scale in 2016 also hold in previous years (a strong assumption to be sure), then the raw seven-point ideology ratings of each of the parties can be viewed as a reasonably good measure of respondents’ actual underlying perceptions—ones that can meaningfully be compared across respondents. In other words, if partisan differences in interpretation and use of the rating scale are minimal, looking at these raw ratings should produce similar findings to what would have been found if we were able to estimate the full vignette anchors adjustments used above. Obviously it is possible that in previous years, partisan differences in scale use were much larger, so the findings in this section should be interpreted with some caution. But even if one does not want to maintain “minimal partisan DIF” assumption over time, it may still be interesting to examine the characteristics of the raw ideological ratings of the two parties for their own sake.
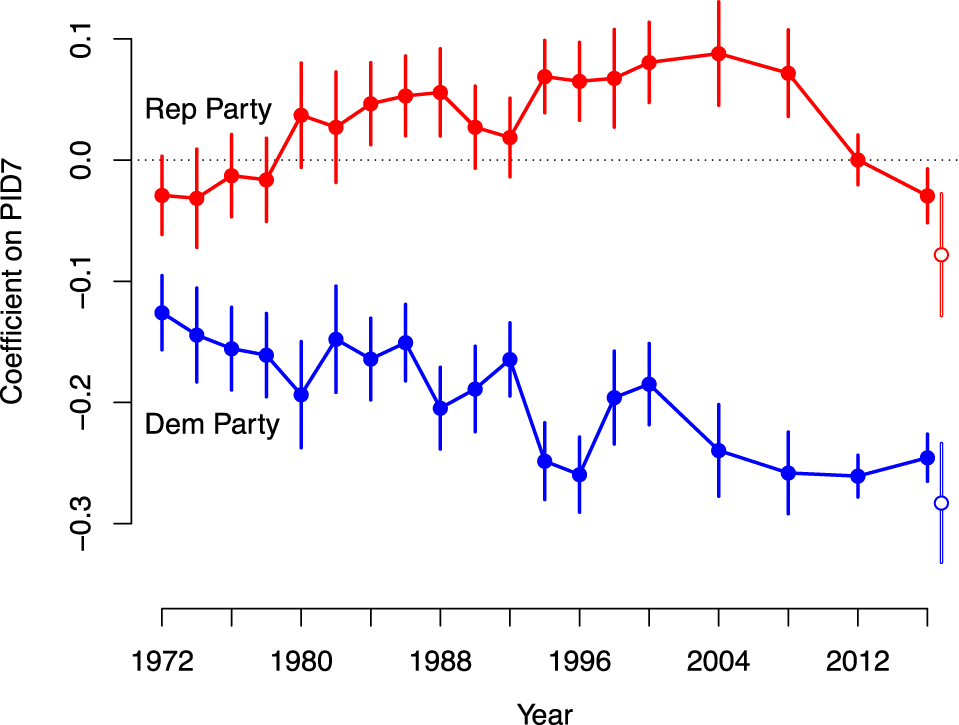
Here I present the results of simple regression analyses using the ANES time series cumulative file. Since 1972, respondents have been asked to rate the ideologies of the Democratic and Republican parties on a seven-point ideology scale.Footnote 12 In each of these years, I estimate linear regressions predicting respondents’ ideological ratings of the Democratic Party and, separately, the Republican Party, each using PID as the only predictor. Figure 6 plots the estimated slope coefficients from each of these separate bivariate regressions. These coefficients represent the change in perceptions of the party (Democrat or Republican) that would be expected to result from moving up the seven-point PID scale one unit based on a given year’s data.
Coefficients on party identification predicting ideological ratings of Democratic and Republican Party by year of ANES. Dots indicate estimated coefficients and vertical line segments show 95% confidence intervals. The rightmost point shows corresponding estimates from University of Texas module of 2016 CCES used in the previous sections.

As found in the 2016 CCES data above, Republican respondents in each year of the ANES rate the Democratic Party as significantly more liberal than Democratic respondents do, as evidenced by the negative coefficient estimates on PID predicting perceptions of the Democratic Party in each year. There is also evidence of a general time trend, with this partisan divergence in perceptions of the Democratic Party growing larger in magnitude (more negative) in more recent years. In 1972, for example, the slope estimate for perceptions of the Democratic Party is
 $-0.13$
. This implies that moving a respondent’s PID from strong Democrat to strong Republican would be expected to make their rating of the Democratic Party roughly three quarters of a point more liberal. In 2016, the corresponding slope coefficient is estimated to be
 $-0.25$
—almost double the 1972 estimate—which translates to a nearly one and a half point difference in expected seven-point scale ratings. There are many potential explanations for this trend such as increased ideological sorting including the decline of the southern wing of the Democratic Party, which future research could explore. This difference could also be related to the fundamental asymmetry in the nature of ideology and group interest motivating the two parties in contemporary American politics, as discussed by Grossmann and Hopkins (Reference Grossmann and Hopkins2016).
Perceptions of the Republican Party, by contrast, show much smaller relationships with respondent partisanship. In many of the years analyzed, we cannot reject the null hypothesis of no relationship between PID and perceptions of the Republican Party at conventional significance levels. There is some evidence of time trends, with this coefficient being estimated as positive (and usually significant) between 1980 and 2008. Most notably, all of the estimates for perceptions of the Republican Party are much closer to zero than are any of those for perceptions of the Democratic Party, indicating that partisanship is a much weaker predictor of perceptions of the Republican Party than perceptions of the Democratic Party in all of these years.
The corresponding coefficient estimates using the same 2016 CCES data analyzed in the previous section instead of ANES data are plotted with hollow dots on the far right of Figure 6. Interestingly, these 2016 CCES estimates are similar to those based on the 2016 ANES, albeit with larger confidence intervals due to the smaller sample size. Of course, the results in Figure 6 are not adjusted for DIF in the same way that the previous sections’ results are because the ANES study does not include the vignettes necessary to do so. To the extent that one believes that the results from the 2016 CCES presented above, which show minimal partisan differences in response scale use, apply to the ANES study, including those dating back several decades, this may not be problematic. But this is of course quite a strong assumption, so these results should be interpreted with some caution.
5 Discussion
The approach used here modifies the classic model of Aldrich and McKelvey in a way that results in several advantages. First, it is possible under this new vignette anchors framework to estimate each respondent’s perceptions of the ideology of politicians, while also adjusting these perceptions to account for possible differences in the way that different respondents may interpret and use the response scale on which they report these ideological perceptions. Under the existing A–M approach, estimation of respondent-specific DIF was only possible by assuming that all respondents perceive a given politician in the same way. This approach used here thus provides a way of assessing the plausibility of this identical perceptions assumption. Applying the vignette anchors modeling framework to a dataset including respondents’ ratings of the ideology of US political actors, I find strong and important differences in the perceptions of politicians by different respondents. This finding casts doubt on this key assumption of the A–M framework.
Furthermore, it is shown that the assumption that respondents perceive hypothetical individuals described in vignettes in the same way is much more plausible (even if not exactly true) than the assumption that respondents perceive actual politicians identically. This suggests that partisans tend to have similar understandings on average of the terms “liberal” and “conservative,” at least with respect to collections of policy positions described for hypothetical individuals. By contrast, their perceptions of prominent politicians and other political actors show notable differences by respondent PID. These findings can provide new nuance to the arguments of Converse (Reference Converse, Nieme and Weisberg1964), as well as others such as Kinder and Kalmoe (Reference Kinder and Kalmoe2017), about the mass public’s understanding of the ideological map of American politics. It may be too simple to say that citizens do not hold realistic ideological understandings of the American political landscape, but rather that their understandings may be realistic in some respects, but importantly distorted by partisanship in others.
Most notably, the results presented above show that large differences exist between the perceptions of Democrats and Republicans. In particular, respondent partisanship is strongly related to perceptions of more liberal politicians and the Democratic Party as well as the Supreme Court. Perceptions of more conservative political actors, by contrast, show little or no partisan difference. Some have suggested that these sorts of partisan discrepancies are attributable to DIF, in which partisanship affects the way respondents perceive and use the survey response scales. But using novel survey data in which respondents rate the ideology of hypothetical individuals described by their policy positions, I find that partisan scale use differences are relatively small. Even after adjusting for these scale use differences, the vast majority of the large partisan differences in respondents’ ideological perceptions remain.
The results presented beg the question of what mechanism produces these strong partisan differences as well as why there is little difference, if any, between Democratic and Republican respondents’ perceptions of more conservative political actors. Although we do not have conclusive findings on this front, several possibilities seem plausible and future work should focus on arbitrating between these various explanations. First, there likely exists a fundamental asymmetry between the labels used for the two sides of the ideological scale. In recent decades, in particular, the term “liberal” has been assigned negative connotations, particularly by Republicans. For example, Schiffer (Reference Schiffer2000) refers to the “popular stigmatization of the word ‘liberal’” (see also Neiheisel (Reference Neiheisel2016) for related experimental results). This possibility is also related to the findings of Bullock et al. (Reference Bullock, Gerber, Hill and Huber2015) and Prior et al. (Reference Prior, Gaurav and Khanna2015), who argue that much of the partisan divergence in factual beliefs about politics can be attributed to expressive actions—the so-called partisan “cheerleading” in which respondents derive utility from making statements that reflect positively on their own party or negatively on the opposing party, even if they may not believe these statements to be accurate.
In contrast to the perception-based perspective on ideology taken here, other research has also measured ideology using more objective policy stances taken by political actors (see e.g. Bafumi and Herron Reference Bafumi and Herron2010, Jessee Reference Jessee2012, Shor and Rogowski Reference Shor and Rogowski2016, Tausanovitch and Warshaw Reference Tausanovitch and Warshaw2018). As shown in the Appendix (Section A2), similar estimates for politicians and vignettes are obtained whether one uses the perception-based approach of the vignette anchors model or a policy-based approach as estimated through a standard ideal point model. This suggests that, aside from the important partisan differences in perceptions that have been identified here, the average perceptions of political actors’ ideologies correspond closely with the ideological positions implied by the actors’ respective positions on specific policies. Although further work is needed to examine this more fully, this finding might be thought to suggest that on balance, the American public on average has a relatively accurate understanding of the positions taken by politicians, parties, and other political actors. But underlying these on average perceptions are important partisan differences. An interesting question would be whether certain types of political actors are perceived more similarly by Democrats and Republicans than others. Although the results above show that partisan differences for perceptions of Republican actors are smaller than those for others, determining whether other types of stimuli show larger or smaller partisan perceptual differences would require a survey in which respondents rate the ideology of many more political actors.
Going forward, future research can use the approach employed here to learn about how different people may perceive stimuli differently. In particular, this approach allows for the estimation of respondent-specific perceptions that are also adjusted based on each respondent’s particular scale use characteristics. While the results presented here shows that the central assumption of the A–M framework appears to be strongly violated when analyzing Americans’ perceptions of prominent political actors (the specific context in which the A–M approach was developed), it is possible that this common perceptions assumption is more plausible in other contexts. It may also be the case that although DIF was found to be a relatively small issue in this application, it could be a much bigger factor in other applications. For example, King et al. (Reference King, Murray, Salomon and Tandon2004) use anchoring vignettes to allow for cross-cultural comparisons of concepts like political efficacy, finding that DIF-adjusted measures produce very different results than do raw (unadjusted) measures. One could imagine using this approach in the comparative context to, for example, explore cross-country or cross-party differences in perceptions related to European Union politics or in other international contexts. The vignette anchors framework introduced here presents a straightforward way of assessing this assumption’s plausibility as well as learning about possible differences in the perceptions of different types of respondents, a quantity that is often of important theoretical interest.
Acknowledgements
I thank Chris Hare, Neil Malhotra, and Elizabeth Simas for helpful feedback.
Conflicts of interest
The author declares no conflicts of interest related to this project.
Data availability
Replication data and code for this paper can be found at Jessee (Reference Jessee2019).
Supplementary material
For supplementary material accompanying this paper, please visit https://doi.org/10.1017/pan.2019.47.