Introduction
Due to the limited availability of water and fluctuating and extreme evapotranspiration patterns, there is a need to improve irrigation efficiency through modern agricultural practices such as Precision Agriculture (PA). Proper scheduling of irrigation is crucial for efficient water management in crop production, particularly under conditions of water scarcity (Pereira et al., Reference Pereira, Oweis and Zairi2002). Water Use Efficiency (WUE) is one of the key parameters which provide information on irrigation efficiency (Montazar and Sadeghi, Reference Montazar and Sadeghi2008). Accurate WUE of crops can be modeled based on crop water requirement, available water resources, soil water infiltration rate and variability of agro-meteorological information such as energy fluxes and evapotranspiration (Bezerra et al., Reference Bezerra, Bezerra, Silva and Santos2015). On the other hand, proper documentation of irrigation scheduling practices is essential for improving crop yield and/or WUE with respect to irrigation times and amounts of water applied per growth season (Qiu et al., Reference Qui, Wang, He, Zhang, Chen, Chen and Yang2008; Al-Ghobari et al., Reference Al-Ghobari, Mohammad and El Marazky2013).
The Eddy Covariance (EC) technique to measure CO2, water and energy fluxes between the biosphere and the atmosphere is widely used in various agricultural monitoring studies (Ji et al., Reference Ji, Zaho, Kang, Zhang and Jin2011; Gilmanov et al., Reference Gilmanov, Baker and Bernacchi2014). WUE, the rate of carbon uptake per unit of water lost, precisely quantifies how much water an ecosystem uses relative to the gained carbon. In general, WUE of agricultural crops differ from each other with respect to their contribution to CO2 and H2O fluxes (Gilmanov et al., Reference Gilmanov, Baker and Bernacchi2014). Continuous observations of carbon and water fluxes using EC system can be used to characterize the variability in WUE as the ratio of the productivity (i.e. gross primary productivity – GPP, net primary productivity – NPP, net ecosystem productivity – NEP, etc.) to the evapotranspiration (ET), Tang et al. (Reference Tang, Ding, Li, Li, Luo, Xie and Chen2015).
In Saudi Arabia, alfalfa (Medicago sativa L.) is one of the major fodder crops cultivated under center pivot irrigation systems. As water management under hyper-arid, arid and semi-arid regions is a challenging aspect, optimum irrigation scheduling to agricultural crops is critical for improving irrigation efficiency (i.e. WUE). In order to achieve optimum irrigation schedules and patterns, seasonal dynamics of WUE of alfalfa was monitored with respect to the changing agro-meteorological conditions in the Eastern region of Saudi Arabia. Therefore, this study was carried out, during the period from June 2013 to May 2014, to understand the temporal dynamics of net ecosystem productivity (NEP), ET and WUE of alfalfa, by analyzing the EC measured CO2 and H2O fluxes, in order to optimize the use of irrigation water. The specific objectives of this study were: (i) to explore the temporal dynamics of alfalfa CO2 assimilation and evapotranspiration through H2O flux and (ii) to understand the temporal changes in WUE of alfalfa for the optimization of the irrigation management practices.
Materials and methods
Site description
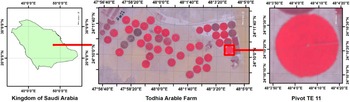
A 50 ha center pivot irrigated alfalfa field was considered for this study. The experimental field belongs to Todhia Arable Farm (TAF) located in the Eastern Province of Saudi Arabia within the latitudes of 24°10'22.7' and 24°12' 37.2'N and the longitudes of 47°56'14.6' and 48°05' 08.56'E (Figure 1). The study area experienced arid climates with hot summers (40±2°C) and cold to moderate winters (15±3°C) with a mean air temperature of 35°C. The long term mean annual rainfall (1998–2013) was about 90 mm, most of which occurred in the period from November to February.
Location map of the study area – Todhia Arable Farm.

Due to the high crop water demand along with the highly erratic rainfall, irrigation is supplemented by under groundwater through bore wells. The major crops cultivated in the study area were forages (alfalfa, Rhodes grass and corn) and vegetable crops (carrot and lettuce).
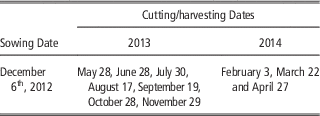
The experimental field of sandy loam soil was cultivated with alfalfa crop (Green Master) sown on December 6th, 2012 at a seeding rate of 20 kg ha−1 and irrigated with groundwater using a center pivot system. Cutting dates of alfalfa crop are provided in Table 1.
Alfalfa sowing and harvesting (cutting) dates for field number TE11

Irrigation Scheduling
Irrigation requirement was worked out based on daily mean ET values (1998–2013) for the study farm. Frequency of irrigation varied from one to four days. Crop water requirement (CWR) or crop evapotranspiration (ETc) was calculated by multiplying the reference crop evapotranspiration (ETo) by the crop coefficient (Kc), as in Equation (1) as described by Allen et al. (Reference Allen, Pereira, Raes and Smith1998). The irrigation schedules were prepared based on the climatic conditions with the assistance of CROPWAT (Ver. 8.0).
 $${\rm CWR}\, {\equals}\, {\rm ET}_{{\rm c}} \, {\equals}\, {\rm ET}_{{\rm o}} {\times}{\rm K}_{{\rm c}} $$
Eddy Covariance (EC) System
The EC system (Li-COR, Lincoln, NE, USA) was installed over the selected alfalfa field. The EC tower was set up, at a measuring height of 3.67 m, on May 27th, 2013. EC data collected in the period from June 2013 to April 2014 was used for this study. The tower was equipped with response sensors (slow and fast) including an open-path gas analyzer, a 3-axis ultrasonic anemometer, soil heat flux plates, a pyranometer for the measurements of solar radiation flux density and a quantum sensor to measure photosynthetic photon flux density (PPFD) used for the determination of Photosynthetically Active Radiation (PAR).
EC data collection and Analysis
Continuous fast responses of CO2, H2O and heat fluxes above the alfalfa canopy were measured by an open-path gas analyzer at a frequency of 10 Hz. Subsequently, slow response measurements of meteorological parameters (such as wind speed, wind direction, air temperature, relative humidity, vapor pressure deficit (VPD), incoming solar radiation and soil heat flux) were recorded and averaged for every 30 minutes. Flux computations, utilizing the collected raw data, were carried out using Eddypro Express post-processing software program (version 5.0, LI-COR, USA). During the analysis, correction of low-pass filtering effects and spike removal were carried out, and the options were set for allowing the omission of 10% of missing samples (Burba and Anderson, Reference Burba and Anderson2007). The collected data were subjected to quality check, and data gaps due to system failure or data rejection were filled in using standardized methods to provide complete data sets (Moffat et al., Reference Moffat, Papale and Reichstein2007).
The recorded CO2 and H2O fluxes, expressed as g m−2, were utilized to calculate the daily, harvest-wise and seasonal sums. Subsequently, the corrected CO2 flux was partitioned into GPP, NEP and ecosystem respiration (RE) as described in Gilmanov et al. (Reference Gilmanov, Soussana and Aires2007). Thereafter, WUE was calculated as a ratio of productivity (i.e. GPP, NEP) and evapotranspiration (ET). The latent heat (LE, w m−2) fluxes were used to obtain water loss (ET, mm d−1) as outlined in Tang et al. (Reference Tang, Ding, Li, Li, Luo, Xie and Chen2015). The estimated WUE was compared with the actual WUE determined from the actual data of the applied irrigation water and actual alfalfa crop yields obtained from the records of the study farm.
Results
Results of this study revealed that the daytime temperature decreased continuously from its maximum (46±2°C) in August and reached its minimum value (14±4°C) in January. However, the nighttime temperature varied from 33.6°C (in summer) to 0.2°C (in winter). The VPD ranged from 0.6 kPa (February 2014) to 5.2 kPa (July 2013) and directly related with the dynamics of daytime temperaute. The recorded amounts of precipitation for the years 2013 (October to December) and 2014 (January to February) were 82 mm and 24 mm, respectively.
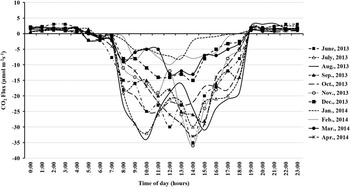
Figure 2 shows the diurnal variations of CO2 flux above the alfalfa canopy. The diurnal and seasonal variations of CO2 flux showed a maximum value of −38 μmol m−2 s−1 during noon hours (11:00–12:00) in the pre- (March 2014) and post- (September 2013) summer months due to the peak photosynthetic activity. The uptake of CO2 was low (–12 to 0 μmol m−2 s−1) during winter due to the coldness affected photosynthetic activity. Hence, CO2 assimilation decreased with the progress of winter season towards December, with a maximum value of −12 μmol m−2 s−1.
Mean monthly diurnal variations in CO2 flux over alfalfa field.

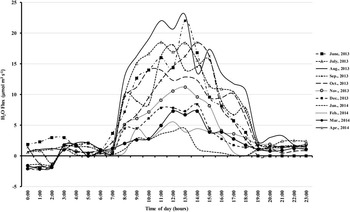
A shift in the peak CO2 assimilation time was observed (Figure 2), i.e., for the time periods 11:00–12:00 during the period from November to December and 12:00–14:00 during the period from January to April. Figure 3 shows monthly averaged diurnal variations of H2O flux across the study period. The peak flux values of water vapor (15–23 mmol m−2 s−1 during summer season to less than 5 mmol m−2 s−1 during winter) were observed during noon times (11:00–15:00) as a result of the canopy peak transpiration level during this period.
Mean monthly diurnal variations in H2O flux over alfalfa field.

Temporal variations in Water Use Efficiency (WUE)
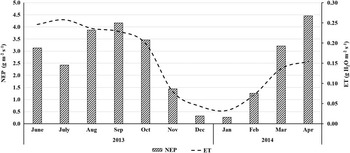
Seasonal variations of EC-measured NEP and ET of alfalfa crop are shown in Figure 4. The peak NPP value (4.46 gC m−2 s−1) was observed in April 2014, and the lowest value (0.27 gC m−2 s−1) was noted in January 2014. However, the highest ET (0.37 g H2O m−2 s−1) was observed in August 2013.
Seasonal variations of the NEP and ET over alfalfa field.

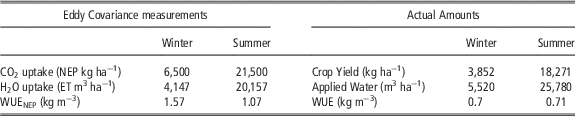
As depicted in Table 2, the net CO2 uptake of alfalfa for the study period yielded a NEP of 650 gC m−2 (6 500 kg ha−1) and 2 150 gC m−2 (21 500 kg ha−1) for winter and summer periods, respectively. On the other hand, the uptake of water (i.e. ET) was 4 147 and 20,157 m3 ha−1 for winter and summer seasons, respectively. These results were converted to EC estimated WUENEP values of 1.57 and 1.07 kg m−3 for winter and summer seasons, respectively.
Results of the EC estimated and actual alfalfa WUE for winter and summer periods

The amount of applied water is calculated based on the traveling time of the pivot (hours) and the discharge rate. The actual amount of the applied irrigation water, however, was determined at 5,520 and 25,780 m3 ha−1 producing an actual (i.e. harvested) alfalfa hay yield of 3 852 and 18,271 kg ha−1 for winter and summer periods, respectively. Hence, the actual WUE of alfalfa was calculated at 0.70 and 0.71 kg m−3 for winter and summer periods, respectively. The WUE of the harvested alfalfa crop was observed to be lower than that estimated using EC measurements (i.e. WUENEP) by 55% and 33% for winter and summer periods, respectively.
Discussion
As expected, crop water use of alfalfa showed variations across the growth season based on the changes in climatic conditions. The crop water use was low in winter because of cool temperatures and slow growth, especially in December 2013 and January 2014. Alfalfa started to use more water in March, and water requirements increased as it got warmer in April.
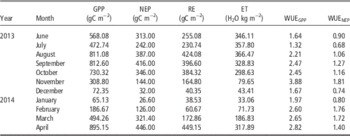
The results of CO2 fluxes over the alfalfa field during the study period revealed that the seasonal GPP ranged between 895 g C m−2 and 135 g C m−2. As provided in Table 3, cumulative monthly NEP was positive for the entire study period, with the greatest CO2 uptake in April (446 gC m−2) followed by September (416 gC m−2) and August (387 gC m−2). The NEP was low during winter (eg. it was 27 gC m−2 in January) and drastically increased from March (321 gC m−2) through June (313 gC m−2). The NEP decreased to 242 gC m−2 in late summer (i.e. in July).
Temporal dynamics of CO2 fluxes of alfalfa represented as GPP and NEP along with ET and water use efficiency.

The NEP of alfalfa field was 30% more in summer (2150 gC m−2) compared with winter season (650 gC m−2). This large amount of variation may be attributed to the influence of seasonal climatic variations on ET, alfalfa productivity and water use efficiency. The midday CO2/water flux ratio (i.e. WUENPP) also showed significant seasonal variation, which is maximum during winter (1.76 in February) and minimum during summer (0.68 in July). The EC based NPP and WUE values were similar to those reported in earlier studies (Gilmanov, Reference Gilmanov, Baker and Bernacchi2014) with the NEP ranged from 546 and 1175 gC m−2 Yr−1. The WUENEP of alfalfa observed in this study concurred with the previously reported values 0.18–0.60 kg m−3 by Ismail and Al-Marshadi (Reference Ismail and Al-Marshadi2013), 0.38–0.43 kg m−3 by Patil et al. (Reference Patil, Al-Gaadi and Madugundu2015), 3.46 kg m−3 by Duan et al. (Reference Duan, He, Qin, Zi, Zhang, Yang and Liu2016) and 1.56–2.44 kg m−3 (WUEGPP) by Bellague et al. (Reference Bellague, Hammedi-Bouzina and Abdelguerfi2016).
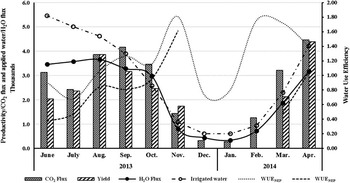
WUEGPP was higher than WUENPP since some amount of the photosynthate was consumed by nocturnal respiration and some was translocated to the roots. On the other hand, large variations were observed in seasonal water use and total CO2 uptake compared to the actual applied water and harvested alfalfa (Figure 5). In the case of EC measured data, the yield of a crop is mainly driven by photosynthetic rate, assimilation of adequate amount of CO2 and H2O. The rate of photosynthesis may also differ with the phenology and the length of the day. During the study period, water use of alfalfa was high in summer season because of dense canopy and high photosynthetic assimilation. Therefore, the amount of water utilized by alfalfa varied temporally and mainly depends on the seasonal dynamics of temperature, wind, humidity and the amount and intensity of light.
Temporal dynamics of WUE and obtained yields for winter and summer periods (during June 2013 to April 2014).

Conclusion
A field study was conducted to investigate the water use efficiency (WUE), using the EC recorded fluxes (CO2 and H2O), of the alfalfa crop cultivated under the hyper arid conditions of Saudi Arabia. The specific conclusions can be summarized as follows:
-
∙ The actual alfalfa WUE of 0.70 and 0.71 kg m−3 was recorded for winter and summer periods, respectively. However, the values of EC estimated WUENEP were 1.57 and 1.07 kg m−3 for winter and summer periods, respectively.
-
∙ The actual alfalfa crop WUE was found to be 33–55% lower than the estimated WUENEP. Therefore, a potential for increasing the actual WUE exists, and the actual WUE can be improved by following effective irrigation schedules and employing the technology of precision irrigation, which will enable farmers to apply irrigation water and agrochemicals more precisely and site specifically to match soil and plant status and needs.
Acknowledgements
This project was financially supported by King Saud University, Vice Deanship of Research Chairs, Saudi Arabia. The unstinted cooperation and support extended by Mr. Jack King, Mr. Alan King and their team of Todhia farm in carrying out the research are gratefully acknowledged.