1. Introduction
The potential for destruction from hurricanes in the Caribbean as indicated by past events arguably leads to the desire to conduct some sort of risk assessment so that estimates of expected return periods and anticipated damages can aid in choosing appropriate disaster prevention and mitigation strategies. However, while there are a number of papers that focus on hurricane risk and loss assessment for the United States (Pielke et al., Reference Pielke, Gratz, Landsea and Collings2008; Emanuel, Reference Emanuel2011; Mendelsohn et al., Reference Mendelsohn, Emanuel, Chonabayashi and Bakkensen2012), to date there are only a handful that provide evidence of the hazard risk in the Caribbean. For instance, Trepanier (Reference Trepanier2012) only provides evidence of a greater likelihood of increased hurricane activity for very large areas within the Caribbean. Similarly, the OAS (1999) provides a limited number of return period maps for the entire region, allowing for no clear country-specific assessment. This paper estimates hurricane wind induced expected losses in the agriculture sector of Caribbean island economies.
While hurricane strikes can cause damages across all sectors of Caribbean island economies, arguably agriculture is particularly vulnerable. More specifically, hurricanes induce losses to crops and livestock through excessive winds and associated factors (Crowards, Reference Crowards2000; Benson and Clay, Reference Benson and Clay2001), and these factors may also have more long-term implications, as crops and arable land often require time to recover and mature. For instance, in 2004 Hurricane Ivan downed 80 per cent of nutmeg trees in Grenada, resulting not only in short-term destruction of existing crops, but also in long-term consequences for the industry, since nutmeg trees typically take 7–9 years before their first harvest and reach full maturity for production only after 20 years (International Trade Centre, 2010). Similarly, Benson and Clay (Reference Benson and Clay2001) have shown that the agricultural sector in Dominica failed to recover to pre-hurricane production levels after each major hurricane over the period 1979–1995. Importantly in this regard, most Caribbean economies are significantly dependent on agriculture, making them potentially susceptible to hurricane-induced agricultural losses. For example, agriculture's value added to GDP was on average 7 per cent for the region in 2012, and as high as 24 per cent (Dominican Republic).
In trying to assess what the future losses to agriculture across Caribbean islands might be, the infrequency of particularly extreme storms over time and space makes direct inference solely based on historical events problematic (Emanuel and Jagger, Reference Emanuel and Jagger2010). More specifically, despite the fact that hurricane track data are available from as far back as 1855, the actual number of historical hurricane events is not sufficient to derive a reliable probability distribution for individual islands. Moreover, even if the numbers were sufficient, the weather driving tropical storm formation is unlikely to have been stable over the last 160 years, and thus using these tracks to forecast future losses due to hurricanes may not be suitable.
A recent, statistically deterministic method consists of generating a large set of synthetic hurricane events on the basis of existing meteorological data within a coupled ocean–atmosphere tropical storm model, to derive a probability distribution. We follow this approach and employ a large set of synthetic tracks generated using the methodology of Emanuel et al. (Reference Emanuel, Sundarajan and Williams2008) in accordance with weather patterns over recent years. This allows us to derive a distribution of hurricane winds across the Caribbean according to the recent climate. Using these tracks within a wind field model and spatially gridded data on the location of cropland, we are able to derive return periods of potentially damaging storms across Caribbean islands for the near future. We combine these probabilities with an agricultural loss function estimated from historical data to derive expected losses across countries. As such, our paper provides for the first time a hurricane expected loss assessment for Caribbean agriculture, and does so explicitly on a country-by-country basis. That is, while previous studies have provided estimates of hurricane return periods for the region, these have been at a more spatially aggregate level. Moreover, they have not calculated expected agricultural losses. Nevertheless, it must be pointed out that our analysis here does not allow for future adaptation and thus should be viewed as an estimate of the upper bound of losses.
The rest of the paper is organized as follows. Section 2 outlines our risk and loss assessment methodology. Section 3 describes the hurricane data used. Section 4 summarizes our agricultural data. Section 5 gives the results of our empirical analysis. Section 6 concludes the paper.
2. Risk and loss assessment methodology
Our main goal is to calculate expected losses and related hurricane wind risk concepts for Caribbean agriculture due to hurricane strikes. As is common in the literature (Emanuel, Reference Emanuel2005), we model losses as a function of hurricane wind speed, defined for convenience as V. While rule of thumb practice is to classify possible damages due to hurricanes by a particular storm's maximum wind speed, it is important to note that, even for a given storm with a given maximum wind speed, the winds experienced, and hence implied losses, can differ considerably across locations within islands at any point in time. One thus ideally needs to model wind speed locally (rather than using the maximum wind speed per storm) to take account of this heterogeneity.Footnote
1
We hence consider here a set of Caribbean island economies, j=1, …, M, as consisting of an ensemble of individual land masses where, on some subset of which, say,
 $i = 1, {\ldots}\,, N_{\!j}$
, agricultural-related activity occurs. The expected total agricultural losses due to hurricanes of island economy j at any point in time are thus assumed to be:
 $$E(L(V))_j = \sum\limits_{i = 1}^{N_j} {\int\limits_{\underline{V}}^{\overline V} {L(V_{i,j})df_{Vi,j} (V_{i,j}) dV_{i,j}}} \quad \hbox{for}\,{j = 1, {\ldots}\,,M,}$$
where L is an agricultural hurricane loss function,
V
is some lower threshold of wind speed below which losses are negligible,
 $\overline{V}$
is the theoretical upper threshold of possible hurricane wind speeds, and f (V
i, j
) is the probability density function of V
i, j
for location i in island j.
Our challenge here is to estimate island economy-specific expected losses with (1), given available data. More specifically, we will need the following inputs. First, a set of local, preferably as disaggregated as possible, agricultural areas, i=1, …, N within islands. Secondly, we have to estimate the probability density functions across the range of damaging hurricane speeds,
V
to
 $\overline{V}$
, for our set of agricultural land masses. Finally, we need to specify an agricultural loss function.
In terms of identifying agricultural areas, we detail our data sources for this in the following section, while our estimation of the probability distribution functions is based on a set of synthetically generated storms outlined in section 4. However, even for a given synthetic storm, one still needs to estimate local wind speeds, as noted earlier. In this regard, we follow Strobl (Reference Strobl2012b) and employ a wind field model to generate wind speeds experienced at any point within islands due to a storm. More specifically, to calculate the wind speed experienced due to a hurricane at any point P=i in island j at any time t, i.e., V ijt , we employ the Boose et al. (Reference Boose, Serrano and Foster2004) version of the well-known Holland (Reference Holland1980) wind field model:
 $$\eqalign{V_{ijt} & = GF \left[V_{m,jt} - S\lpar 1 - \sin (T_{ijt}) \rpar {V_{h,jt} \over 2} \right] \cr &\quad \times \left[ \left({R_{m,j,t} \over R_{it}} \right)^{B_{jt}} \exp \left(1 - \left[{R_{m,j,t} \over R_it} \right]^{B_{jt}} \right) \right]^{1 \over 2},}$$
where V m is the maximum sustained wind velocity anywhere in the hurricane, T is the clockwise angle between the forward path of the hurricane, and a radial line from the hurricane center to the point of interest P=i, V h is the translation speed of the hurricane, R m is the radius of maximum winds, and R is the radial distance from the center of the hurricane to point P. The remaining variables consist of the gust factor G and the scaling parameters F, S and B, for surface friction, asymmetry due to the forward motion of the storm, and the shape of the wind profile curve, respectively.
Finally, we need to specify an agricultural loss function for the Caribbean. Unfortunately, as far as we are aware, there are no existing loss functions we could use in this regard. We thus resort to using historical data on hurricanes and agricultural production, also described in sections 3 and 4, respectively, to estimate the likely relationship between losses and experienced wind speeds for the Caribbean region.Footnote 2 Our starting point follows Emanuel (Reference Emanuel2005, Reference Emanuel2011) and assumes, energy dissipation grounds, that damages should vary with the cubic power of wind speed above some threshold. More specifically, for any point i on island j we use Emanuel's (Reference Emanuel2005) power dissipation index to measure the potential destruction of a storm as:
 $${PDI}_{ij} = \int_{s = 1}^{R} V^{3}_{i,j,s}\,{ds} \quad \hbox{for} V_{i,j} \gt \underline{V},$$
where V is the locally measured wind speed as constructed from the wind field model, and R is the lifetime of the storm as accumulated over time intervals s. This index can be used in our context to obtain an estimate of the potential damage of a hurricane at a particular spatial locality in terms of wind speed units, and subsequently at the island level by summing its value for a storm over locations within an island. As a lower threshold of wind speed below which damage is likely to be negligible, i.e., for
 $V \le \underline{V}$
, we here and throughout our analysis use the lower threshold of the lowest of the Saffir–Simpson hurricane classification categories, namely 119 km/h.
To translate a unit of potential damage into likely agricultural production reduction, we employ the following general regression model specification:
 $${AGRICULTURE}_{j,t} = \alpha + \Sigma^{T}_{s = 0}\beta_{t - s} {PDI}_{j,t - s} + \mu_j + \lambda_t + \varepsilon_{j,t},$$
where AGRICULTURE denotes agricultural production for island j in year t, and PDI is the island-specific index of potential hurricane destruction in (3), summed over islands for historical storms over the period t. The estimated set of coefficients β on PDI serves to translate a unit of PDI into losses in agricultural production, where we allow for the possibility that a hurricane may have more than just an immediate impact through lagged values of PDI. The vector μ consists of a set of island-specific indicator variables that allow us to control for any unobserved time-invariant island-specific factors that determine agricultural production, but may also be related to anticipated time-invariant hurricane distribution characteristics in island j, and hence the exclusion of which may result in biased estimates of β. For example, islands that are on average hit by more hurricanes may be more likely to plant crops that are more hurricane resistant. In the implementation of (4), the vector of μ is purged from the equation by taking deviations of means of all variables. The vector of time-specific indicator variables λ serves to control for unspecified time-varying factors common to all islands also potentially correlated with hurricane destruction, where these are implemented as a set of zero-one indicator variables. Examples might include a decline in agricultural production across the region due to competition in the market from other parts of the globe. Finally, α is a common intercept, while ε is a standard unexplained random error term.
Our estimated β allows us, for any storm with wind speeds V, to calculate the expected losses in agricultural production, i.e., to approximate the losses for country j, as:
 $$L(V)_{jt} = \Sigma^{N}_{i = 1} \Sigma^{T}_{s = 0} \beta_{t - s}{PDI}_{{ijt}-s}.$$
The expected losses to agriculture due to hurricanes as approximated by (5) bring together a number of different aspects. More specifically, it takes the local wind speeds during a storm derived from a wind field model, translates these into energy dissipation, aggregates total energy dissipation at the island level, and finally translates these into agricultural losses from the estimated historical relationship between energy dissipation and agricultural production.
We can also calculate other potentially insightful and related risk and loss factors. For instance, the return period, RP, of a damaging hurricane in island j is simply:
 $${RP}_j = \displaystyle{1 \over \int_{\underline{V}}^{\overline{V}}\,df_{V_j}(V_j)dV_j},$$
and the expected losses conditional on damaging hurricane occurrence, EC, are:
 $$EC(L(V))_j = \sum\limits^{N_j}_{i = 1}\int\limits^{\overline{V}}_{\underline{V}} L(V_{{ij}}){dV}_{{ij}} \quad \hbox{for}\,j = 1, {\ldots}\,, M.$$
It is important to point out at this point that, in its strictest interpretation, our proxy in (7) is only measuring damage to agriculture as caused by wind. Our reliance solely on wind speed as an indicator, ignoring other damage characteristics of storms, such as storm surge or excess rainfall, is because of the lack of data availability, a limitation that was faced by other studies on the impact of hurricanes on agriculture (Chen and McCarl, Reference Chen and McCarl2009; Israel and Briones, Reference Israel and Briones2012). In this regard, one should point out that the extent of storm surge is known to be related to the wind strength of a storm (Emanuel, Reference Emanuel2011). In contrast, there appears to be no direct relationship between storm intensity as measured by maximum wind speed and rainfall during the storm. However, it has been found that both winds and precipitation are highest nearer to the eye of the storm (Riehl, Reference Riehl1954). Since we are modeling wind across the space of a storm using a wind field model, higher winds within our wind field model are also likely, at least to some extent, to be correlated with greater rainfall.
Before proceeding to the description of our data and results, an important caveat needs to be pointed out regarding our analytical framework. Specifically, one should note that our use of historical data to estimate the reaction of agricultural production to hurricane strikes, i.e., β, makes a number of restrictive assumptions regarding adaptation. First, by restricting β to be homogeneous over time, we are implicitly assuming that there was no significant adaptation over the historical time period. Secondly, by assuming that β is appropriate for calculating future losses, we are also supposing that there is no future adaptation. Clearly, if countries adapt to try to mitigate the impact of hurricanes on agricultural production, then our estimate of losses is likely to serve only as an upper bound on actual future losses.
3. Hurricane data
3.1. Hurricane risk modeling
Hurricane risk assessment models can be broadly divided into the traditional single site probability models and the more recent hurricane track modeling using statistical deterministic methods (Vickery et al., Reference Vickery, Skerlj, Steckley and Twisdale2000). In traditional probabilistic models, location-specific statistics of key hurricane parameters are first estimated using historical storm track data. An extreme value distribution is then selected and fitted typically to the maximum wind speeds of a hurricane approaching a specific location of interest, allowing the calculation of probabilities of annual occurrence of storms of a given wind speed strength via Monte Carlo methods. Importantly, however, single site probability models are typically only valid for a specific location or a small region, given that they use site-specific tropical cyclone parameters. Also, since these models use historical hurricane tracks, they assume that the intensity evolution of the hurricane is independent of the particular track taken. Moreover, since the historical data contain only a few very strong hurricane strikes, the estimated probabilities can be very sensitive to the tail of the assumed distribution, making direct inference fairly unreliable, particularly for regions that experience infrequent storms (Emanuel et al., Reference Emanuel, Sundarajan and Williams2008).Footnote 3
To address some of the weaknesses of the single site models, Vickery et al. (Reference Vickery, Skerlj, Steckley and Twisdale2000) pioneered the hurricane track modeling method, which models the entire track of a given tropical cyclone from its formation over the sea to its final dissipation as it makes landfall, using empirical global distributions of relative intensity in conjunction with climatological values of potential intensity to derive local intensity distributions. This allowed for the modeling of hurricane risk via generating synthetic tracks for large geographic areas, such as the entire coastline of the US. More recently, Emanuel et al. (Reference Emanuel, Sundarajan and Williams2008) built on the approach of Vickery et al. (Reference Vickery, Skerlj, Steckley and Twisdale2000) in generating synthetic tracks, but instead used a random hurricane track model, together with a deterministic approach, to model the hurricane intensity over the period of formation to dissipation. More precisely, hurricane tracks are generated from a random draw using a space time probability density function of tropical cyclone formation locations derived from the National Hurricane Centre's (NHC) data from 1970 onward (the year they consider the global satellite detection of tropical cyclones to be complete). Using information such as sea surface temperature and humidity together with historical storms, the model is able to trace the strengthening and weakening of hurricanes as they progress along the modeled tracks, but without using statistical models to model the changes in hurricane intensity as in traditional models. Once the synthetic tracks have been produced, a deterministic numerical simulation of hurricane intensity along each synthetic track is used to determine maximum wind speed and radius of maximum winds using the model developed by Emanuel et al. (Reference Emanuel, Autels, Holloway and Korty2004). A filter is then applied to the tracks to select those coming within a specified distance of the location of interest. For each location of interest, the intensity model can then produce probabilities as a function of wind speed for that location.Footnote 4
3.2. Synthetic hurricane tracks
In this paper we use the synthetic tracks generated with the Emanuel et al. (Reference Emanuel, Sundarajan and Williams2008) approach as a basis for the hurricane risk assessment. In this regard, Kerry Emanuel kindly implemented this methodology to generate for us 4,000 hurricane strength storms traversing the Caribbean region on the basis of yearly weather data (wind, sea surface temperature, air temperature and humidity) observed over the 1980–2010 period. Thus we have at hand a large set of possible hurricanes in the Caribbean that might form if the weather were to remain similar to that of the last 30 years. For each of these storms, the model provides, for every two hours of the storm's lifetime, the location of the eye, the maximum wind speed, the forward velocity, the central pressure, and the radius of maximum wind speed. For our set of storms the maximum wind speed varies between 119 and 314 km/h, with a standard deviation of 36 km/h.
In order to generate a large set of synthetic tracks from which we can calculate probabilities, we followed the approach by Emanuel (Reference Emanuel2011). More specifically, we took each of our 4,000 synthetic storms and assumed that the probability of each year's weather over the 1980–2010 period is equally likely to occur. To then generate a set of hurricane events specific to a year's climate, we randomly picked a year and used a Poisson distribution to randomly draw a number of storms from that year's set, according to the expected frequency of events of that year as given by the data. This was done 100,000 times, generating a total of 271,065 storms, for each of which an annual probability of occurrence can be calculated. Note that the average maximum wind speed of this sample is slightly larger than the base data set, standing at 164 km/h. This derives from the fact that the probability of being drawn into the simulated set is not equal across storms but depends on the year of the climatic data, as determined by the underlying model from which they were generated. In order to demonstrate the spatial variability of storms in our simulated set, we divided the Caribbean region into 100 km cells and calculated the probability that a storm would pass over each cell, the graph of which is given in figure A1 in the online appendix available at https://doi.org/10.1017/S1355770X16000176. As is clear, there is considerable variability in storm activity across the region and within islands.
Since we will be using synthetic tracks generated from climate models according to relatively recent weather, it is of course important to consider how informative such tracks are for making predictions of hurricane damage in the future. In this regard, note that recent research by Emanuel (Reference Emanuel2011) using a number of climate change scenarios under the same model has shown that any global warming signal is unlikely to emerge before 40 years, and even changes in probability are not likely to occur before 25 years. One can thus view our risk predictions using the synthetic tracks generated from the 1980–2010 climate as probably being indicative of hurricane damages in the more immediate future, i.e., less than 25 years, but not in the longer term.
3.3. Historical hurricane data
Estimation of the translation parameter in (4) for our loss function requires the use of historical hurricane tracks, since we are inferring it from estimating the observed relationship between agricultural production and hurricanes. These are taken from the NHC ‘best track’ data set over the period 1980–2010, which consists of six-hourly reports of storm positions and maximum wind speeds of all known tropical cyclones in the North Atlantic Basin. We interpolated these into two-hour segments to be in line with our synthetic track data reporting frequency. Overall there were 123 storms that traversed the Caribbean and we depict these in figure A2 in the online appendix.
3.4. Implementation of wind field model on synthetic and historical hurricane tracks
We employ the wind field model on each storm described in section 2 to determine local wind speeds experienced for a particular location. In terms of implementing (2), note that V m is given by the synthetic storm track data, V h can be directly calculated by following the storm's movements between locations, and R and T are calculated relative to the point of interest P=i. All other parameters have to be estimated or assumed. In this regard, it should be noted that we have no information on the gust wind factor G. However, a number of studies that have measured it explicitly suggest that it will generally vary around 1.5 (Paulsen and Schroeder, Reference Paulsen and Schroeder2005), which is also the value used by Boose et al. (Reference Boose, Serrano and Foster2004), and hence we similarly assume it to be 1.5.
There is also no explicit information on the surface friction to directly determine F. However, in the studies cited in the Review of Tropical Storm Hazard Modeling, Vickery et al. (Reference Vickery, Wadhera, Powell and Chen2009) suggested that the reduction factor was about 0.7 in open water, about 0.14 on the coast, and 0.28 50 km inward. Thus, we adopted a reduction factor that linearly decreased within this range when considering points i further inland from the coast. As in Boose et al. (Reference Boose, Serrano and Foster2004), we assume that S takes a value of 1.
In terms of the remaining parameters, Vickery and Wadhera (Reference Vickery and Wadhera2008) noted that the parameters of radial pressure profile parameter B and the radius of maximum winds play an important role in estimating local wind speeds. While the synthetic track data provide a measure of the radius of maximum wind speed, an estimate of the value of B is needed. We employed Holland's (Reference Holland1980) approximation method to generate an estimate of B.
4. Agricultural data
4.1. Agricultural areas
The most comprehensive and reliable global database regarding the percentage of land area that is cropland, as derived from national sources, is the United Nations Food and Agriculture Organization (UNFAO) data. Unfortunately, however, these data do not provide the spatial distribution of cropland within countries. Moreover, there are no other consistent and comprehensive locally derived maps of agricultural areas available for the islands in the Caribbean. An alternative is thus to identify agricultural areas in a country using gridded spatial maps derived from information obtained from earth observation satellite data, such as the Global Land Cover 2000 (GLC, 2000) database.Footnote 5 As a matter of fact, there are now numerous researchers and government agencies that use such data to determine agricultural areas, and more specifically agricultural cropland, across the globe.Footnote 6 All data of these types are mainly based on using satellite-derived spectral reflectance data to measure vegetation growth at a spatially detailed gridded level in order to classify local land areas as cropland and other land cover categories.
While such remote sensing derived databases conveniently provide researchers and policy makers with relatively detailed maps of cropland within countries when there is often no other alternative, there are a number of complicating factors that will inevitably introduce measurement error into the identification process. These include differences across countries in terms of crop management practices, crops planted, and historical, political, social and technological factors, as well as more general misclassifications.Footnote 7 To highlight the potential importance of the possible measurement error in using land cover data for the Caribbean, we calculated the percentage of cropland in the Caribbean as taken from the UNFAO database (which are derived from national non-satellite sources) and that inferred by the GLC database, in which cropland is identified as belonging to (i) cropland, (ii) mosaic of cropland/shrub or herbaceous cover, and (iii) mosaic of cropland/tree cover/other natural vegetation land categories. For some countries there are large discrepancies in the percentage of land classified as cropland, where on average the percentage point difference is 13.6 with a standard deviation of 11.9. This can be seen in table A1 in the online appendix. Perhaps most alarmingly, many of the smaller islands according to the GLC 2000 data have zero cropland, begging the question of how suitable the GLC 2000 may be for these territories and hence for the task at hand in this study.
Of course, the GLC 2000 is just one of several remote sensing derived land cover databases available. Each differs in their vegetation growth information source, classification algorithms and period of analysis. In a recent study, Pittman et al. (Reference Pittman, Hansen, Becker-Reshef, Potapov and Justice2010) used an innovative approach to combine several land classification products, as well as other data sources, to determine the probability with which vegetation growth derived from the Moderate Resolution Imaging Spectroradiometer (MODIS) aboard the Terra satellite is able to predict cropland across the globe. The authors calculated the Normalized Vegetation Index (NDVI) for 250 megapixels from the MODIS spectral bands for the period 2000–2008 and then used a classification tree analysis and other land cover productsFootnote 8 to derive probabilities of cropland predicted by the satellite-measured vegetation growth for 1 km gridded spatial land areas. These probabilities were then used to derive country-specific threshold probabilities of cropland existence for a grid cell. While they show that this procedure is fairly successful for large countries and for the regions of Africa, Europe, Central Asia, South East Asia and Latin America, examining their gridded cropland identification for Caribbean islands suggests a similar lack of ability to identify cropland in the smaller islands. Less than half of these island economies had any cropland at all at the 1 km level with their chosen threshold of 0.6, as can be seen in online table A1.
An obvious option to identify enough cropland areas within islands to be congruent with UNFAO data would have been to simply set the threshold for each island lower than the 0.6 chosen by Pittman et al. (Reference Pittman, Hansen, Becker-Reshef, Potapov and Justice2010), under the assumption that higher probability cells are indeed more likely to contain cropland compared to lower probability ones. However, for some islands there were not enough non-zero cells available so that we would have had to arbitrarily choose cropland areas among the zero probability cells for at least some parts of the islands in this regard. In order to identify cropland not found under these data sets, we make use of other available gridded information that may be correlated with whether a given area is cropland or not. In particular, arguably specific economic aspects such as the population density, as well as geographical features like elevation, slope and distance to the shore, may also provide some predictive power as to whether an area is likely to have cropland. We thus assembled available potentially relevant spatial characteristics at the 1 km grid level within Caribbean islands as possible predictive factors for cropland location, namely: population density, neighborhood population density, elevation (relative to the sea level), gradient slope of the land, and the distance to the shoreline. These predictive factors are derived from two sources. First, in order to proxy population density, we used gridded nightlight imagery as provided by the Defense Meteorological Satellite Program (DMSP), which makes available annual nightlight intensity values at the 1 km grid cell level across the globe. As a measure of neighborhood population intensity, we simply calculated the average value of intensity for all neighboring cells in 2010.Footnote 9 The source for the calculation of the elevation and slope gradient of land is the gridded Global 30-Arc-Second (GTOPO30) elevation data set from the US Geological Survey's website (http://rda.ucar.edu/).
With our predictive factors at hand, we next regressed the probability values of the 1 km grid cells as derived from the Pittman et al. (Reference Pittman, Hansen, Becker-Reshef, Potapov and Justice2010) data on these, thus allowing us to assess how well these features can predict the probability of cropland of the data. One should note that we included squared values of all these predictive factors in order to allow for potential nonlinear relationships. Additionally, we also included the longitude and latitude of the cells and distance to the shoreline, as well as country indicator variables to capture unobserved country-specific effects. Since the dependent variable varies between 0 and 1, we used a fractional Probit model as outlined by Papke and Wooldridge (Reference Papke and Wooldridge2008) as our estimator.
The results of estimating of our fractional Probit model are given in table A2 in the online appendix.Footnote 10 All factors, except nightlight squared, significantly act to predict the probability of cropland and the sign of their coefficients are generally what one would probably expect to be correlated with the presence of cropland. More specifically, those areas directly on the coast are less likely to be cropland. In contrast, the higher a grid cell level is above sea level, the higher the probability is that it is classified as cropland in the Pittman et al. (Reference Pittman, Hansen, Becker-Reshef, Potapov and Justice2010) database, although at a decreasing rate. A greater slope is also less likely to predict cropland presence, although again at a decreasing rate. More populated areas, as proxied by night light intensity, reduce cropland probability in a linear manner. Unsurprisingly, this indicates that the more densely populated an area is, the less likely there is to be cropland located in it. Greater night light intensity in nearby areas, in contrast, predicts a greater probability of cropland presence at a decreasing rate, suggesting nevertheless that agriculture is located not too far from populated areas. The results on nightlight would suggest that, although cropland is less likely to be directly located in populated areas, it is nevertheless more probable not too far away from them. Given the insignificance of night light intensity squared, we re-ran the specification without this variable. As can be seen from the second column in online table A2, the results on the other variables do not change in any noticeable manner.
We next used these regression results to calculate the predicted probability of cropland presence as suggested by the explanatory factors. This predicted probability was then utilized as additional information to identify cropland cells within countries so that suggested total cropland area within an island was in congruence with the national figures reported in the first column of table A1. The Pittman et al. (Reference Pittman, Hansen, Becker-Reshef, Potapov and Justice2010) probability values of cells served to determine the base classification rule for each country. In this regard, for each individual country we ordered positive probability cells and identified the higher probability cells as cropland until the suggested cropland area was equal to that of the actual cropland area as recorded in the UNFAO data. In cases where there were not enough positive probability cells to fulfill this requirement, we then ranked the zero probability cells according to their predicted probability, as calculated from the fractional Probit regression, and classified the higher probability cells as cropland until the total identified cropland area was equal to that of the national figure from the UNFAO data. This involved classifying 884 zero probability cells as more likely to have cropland than other zero probability cells. We show the cropland area for the islands in our sample in figure A3 in the online appendix.
4.2. Agricultural production
Our translation parameter of the wind loss function requires historical agricultural production data to be estimated. Given that our spatial agricultural areas are in terms of cropland, we also measure agriculture production in terms of cropland production, for which the data were taken from the UNFAO database. In this regard, the UNFAO provides annual data on 13 island economies for the Caribbean. Given that our synthetic tracks are generated under 1980–2010 weather conditions, we restricted the time period we used to the 1980–2010 period, as available. A list of the countries used and their total crop production in 2010 are given in table A3 in the online appendix. Agricultural cropland production and its importance to total country-level GDP differs considerably within the Caribbean. Additionally, there is some heterogeneity in the main type of crops produced. While most of the countries are dependent on tree crops, namely sugar, banana, coconut, mango, melon and nutmeg, in the case of Dominica and St. Vincent and the Grenadines, roots crops (yam and sweet potato) together with tree crops constitute a main crop produced.
5. Results
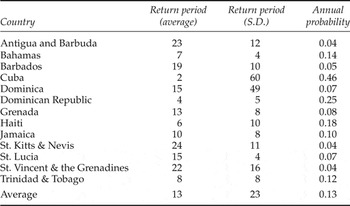
With the methodology and data sets outlined in the previous sections, we can now proceed to undertake a risk assessment of the Caribbean. We first use our synthetic tracks to calculate probabilities of local wind speeds experienced, i.e., to approximate the probability density function f (V ij ) from (1). That is, we take each of our 4,000 storms and then, for each cropland grid cell in an island, use the wind field model described above to calculate the local wind speed experienced by each storm, where we classify values above 119 km/h as potentially damaging. We can then use our simulated set of tracks, generated as outlined in section 3.2, to generate f (V ij ). We depict the distribution of return periods, which is just the inverse of the probability of occurrence, across all our cropland cells in the Caribbean in figure A4 in the online appendix, as well as listing them by island in table 1. As can be seen, there is a large variation across cropland cells within the Caribbean, with most of the density being around 40 years. It should be noted that this is not just due to variation across island economies. A look at standard deviations of return periods within islands shows that particularly in large countries, such as Haiti and Cuba, the difference can be as large as 63 years. Even within the smaller islands, like St Lucia, the standard deviation is close to four years.
Summary of loss return periods [RP] and annual probability of experiencing a loss [L(V)]

Notes: Calculations performed using equation (6). Annual probability is the inverse of the return period.
Our local probabilities can next be used to generate country-specific return periods by considering the probability of at least some destruction for each synthetic storm and its associated likelihood of occurrence as in (6). As can be seen from table 1, the average return period for a damaging hurricane in the Caribbean is 13 years. However, looking across islands one sees that there is large variability in this regard. For instance, Cuba's return period is as low as two years. Other countries for which one would expect a damaging hurricane to occur within at least every 10 years are Dominica, Haiti, the Bahamas, Trinidad and Tobago, and Jamaica, with annual return probabilities of a damaging hurricane of 46, 25, 18, 14, 12, and 10 per cent, respectively. In contrast, there are a number of countries for which the return period suggests that there is on average only a 4 per cent chance that a damaging hurricane will occur in any year. These include St. Kitts and Nevis which has the highest return period of 24 years, followed by Antigua and Barbuda with 23 years, and St. Vincent and the Grenadines with 22 years. Other countries with relatively long return periods include Barbados with 19 years, followed by Dominica and St. Lucia with 15 years, and Grenada with 13 years.
To associate the probabilities of damaging hurricane strikes with conditional expected and annual expected losses we next derive our loss function, which requires the estimation of the translation parameter β from (4). To do so we used the historical hurricane tracks from the NHC and the wind field model described above to calculate annual PDI values for our 13 Caribbean islands.Footnote 11 As can be seen from the summary statistics of these storms, on average one in every two years results in a damaging hurricane in the region. Across countries the experience has been variable, though, with some countries, such as the Bahamas and Cuba experiencing over 20 damaging storms, and others like Trinidad and Tobago having been subject to fewer than 10 over the 30-year period. More specifically, islands like St. Kitts and Nevis, Jamaica, and Antigua and Barbuda were subject to large potential destruction, while Trinidad and Tobago experienced the lowest average value over our sample period.
We next combine annual country-level PDI values with the annual agricultural cropland production data to estimate (4).Footnote 12 It can be noted in this regard that, while we have a limited amount of control variables, our hurricane destruction proxy is arguably exogenous, particularly after controlling for fixed effects.Footnote 13 Hurricanes have an immediate negative and significant effect on agricultural cropland production in the Caribbean (table A4 in the online appendix). Introducing further lags of PDI suggests, moreover, that this effect lasts up to a year after the strike, and we build our loss function accordingly. One should note that a relatively short-term and/or lagged effect is in line with previous studies.Footnote 14 We also experimented with using a lower threshold than the benchmark 119 km/h to define when damage to agriculture occurs. This may be particularly important, because even lower tropical storm level winds may induce damage to some crops (Guard and Lander, Reference Guard and Lander1999). To experiment with whether taking account of such lower winds will increase the precision of our estimate, we redefined the damaging threshold to coincide with the minimum wind speed associated with a tropical storm, i.e., 119 km/h, and show the results of using this index in the fourth column of table A4 in the online appendix. As can be seen, while the effect at least for the contemporaneous and lagged values remains negative, the coefficient is no longer statistically significant, thus providing evidence in favor of the higher benchmark threshold. Finally, we also experimented with using the duration of excess winds rather than their maximum value for a storm, as shown in the last column of table A4. Again, while the signs are as expected negative, the relative imprecision of their estimates suggests that it is more important to take account of the maximum level of wind rather than its duration.
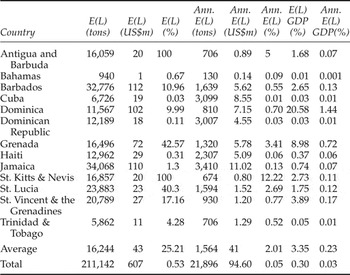
With our estimated β at hand, we next calculated average expected losses given a damaging hurricane strike, i.e., the average of losses for each island across all damaging synthetic storms, both in terms of tons and of monetary value using country-specific prices. More specifically, while our estimated β is in units of tons, in order to gain a feel for the impact in monetary terms we used 2012 UNFAO export value and quantity figures (or latest available data) to calculate the average price per country of agricultural crops to arrive at the loss value in 2012 US$. As seen in table 2, if a damaging hurricane were to strike, large losses in terms of tons are forecasted across the entire region, resulting in over 211,100 tons in cropland production losses, i.e., crops with an estimated value in excess of US$607 m. However, these losses are not homogeneously distributed in level terms across the Caribbean. More specifically, the largest proportion would be attributable to Jamaica, with over 34,000 tons worth US$110 m, followed by some 32,000 tons valued at US$112 m in Barbados. Relatively large amounts of agricultural production are also expected to be lost if a hurricane hits St. Lucia (23,888 tons worth US$23 m) and St. Vincent and the Grenadines (20,789 tons worth US$27 m). The lowest amount of losses, i.e., 940 tons worth about US$1 m, would be in the Bahamas.
Expected loss in agricultural crop exports
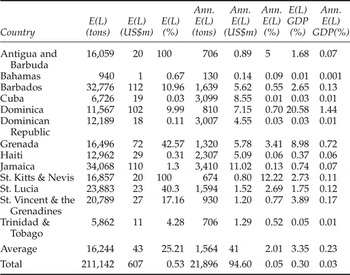
Notes: E(L) refers to expected losses given a damaging hurricane, while Ann. E(L) refers to annual expected losses. The upper threshold effect is set at 100% of agriculture crops in 2012 values destroyed.
If we compare expected losses conditional on damaging hurricane incidence relative to current (2012) cropland production, then our estimates imply that agricultural crops in Antigua and Barbuda and St. Kitts and Nevis would be completely wiped out and more than 40 per cent would be expected to be destroyed in St. Lucia; see column 4 of table 2.Footnote 15 Similarly, Grenada and St. Vincent and the Grenadines are likely to experience a substantial blow to their agricultural sector when a hurricane strikes, with losses of close to 18 per cent. On the other hand, in the larger countries, such as the Dominican Republic, Cuba, Haiti, Jamaica, and Trinidad and Tobago, effects are likely on average to destroy only a minor proportion of their cropland production, i.e., less than a few percentage points. Overall, if a damaging hurricane were to strike, one should expect a loss of about 0.53 per cent of total cropland production for the region. This relatively small figure is due to the fact that, in most countries carrying the largest share of agricultural production in the region, such as Cuba, Dominica, and Haiti, the expected overall percentage reduction is fairly small.
One can combine the probability of each damaging synthetic hurricane with its accompanying losses to calculate annual expected losses across countries (table A5 in the online appendix). Accordingly, yearly expected losses are about 22,000 tons, worth US$95 m, which constitutes about 0.05 per cent of total annual agricultural output in the region. In absolute terms, the largest losses are for Jamaica, standing at 3,410 tons worth US$ 11m, although this constitutes only 0.13 per cent of their annual agricultural output. In contrast, while absolute values are small for St Kitts and Nevis (375 tons worth US$0.4m), this would constitute about 12 per cent of their cropland output. Other small countries with relatively large expected annual losses are Antigua and Barbuda and St. Lucia, standing at 5 and 3 per cent, respectively. As with the conditional losses, the larger countries, i.e., Cuba, Jamaica, Dominican Republic and Haiti, are also likely to experience much smaller losses each year relative to their yearly agricultural production.
Agricultural losses can also be evaluated in terms of their importance for the overall economy of the islands. In this regard we used the latest available GDP figures from the World Bank's (2015) World Development Indicators database and calculated losses as a percentage of these, the results of which are given in the last two columns of table 2. The total loss as a percentage of GDP if a hurricane occurs in the region is 0.3 per cent, while total expected annual losses are 0.03 per cent of total regional output. However, across countries there are significant differences. More specifically, again the smaller countries are more negatively affected. For instance, the expected loss in agriculture given a damaging hurricane strike is 21 per cent of GDP for Dominica, 9 per cent for Grenada and 4 per cent for St. Vincent and the Grenadines, while the corresponding figures for the larger countries of Cuba, the Dominican Republic, Trinidad and Tobago, and Jamaica are less than 1 per cent. The expected annual losses as a percentage of GDP are approximately 1.4 per cent for Dominica and 0.7 per cent for Grenada. In all other territories the corresponding figure is less than 0.1 per cent, although notably lower for the larger islands.
It should be noted that our contrasting results across island size are in congruence with historical experience. For example, in 2004 the region experienced severe damage as a consequence of two major hurricanes, Ivan and Jeanne, and the direct and indirect damages reported indicate the marked difference in destruction between the small and large countries. More precisely, in Grenada the documented total damages, i.e., including losses other than agriculture, were more than twice the value of GDP in 2003, while for Jamaica the damages were around 10 per cent and less than 2 per cent in the Dominican Republic (ECLAC, 2004). Our results therefore indicate that the smaller countries of the Caribbean are likely to continue to be relatively more adversely affected by hurricane strikes in the future, at least in terms of agriculture.
Thus far we have treated agriculture as homogeneous across Caribbean islands in terms of its susceptibility to tropical storms. However, in reality agricultural production across the Caribbean is fairly heterogeneous. For instance, while all countries are generally dependent on agriculture, some countries are much more dependent than others, as can be seen from the agriculture value added as a percentage of GDP figures in online appendix table A3. More agricultural dependence may also mean a larger relative amount of agricultural inputs over greater spatial areas that are exposed to hurricane strikes and thus makes these countries more susceptible. The concentration of individual crops in agricultural production may also matter. More specifically, a greater concentration in few agricultural products can increase the exposure through a relative lack in temporal production and spatial location of crops. Indeed, concentration is not homogeneous across the Caribbean, as indicated by the Herfindahl index in table A3, defined at the crop level using a total of 170 crops. One may also want to distinguish between the different types of crops. In this regard, it was shown by Spencer and Polachek (Reference Spencer and Polachek2015) that above-ground crops are much more susceptible to hurricane strikes than those below. Our data allow us to distinguish between root crops and tree crops and, as indicated in table A3, the proportion of tree crops also varies across islands and hence may also make countries heterogeneous in the response of their agricultural sector to hurricanes.
Given the above differences in the above-described aspects of the agriculture sector across the Caribbean, we next explored how separating countries into subsamples accordingly may alter our damage function estimates and subsequent future losses calculations. In this regard, we identify those countries as more agricultural based, concentrated and tree crop based if they were ranked in the top eight according to the summary measures just described. The results of rerunning our historical regressions for these are shown in table A5 in the online appendix. In this regard, column 1 includes countries that are more agriculture based according to their agriculture value added as a percentage of GDP shown in table A3 (Cuba, Dominica, Dominican Republic, Grenada, Haiti, Jamaica, St. Lucia and St. Vincent and the Grenadines), whereas estimates in column 2 are for the remaining less agriculturally based countries (Antigua and Barbuda, the Bahamas, Barbados, St. Kitts and Nevis and Trinidad and Tobago). Columns 3 and 4 show the results for countries that have a more concentrated agriculture sector based on the Herfindahl index shown in table A3 (Antigua and Barbuda, the Bahamas, Dominica, Grenada, St. Kitts and Nevis, St. Lucia, St. Vincent and the Grenadines and Trinidad and Tobago) versus countries with a less concentrated one (Barbados, Cuba, Dominican Republic, Jamaica and Haiti). Finally, column 5 re-estimates our specification for countries with a relatively higher share of tree crops in agricultural production (Antigua and Barbuda, the Bahamas, Barbados, Cuba, Dominica Republic, Grenada, St. Lucia and Trinidad and Tobago), in contrast to column 6 where we show the results for those with a relatively lower share (Dominican Republic, Jamaica, Haiti, St. Kitts and Nevis and St. Vincent and the Grenadines). This sample decomposition exercise produces a number of interesting results. More specifically, we find that hurricanes have a significant negative impact on countries that are more agriculture based, countries which have a less diversified agriculture sector and countries that are more tree crop based. On the other hand, the impacts for less agriculture based, less tree crop based countries and less concentrated countries are not statistically significant.
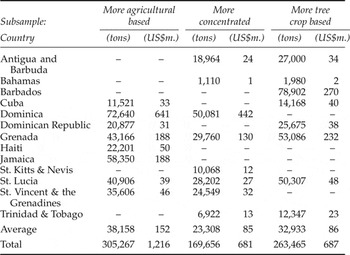
Table 3 provides the implied expected losses for the subsamples for which we found a significant effect in table A5. Accordingly, the damage suffered differs across agriculture-based countries, countries that are more concentrated, and those that are more tree based. Moreover, these losses are all larger than that which we found for our pooled sample. Looking at the specific figures, our estimates suggest that if a damaging hurricane were to strike countries that are more agriculture based, then there would be expected losses of 305,267 tons in cropland production with an estimated value of US$1,216 m. In contrast, expected strike losses in terms of more production concentrated type countries are 169,656 tons with an estimated value of US$ 681m. Finally, for countries that have a higher proportion of tree crops, a hurricane strike would result in an expected loss of 263,465 tons valued at US$687 m.
Expected losses in agricultural crop exports, by subsample

Notes: Expected losses are predicted losses given a damaging hurricane. The upper threshold effect is set at 100% of agriculture crops in 2012 values destroyed. The cut-off to be relatively more agricultural, more concentrated, or more tree crop based is to be one of the top eight ranked countries in these categories.
6. Conclusion
In this paper we use a large set of synthetic hurricane tracks, generated on the basis of recent climate patterns, to derive damage risks of hurricanes on agricultural cropland in the Caribbean. Our starting point is to identify local cropland areas, and then calculate wind speeds experienced at these areas for our set of hurricanes. These are then aggregated into country-specific damages using a damage function estimated from historical track data. Overall the results suggest that the region will continue to experience damaging hurricane strikes from which agricultural crops will be negatively affected. In this regard, the average Caribbean island economy should expect a damaging hurricane every 13 years. Total expected losses for the region when a damaging hurricane occurs are estimated at over US$600 m or 0.5 per cent of total agriculture production, while expected losses annually are US$95 m or 0.05 per cent of total agriculture production. Expected reduction as a percentage of GDP due to agricultural losses for the region in case of a hurricane strike is 0.3 per cent and expected annual reduction 0.03 per cent. It should be noted, however, that our analytical framework does not allow for future adaptation and hence our results feasibly serve only as upper bounds of potential losses.
At the individual country level, however, the expected impacts are likely to vary considerably, in line with historical experience. The return period of a damaging hurricane strike for the larger countries (actual land size) is generally much lower and the probabilities much higher than for the smaller islands. In Cuba, the Dominican Republic, Haiti and Jamaica, for example, the return period ranges from every two to every 10 years. Alternatively, for many of the smaller countries, such as St. Kitts and Nevis, Antigua and Barbuda, and St. Vincent and the Grenadines, damaging hurricanes are expected to occur with about a 4 per cent probability of annual hurricane occurrence.
Nevertheless, despite the higher return periods and lower annual probabilities of occurrence for many of the smaller islands, the results show that on these islands, the consequences of a damaging hurricane are likely to be much larger than for larger island countries. Agricultural crops, for instance, in St. Kitts and Nevis and Grenada are expected to be completely destroyed, while losses in St. Lucia and Grenada are likely to be at least 40 per cent of cropland production when a damaging storm occurs. In contrast, in all of the larger islands, expected losses are on average going to be less, or not much more, than 1 per cent of crop production. Similarly, annual expected losses on average are much larger in the smaller than in the larger Caribbean island economies.
We also investigated whether the structure of the agricultural sector may impact an island's susceptibility to hurricanes. In this regard we found that those countries where agriculture plays a greater role are also those more affected. Similarly, our results suggest that the more concentrated in a few products the agricultural sector is, the greater the impact of a hurricane will be. Finally, a greater share of tree- rather than root-based agricultural products will also make a country in the region more sensitive to damage from these storms. Our findings thus suggest that less reliance on agriculture can reduce an island's vulnerability. Even if this is not a feasible adaptation option, our analysis also indicates that diversifying agricultural production or at least relying less on tree-based agricultural products may also be a strategy to deal with a potential increase in storm activity in the future.
Overall our results suggest that losses in the agricultural sector can be potentially large in Caribbean island economies. While these losses, as our calculations show, are unlikely to translate into large reductions in overall GDP, one needs also to consider that it tends to be the relatively poorer portion of the population in Caribbean island economies that is employed in agriculture. Policy makers may thus want to consider introducing explicit disaster mitigation strategies for the agricultural sector in order to buffer the consequences for the less wealthy.
Supplementary material and methods
To view supplementary material for this article, please visit https://doi.org/10.1017/S1355770X16000176.