Introduction
Snow cover is a Sensitive indicator of climate dynamics and climate change, and an integrator of basic climate elements, As such, it is important that accurate information concerning snow extent and depth, and associated impacts of snow on regional surface albedo, be available. Here, a new integrated dataset for Northern Hemisphrre lands is discussed, which includes files of visible and microwave satellite-derived snow estimates and in situ station data. These files will be used to examine snow extent, snow depth and surface albedo over five-day intervals (pentads), and have been generated for 1° latitude by 1° longitude cells using geographic-information system (GIS) techniques. Visible and station files and albedo estimates extend from 1972 to present, and microwave files from 1979 to present. This dalaset will be of use in studies of potential changes in the global-climate system associated with anthropogenic and natural causes, and in particular will help to improve the parameterization and verification of climate models. It will also contribute to understanding the role of snow in the climate system, and to the development of accurate weather and hydrological forecasts.
An example of how one component of the datasct continues to prove to be an extremely useful means of assessing hemispheric snow cover is presented. Fluctuations of snow extent between January 1972 and April 1996 will be examined using U.S. National Oceanic and Atmospheric Administration (NOAA) weekly charts. These charts, which are derived from analyses of visible satellite imagery, have provided data of a consistently high quality since the early 1970s. Earlier studies that have utilized the NOAA snow data include Reference Matson and WiesentMatson and Wiesnet (1981), Reference Dewey and HeimDewey and Heim (1982), Reference Robinson, Keimig and deweyRobinson and others (1991) and Reference Gutzler and RosenGutzler and Rosen (1992).
Integrated Snow and Albedo Dataset
Visible satellite observations
NOAA snow charts comprise an important file within the integrated dataset. They are produced weekly from a visual interpretation of photographic copies of visible-band satellite imagery by trained analysts, and are subsequently digitized to the National Meteorological Center Limited-Area Fine Mesh grid (see Reference Matson, Ropelewski and VarnadoreMatson and others (1986) and Reference RobinsonRobinson (1993a) for further details on NOAA charts). For the new visible file, the weekly charts are convened to pentads and to a 1 × 1° grid using GlS techniques. For a given pentad The surface is considered either snow-covered or snow-free. Charts produced since 1972 are considered useful for large-scale climate studies, and are included in the tile. The climate group at Rutgers has just begun a project to reanalyze visible imagery, supplemented with station observations, to generate improved snow charls from the fall of 1966 through 1971. These charts will be completed in 1997.
Microwave-satellite observations
Estimates of the spatial extent and the depth of a snow pack may be calculated using measurements in multiple microwave channels. A file based on these analyses is another component of the new integrated dataset. This file includes Scanning Multichannel Microwave Radiometer (SMMR) snow estimates, based on the algorithm of Reference Chang, Fosterand and HallChang and others (1987), for 1979 through mid 1987. and Special Sensor Microwave Imager (SSM/I) estimates, derived from the algorithm of Reference Grody and BasistGrody and Basist (1996), for most years since 1987. The discrimination of dry snow cover and depth using microwave data is possible mainly because of differences in emissivily between snow-covered and snow-free surfaces. Differences in microwave scattering between snowpacks are generally a function of snow mass (expressed as depth or water equivalent), although other factors, such as ice layers within the pack or depth hoar at the base, also affect scattering. Vegetation penetrating through the pack also influences microwave signals reaching the satellite sensor, making estimates of snow difficult in forested regions. It is difficult to map wet snow extent. For the new microwave file, the SMMR and SSM/I products have been converted to pentads and to a 1 × 1° grid using GlS techniques.
In situ station observations
A station observation file, another component of the integrated analysis effort, is currently being supplemented with Global Telecommunication System snow-depth observations from across the Northern Hemisphere (available during most of the 1980s) and data from western China. To date, the file contains data from the United States Historical Daily Climate Dataset (Reference RobinsonRobinson, 1993b), Canada, and the former Soviet Union. For the new file, observations from all stations within a 1 ×1° gridcell are averaged to obtain a pentad mean depth. Depths are calculated for all cells within which at least one station is located.
Surface-albedo estimates
Another facet of the integrative effort is the compitation of a file of surface-albedo estimates for snow-covered lands. Initially, for a given pentad, a 1 × 1° gridcell is being assigned a snow-covered albedo, or a snow-free value (taken from Reference MatthewsMatthews (1983)), and based solely on the extent of snow shown in The visible file. The snow-covered surface albedo of a cell is oblained by analyzing selected Defense Meteorological Satellite Program (DMSP) image transparencies on an image processor (Reference Robinson and KuklaRobinson and Kukla, 1985). The spectral range of The DMSP sensor is 0.4–1.1 μm. Scene brightness of a cell is converted to a surface albedo (full solar spectrunm) by linear interpolation between standard bright and dark snow-covered surface elements with known albedo. Brightness is measured if, in a set of multitemporal imagery, the presence of deep (> 15 cm) and fresh snow cover is indicated. Cell albedo so calculated may be up to 0.10 too low or 0.05 too high, with the errors randomly distributed. Future plans include refining the snow-covered albedos by taking into account variations of snow depth, age, and wetness and the patchiness of the snow cover within the cell.
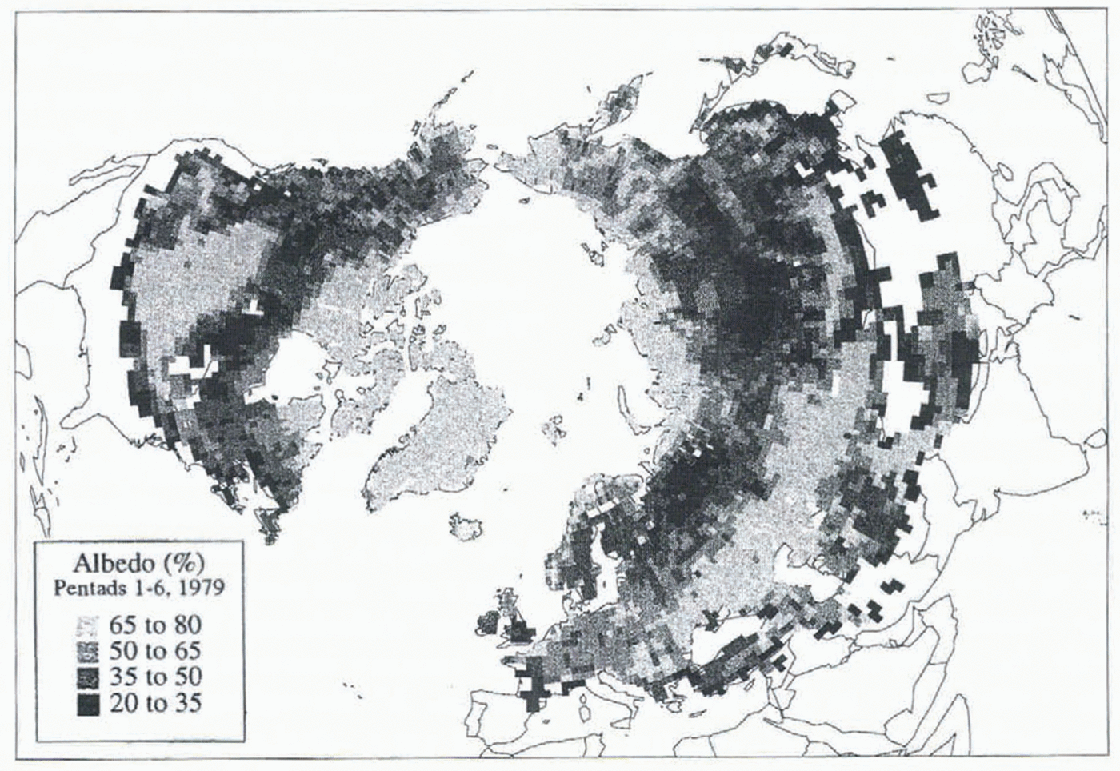
Albedo estimates over snow-covered lands during the first six pentads of 1979 are shown in Figure 1. In this example, any cell that was snow covered during at least one pentad of this interval is assigned an albedo by averaging the cell values for the six pentads. Albedos >50% are observed in the fully snow-covered steppe, plains and prairie of the middle latitudes, as well as over high-latitude tundra. Lower albedos between these two zones are a function of trees within the boreal forests masking the underlying snow-covered ground. Values within the periphery of the snow-covered region (snow transition zone), despite often being in non-forested areas, are commonly > 50%, as snow did not cover the ground throughout the six pentads.
Estimated surface albedo (in percent) oversnow-corned lands during the first six pentads of 1979. Any 1×1 cell that was snow covered during at least one pentad of this interval is assigned an albedo by averaging the cell values for the six pentads. Snow data are from the NOAA visible snow charts.
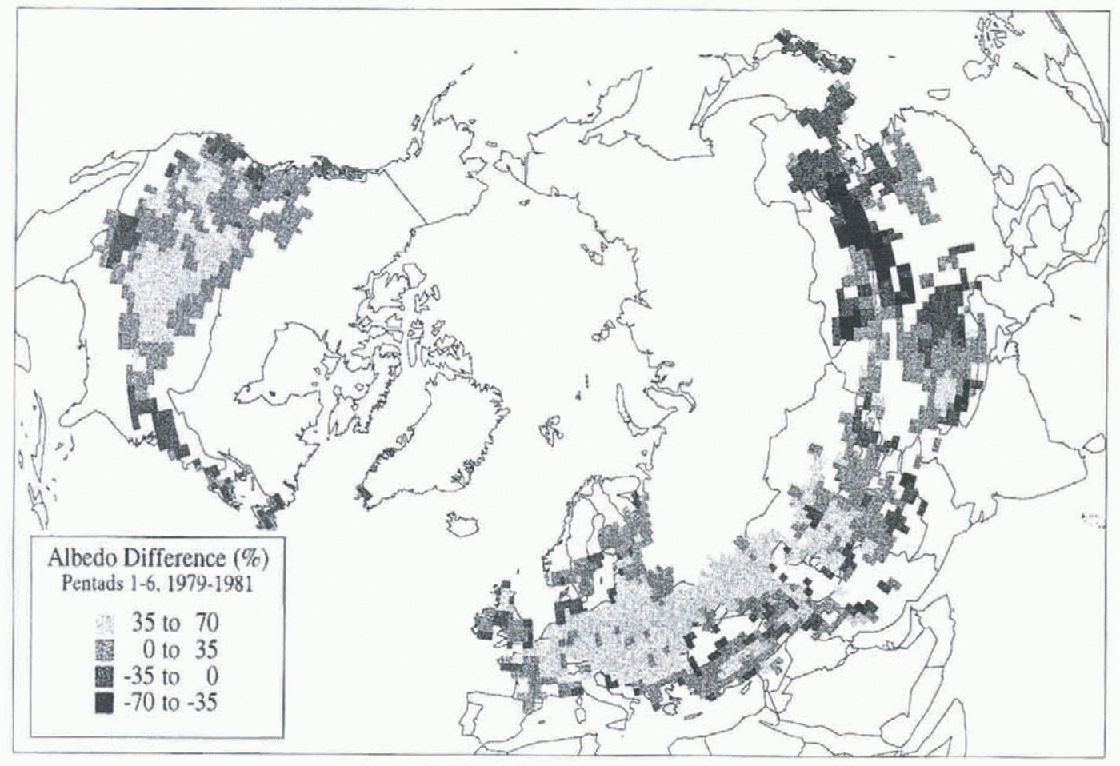
According to the NOAA visible charts, snow cover during the first six pentads of 1979 was at a maximum for the 1972–96 interval. When compared to the albedos calculated for this interval in 1981, when snow cover was at a minimum, large differences in albedo are observed (Fig. 2). In many areas of the United States and western Eurasia, the 1979 albedos exceeded those in 1981 by 35% or more (although, as discussed below, 1981 European snow cover was apparently underestimated in the visible charts). Much more extensive 1981 cover in lightly vegetated areas of eastern Asia resulted in 1979 albedos in this region being as much as 35–70% lower than in 1981.
Difference in estimated surface albedo (in percent) between the first six pentads of 1979 and 1981. Cells are shaded if they are (1) covered by snow in at least one of the first six pentads in either year, and (2) the percent snow cover, thus the albedo, differed between the two intervals.
Comparison of Snow Products
Snow extent
The integrated dataset will provide more accurate snow information than any of its individual components alone, as the streugths of one source will compensate for the weaknesses of another. In the process we with learn better how well each product depicts snow cover. Clearly, where the visible and microwave products report similar spatial frequencies of snow coverage, confidence is high, particulary where verified with station observations. Comparisons of visible and microwave frequencies of snow extent for the first six pentads of 1979 and 1981 are shown in Figure 3. There is considerable agreement over most Northern Hemisphere lands. However, there are some notable exceptions, particularly in the snow transition zone, where snow coverage is 10–90%. The microwave charts show more extensive snow cover than the visible charts over the Tibetan plateau (especially in 1979) and the arid lowlands of east Asia, as well as over the higher elevations of western North America (especially in 1981). There is a tendency for the SMMR algorithm to overestimate snow extent in cold and arid regions, particularly at high elevations (Reference Robinson, Spies, choudhury, Kerr and PampaloniRobinson and Spies, 1995). This is due to surface and atmospheric conditions in these regions differing from those assumed in the development of the global snow algorithm. Thus the brightness temperatures measured by the satellite and incorporated in the algorithm do not provide an accurate assessment of snow cover. The better agreement between the visible and microwave charts over Tibet in 1981, compared to 1979, is due to visible reports of more extensive snow in 1979. Better agreement over the western U.S. in 1979 is also due to the extensive snow cover reported on the visible charts.
Difference of visible and microwave snow cover frequencies for the first six pentads of (a) 1979 and (b) 1981. Values are positive (negative) where the visible file shows more frequent cover than the microwave (SMMR) file.
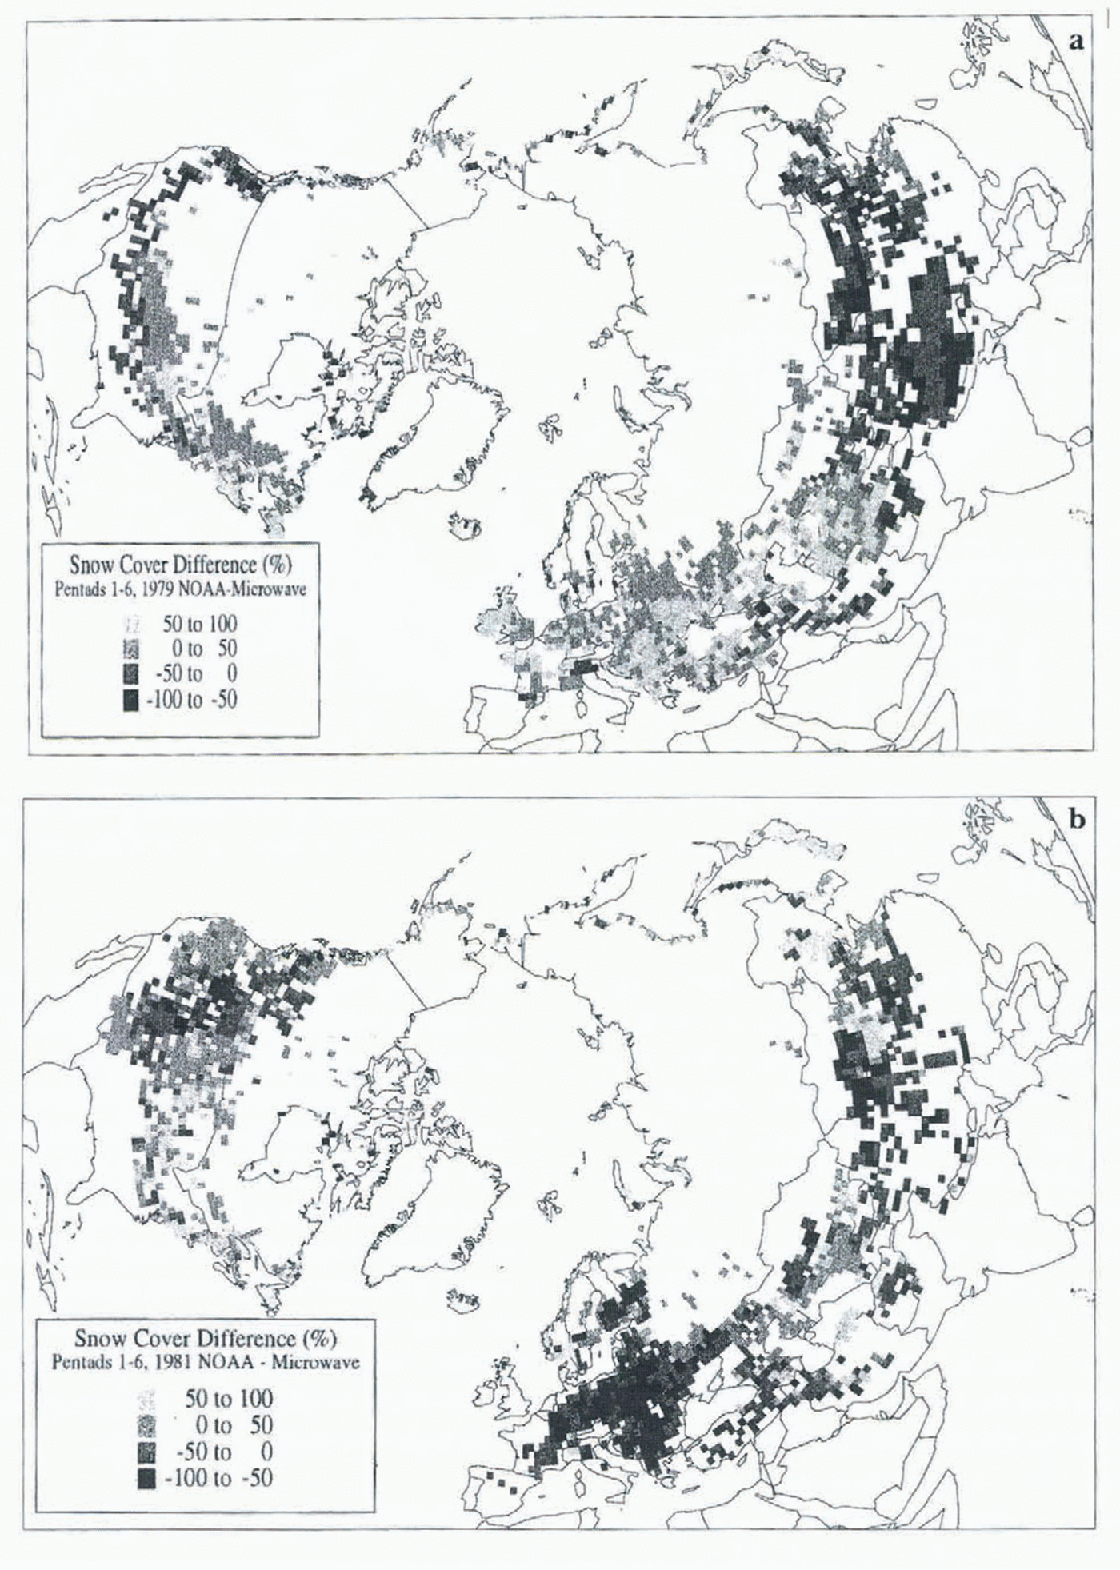
The visible product generally shows more snow cover than the microwave over the eastern two thirds of North America in 1979 and 1981, and in 1979 over western Asia and Europe. Station data indicate that in these cases the visible product is the more accurate of the two. Apparently, a combination of four factors explains this: (1) vegetation protruding through the snowpack affects the brightness temperatures recorded by the microwave sensor, (2) the snowpack may be shallow and patchy, again affecting brightness temperatures, (3) the snowpack may be wet, resulting in brightness temperatures similar to snow-lice ground, and (4) the water content of clouds is high enough to interfere with or prevent the surface microwave signal from reaching the satellite.
In 1981, a considerably more extensive snow cover over Europe was indicated by the microwave product than the visible one. Station observations and an examination of the two satellite products indicate that in this case the microwave estimates are more accurate than the visible ones. This is apparently due to persistent cloud cover over this region preventing the charter from making an accurate assessment of snow conditions throughout the study interval. A more detailed analysis of all three datasets is required to quantify all the differences discussed above.
Snow depth
Both the station and microwave data provide estimates of snow depth (or water equivalent . An ongoing investigation over extensive spatial and temporal dimensions is helping to quantify the limitations of these files with respect to depth. Preliminary comparisons of SMMR and HDCD data over the United States indicate that station depths are greater than microwave estimates east of the Mississippi basin, while the opposite situation is seen over the Great Plains. A mixed signal is observed in the mountainous west. We speculate that the protruding vegetation in the east results in an underestimation of microwave depths, and blowing and drifting snow results in an underestimation of regional snow depth at stations in the Creat Plains.
Snow-Cover Variability: 1972-Present
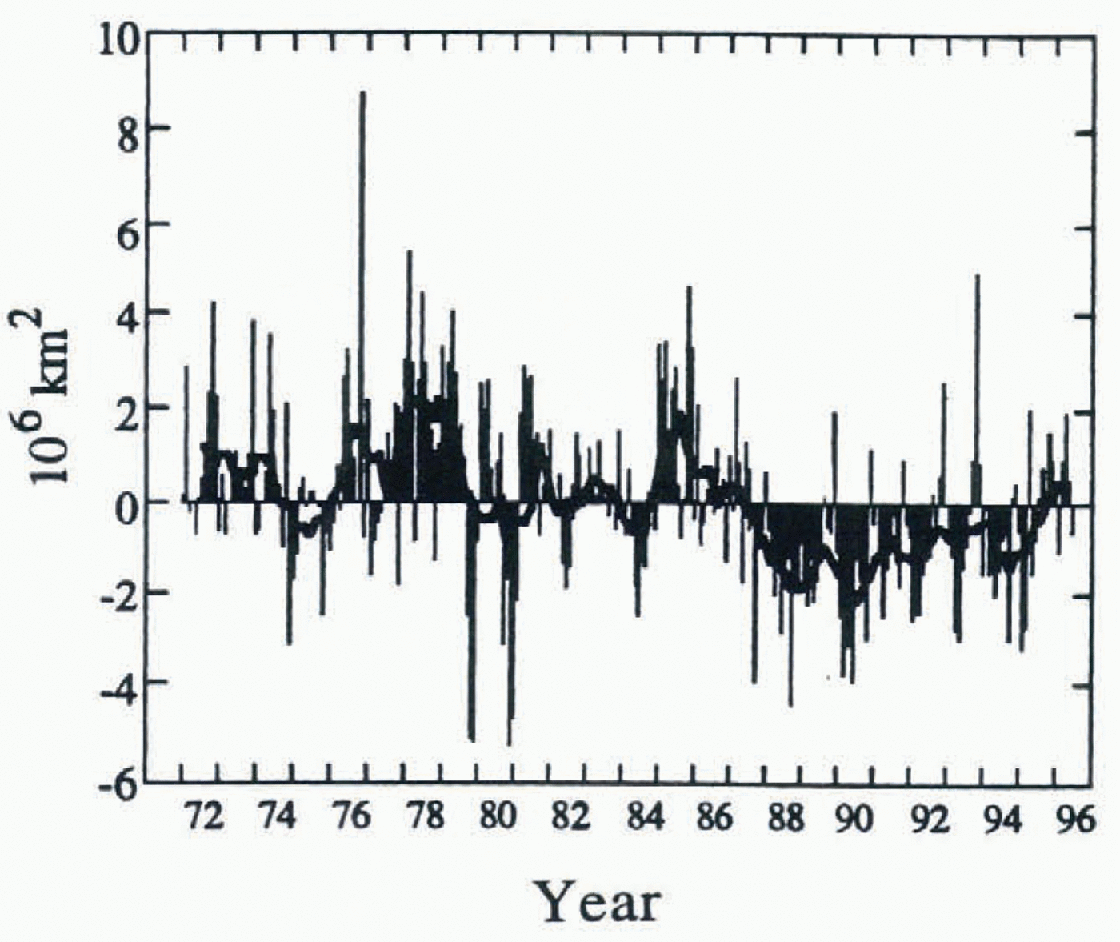
A time series of Northern Hemisphere snow extent covering the period between January 1972 and April 1996 indicates that recent years show less snow cover than the earlier part of the record (Fig. 4). This difference, which is noted over both Eurasia and North America, is not associated with a steady decrease of snow extent, but rather with two pronounced regimes since the early 1970s. Between 1972 and 1985, 12 month running means of snow extent fluctuated around a mean of 25.9 × 10⁶ km2. A rather abrupt transition occurred in 1986 and 1987, and since then mean annual extent has been 24.2 × 10 km2. The means of these two periods are significantly different (t test, p < 0.01). Recent decreases in snow extent are large during the late winter through early summer, while late summer through early winter extents show no statistically significant change.
Anomalies of monthly snow-cover extent over. Northern Hemisphere lands (including Greenland) between January 1972 and Angust 1996. Also shown are 12 month running anomalies of hemispheric snow extent, plotted on the seventh month of a given interval. Anomalies are calculated from NOAA visible charts. Mean hemispheric snow extent is 25.3 × 10⁶ km2 fir the full period of record (see Reference RobinsonRobinson, (1993a) for a discussion of the Rutgers method used to calculate monthly snow cover).
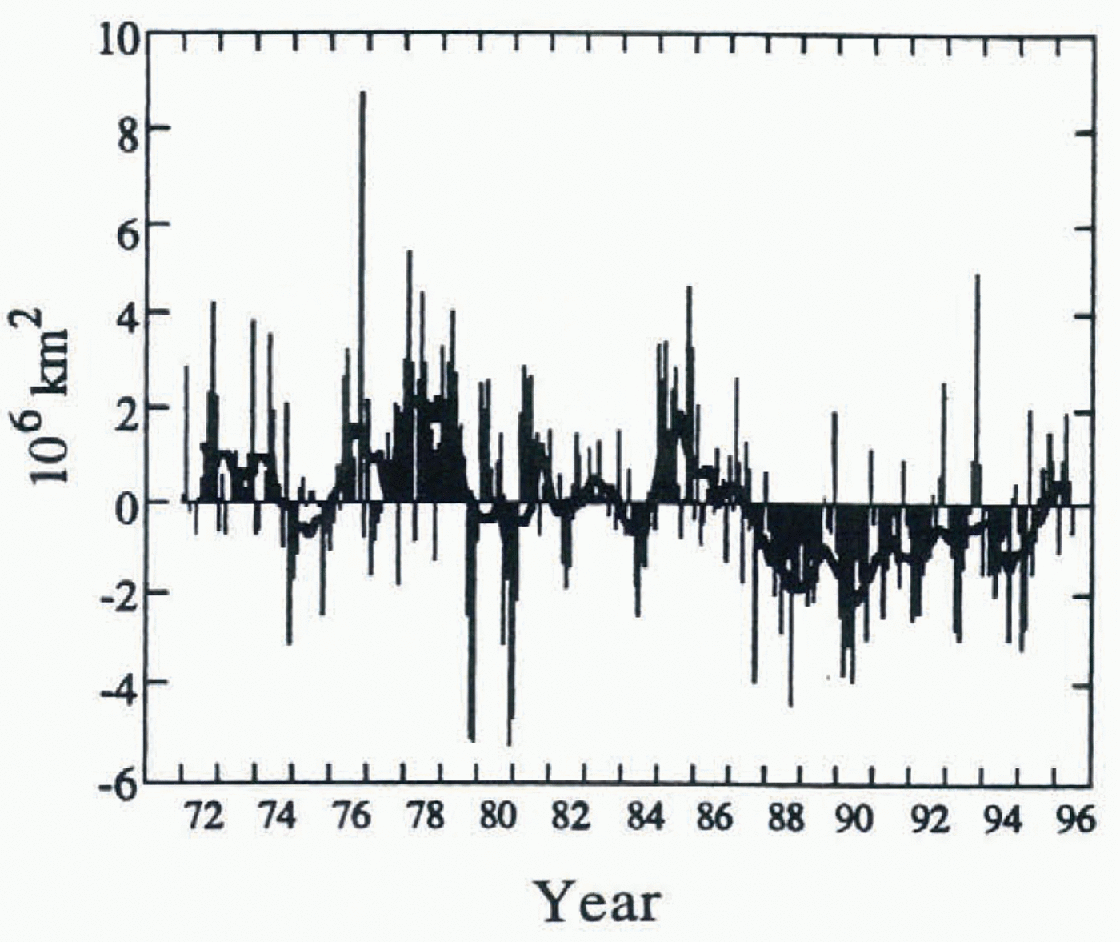
Given the relatively short time in which hemispheric monitoring of snow cover has been possible from space, it is difficult to understand fully the significance of the apparent stepwise change in snow extent in the middle 1980s. It is certainly premature to ascribe the less-extensive regime in recent years to a global warming. However it is noteworthy that the extent of snow cover appears to be related inversely to hemispheric surface air temperature (Reference Robinson and DeweyRobinson and Dewey, 1990), and, particularly in spring, feedbacks associated with the extent of the snowpack may be strongly influencing temperature (Reference Groisman, Karl and KnightGroisman and others, 1994).
Conclusions
Development of the integrated snow cover and surface albedo dataset discussed in this paper is an ongoing activity at Rutgers. Plans to add to, and otherwise improve, the set include: (1) adding 1966–71 visible charts once the current reanalysis is completed, (2) adjusting microwave estimates when regionally specific algorithms become available, (3) improving the surface-albedo estimation technique, and (4) adding additional station data as opportunities to acquire retrospective datasets arise. Observations in future years will also be appended to the dataset as they become available.
Studies using the new integrated snow and albedo dataset in conjunction with other climatic information are helping the climate group at Rutgers to place recent variations in an historic perspective (cf. Reference Hughes, Frei and RobinsonHughes and others, 1996), to understand better the synergistic relationships between hemispheric-scale atmospheric circulation and thermal variations and continental snow extent (Reference Frei, Robinson and HughesFrei and others, 1996), and to verify snow output from general circulation models (Reference Frei and RobinsonFrei and Robinson, 1995) These and future snow investigations will help establish more meaningful projections of future climatic states.
Acknowledgements
Thanks to D. Gartett and A. Basist at the NOAA Climate Prediction Center for providing the NOAA snow chart and SSM/I data, respectively; to A. Chang at the NASA Goddard Space Flight Center for the SMMR data; and to A. Frei, M. G. Hughes and J.J. Wright at Rutgers for contributing to the data analysis. This work is supported by NSF grants ATM-9311721 and SBR-9320786 and NASA grant NAGW-3568.