1 Introduction
Across a variety of disciplines, the analysis of data with missing values has recently been characterized by two trends that have yet to be reconciled. First, to avoid the problems caused by popular ad-hoc methods such as listwise deletion (discarding rows of the dataset that contain any missing values), analysts are increasingly turning to principled techniques for imputing, or filling in, missing values recommended by the statistics community. The most widely used of these techniques, multiple imputation (MI), involves replacing each missing element with several values that preserve relationships within the observed data while representing uncertainty about the correct value. In the words of a prominent scholar of missing-data analysis, “[MI] is now accepted as the best general method to deal with incomplete data in many fields” (van Buuren, Reference van Buuren2012, 25).
Second, advances in computational power, efficiency, and storage capacity have enabled the compilation and analysis of unprecedentedly large and complex datasets, ushering in an era of so-called “Big Data.” While massively increasing the amount of information available for analysis, however, this development has not eliminated the problem of missing data. That is, bigger data have not necessarily translated into more complete data.
The growing scale and complexity of data present a computational challenge for existing MI algorithms, which were generally designed for small or medium-sized applications with relatively simple (mostly linear) structures. While working well in many settings, these algorithms can suffer from performance problems when applied to larger datasets with features such as high dimensionality, severe nonlinearities, and unconventional functional forms. Convergence failures and slow—sometimes prohibitive—runtimes become increasingly common with imputations more likely to take on extreme and unusual values. Analysts can thus face an unappealing choice: limit the size or complexity of the data passed into the MI algorithm, risking bias and reducing statistical efficiency; or employ an ad-hoc method that can be applied to the original data, such as listwise deletion or mean imputation (replacing missing data with observed column averages), creating an even greater risk of bias and guaranteeing inefficiency (Little and Rubin, Reference Little and Rubin1987, Ch. 3-4).Footnote 1
This article proposes an accurate, fast, and scalable approach to MI, which we call MIDAS (Multiple Imputation with Denoising Autoencoders). MIDAS employs a class of unsupervised neural networks known as denoising autoencoders (DAs), which were recently developed to optimize the task of dimensionality reduction. DAs corrupt a subset of input data via the injection of stochastic noise and attempt to reconstruct it through a series of nested nonlinear transformations. The key innovation in MIDAS is to treat missing values as an additional portion of corrupted data and thus draw imputations from a model trained to minimize the reconstruction error on the originally observed portion. To reduce the risk of overfitting, we train this imputation-repurposed DA with the technique of dropout, which extends the corruption process deeper into the neural network architecture. With the combination of denoising and dropout, MIDAS employs an effectively nonparametric imputation model that places constraints not on the joint distribution of the data—the standard approach to MI—but only on the distribution of possible functions that characterize the data. Functional flexibility enables the model to capture simple as well as highly complex relationships between variables, providing the basis for performance gains across diverse data types and structures. This flexibility, we believe, makes MIDAS a useful complement to existing MI strategies in a wide range of fields where large and complex data are becoming common, including political science, economics, public health, computer science, and other parts of the social and natural sciences.
To implement MIDAS, we develop an efficient algorithm that expands the range and quantity of data that can be analyzed with MI. This procedure leverages the powerful and flexible computational architecture of the TensorFlow programming platform, allowing a wide variety of data types and supporting high degrees of parallelization on supported systems. As a companion to this article, we make the algorithm available in an easy-to-use Python class (MIDASpy) and R package (rMIDAS)—the first full-featured, open-source software for performing MI with neural network technology.Footnote 2
We illustrate MIDAS’s accuracy and scalability through a series of systematic tests involving real as well as simulated data.Footnote 3 We first conduct two Monte Carlo simulation experiments that assess MIDAS’s accuracy under the statistical conditions assumed by the dominant approach to MI, namely, joint multivariate normality. The first experiment establishes that MIDAS yields accurate estimated posterior densities and confidence intervals for linear regression coefficients, while the second shows that the accuracy of MIDAS’s imputed values and parameter estimates compares favorably with that of leading existing MI algorithms. We then move to a more realistic setting, introducing varying levels and patterns of missingness into a widely used census dataset. We find that MIDAS yields more accurate imputed values than other MI algorithms across most missingness conditions, even performing well under patterns where MI cannot avoid some degree of bias.
We test MIDAS’s scalability by sampling increasing numbers of rows and columns from a popular electoral survey that typifies the kind of large and complex data analyzed by political scientists. MIDAS produces completed datasets in consistently less time than existing MI algorithms, with the gap increasing linearly with the number of rows and exponentially with the number of columns. Even with modestly-sized datasets, MIDAS’s efficiency translates into substantial time savings for analysts. For datasets approaching the dimensions of modern Big Data, where existing MI algorithms can be impractically slow, it may make the difference between employing a principled and valid approach to analyzing missing data and resorting to an ad-hoc method that results in biased and inefficient inferences.
Finally, we provide an applied illustration of MIDAS’s capacity to handle datasets that pose computational problems for existing MI algorithms—that is, to give us access to new substantive knowledge—that involves estimating the latent ideology of participants in the electoral survey used in the scalability test. We show that substituting MIDAS for listwise deletion, which enables us to recover estimates for more than 10,000 additional respondents, materially alters our understanding of the distribution of latent ideology in the sample and of the relationship between this variable and presidential job approval.
2 MIDAS: Theory and Implementation
2.1 Multiple Imputation
The first building block of MIDAS, MI, consists of three steps: (1) replacing each missing element in the dataset with M independently drawn imputed values that preserve relationships expressed by observed elements; (2) analyzing the M completed datasets separately and estimating parameters of interest; and (3) combining the M separate parameter estimates using a simple set of rules that leverages variation across these datasets to reflect our uncertainty about the correct imputation model.Footnote 4
The dominant approach to MI assumes that the complete data follow a multivariate normal distribution, which implies that each variable is continuous and a linear function of all others (e.g., King et al., Reference King, Honaker, Joseph and Scheve2001; Honaker and King, Reference Honaker and King2010). An alternative approach models each variable’s distribution conditionally on all others in an iterative fashion, typically using a generalized linear estimator, which allows for a wider class of variable types and distributions (e.g., Kropko et al., Reference Kropko, Goodrich, Gelman and Hill2014). Imputed values, however, need not be drawn from a posterior density. A notable nonparametric approach is predictive mean matching, which involves replacing missing values with observed ones from similar rows (according to a chosen metric) (e.g., Cranmer and Gill, Reference Cranmer and Gill2013).
All approaches to MI share three attractive features. First, they yield unbiased estimates of parameters in the subsequent analytical model (e.g., regression coefficients) under a fairly wide range of statistical conditions: data are either missing completely at random (MCAR), that is, the pattern of missingness is independent of observed and missing data, or missing at random (MAR), that is, this pattern depends on observed data. They cannot avoid bias when data are missing not at random (MNAR), that is, missingness depends on missing data, although can still perform well if the observed data include strong predictors of missingness (Lall, Reference Lall2016).Footnote 5 Second, they tend to result in more efficient estimators than methods that do not utilize all observed values (such as listwise deletion). Third, from a practical perspective, they are simple to implement because they do not require directly modeling the missingness mechanism and, due to the separation between imputation and analysis, can be combined with standard complete-data methods.
Although useful in many settings, existing approaches to MI also have a common limitation: they can perform poorly with the kinds of large and complex data that are becoming common. This is in part because extreme departures from their assumptions occur more frequently in these data and in part due to problems of computational implementation. Most approaches are implemented with a variant of either the imputation-posterior algorithm, which draws missing values from the appropriate posterior distribution using Markov chain Monte Carlo (MCMC) methods, or the expectation-maximization algorithm, a similar procedure that substitutes maximum likelihood estimates for posterior draws. For a variety of reasons—including their serial nature, sweep of the entire dataset at each iteration, and simultaneous updating of all parameters—both algorithms “have well-known problems with large data sets
 $\ldots $
creating unacceptably long run-times or software crashes” (Honaker and King, Reference Honaker and King2010, 564). Even when they do converge, they can fail to accurately approximate posteriors due to local maxima or major divergence from the assumed joint distribution. Some approaches seek to overcome these problems by combining one of the above algorithms with bootstrapping. As each bootstrapped sample is the same size as the original dataset, however, these routines can also slow down sharply or fail to converge when applied to large datasets. We later provide evidence of these scalability issues.
2.2 Denoising Autoencoder Neural Networks
MIDAS implements MI with the aid of artificial neural networks, a concept inspired by the structure of the human brain that has been used to enhance the accuracy and efficiency of a wide array of computational tasks. A neural network consists of a series of nested nonlinear functions usually depicted as interconnected nodes organized in layers. Input data are fed into the network through an input layer, processed by nodes in one or more hidden layers, and returned via nodes in an output layer. To more precisely describe these models, we adopt the linear algebraic notation typically used in the machine learning literature, which allows for concise expression of deeply nested functions: italicized upper-case symbols denote random vectors (e.g., X); bold lower-case symbols (
 $\mathbf {x}$
) denote ordinary column vectors, that is, realizations of random vectors; bold upper-case symbols denote matrices, with
 $\mathbf {D} = \{\mathbf {D}_{obs}, \mathbf {D}_{mis}\}$
denoting a dataset in which
 $\mathbf {D}_{obs}$
is observed and
 $\mathbf {D}_{mis}$
is missing; and superscripts in parentheses index hidden layers of a network.
The model for a “forward pass”—or computation of output values given input data—through layer h of a neural network is:
 $$\begin{align} \mathbf{y}^{(h)} = \sigma ( \mathbf{W}^{(h)} \mathbf{y}^{(h-1)} + \mathbf{b}^{(h)} ), \end{align}$$
where
 $\mathbf {y}^{(h)}$
is a vector of outputs from layer h (
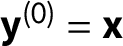 $\mathbf {y}^{(0)} = \mathbf {x}$
is the input),
 $\mathbf {W}^{(h)}$
is a matrix of weights connecting the nodes in layer
 $h-1$
with the nodes in layer h,
 $\mathbf {b}$
is a vector of biases for layer h, and
 $\sigma $
is a nonlinear activation function. The introduction of nonlinearity into the model enables neural networks to efficiently learn complex functional forms with few hidden layers. This model can be generalized to an arbitrary number of hidden layers H:
 $$ \begin{align} \mathbf{y} = \Phi ( \mathbf{W}^{(H)}[\cdots[\sigma ( \mathbf{W}^{(2)} [\sigma (\mathbf{W}^{(1)} \mathbf{x} + \mathbf{b}^{(1)})] + \mathbf{b}^{(2)})]\cdots] + \mathbf{b}^{(H)}), \end{align} $$
where
 $\mathbf {x}$
is a vector of inputs and
 $\Phi $
is a final-layer activation function that returns outputs with the appropriate distribution.
The parameters of the network (
 $\theta $
) are weights and biases, which are trained to minimize a loss function
 $L(\mathbf {y}, \hat {\mathbf {y}})$
that measures the distance between actual and predicted outputs. Training involves four steps, collectively known as an epoch, which are repeated until some convergence criterion is met: (1) performing a forward pass through the network using current
 $\theta $
; (2) calculating L; (3) using the chain rule to calculate error gradients with respect to weights in each layer, a technique called backpropagation; and (4) adjusting weights in the direction of the negative gradient for the next forward pass. Characteristics such as the number of training cycles per epoch, which are specified by the analyst rather than learned in training, are referred to as hyperparameters.
One class of neural networks that is naturally suited to the task of imputing missing data is the DA, an extension of the classical autoencoder—a well-established tool for dimensionality reduction in machine learning—proposed by Vincent et al. (Reference Vincent, Larochelle, Bengio and Manzagol2008). Classical autoencoders consist of two parts. First, an encoder deterministically maps an input vector
 $\mathbf {x}$
to a lower-dimensional representation
 $\mathbf {y}$
by compressing it through a series of shrinking hidden layers that culminate in a “bottleneck” layer (indexed by B):
 $$ \begin{align} \mathbf{y} = f_\theta(\mathbf{x}) = \sigma( \mathbf{W}^{(B)}[...[\sigma ( \mathbf{W}^{(2)} [\sigma (\mathbf{W}^{(1)} \mathbf{x} + \mathbf{b}^{(1)})] + \mathbf{b}^{(2)})]...] + \mathbf{b}^{(B)}) \end{align} $$
Second, a decoder maps
 $\mathbf {y}$
back to a reconstructed vector
 $\mathbf {z}$
with the same probability distribution and dimensions as
 $\mathbf {x}$
by passing it through a parallel series of expanding hidden layers culminating in the output layer:
 $$ \begin{align} \mathbf{z} = g_{\theta^\prime} (\mathbf{y}) = \Phi ( \mathbf{W}^{(H) \prime}[...[\sigma ( \mathbf{W}^{(B+2) \prime} [\sigma (\mathbf{W}^{(B+1) \prime} \mathbf{y} + \mathbf{b}^{(B+1) \prime})] + \mathbf{b}^{(B+2) \prime})]...] + \mathbf{b}^{(H) \prime}) \end{align} $$
To map
 $\mathbf {z}$
as closely as possible to
 $\mathbf {x}$
, weights are adjusted by backpropagation to minimize a loss function
 $L(\mathbf {x}, \mathbf {z})$
. This process yields a latent representation that captures the key axes of variation in
 $\mathbf {x}$
in a similar manner to principal component analysis.
DAs were developed to prevent autoencoders from learning an identical representation of the input (the identity function) while enabling them to extract more robust features from the data, that is, features that generalize better to new samples from the same data-generating process. They achieve these benefits by partially corrupting inputs through the injection of stochastic noise:
 $\mathbf {x} \rightarrow \tilde {\mathbf {x}} \sim q_D (\mathbf {x}|\tilde {\mathbf {x}})$
. The corrupted input is then mapped to a hidden representation
 $\mathbf {y} = f_{\theta }(\tilde {\mathbf {x}})$
, from which a clean or “denoised” version
 $\mathbf {z} = g_{\theta ^\prime }(\mathbf {y})$
is reconstructed. Unlike before, however,
 $\mathbf {z}$
is now a deterministic function of
 $\tilde {\mathbf {x}}$
(not
 $\mathbf {x}$
).
The most common corruption process involves setting a random subset of inputs to 0.Footnote 6 In attempting to recover these elements, the DA effectively performs a form of imputation: predicting corrupted (missing) elements based on relationships among uncorrupted (observed) elements. That is, missing values can be seen as a special case of corrupted input data. Building on this insight, recent studies have developed application-specific models for imputing missing values with DAs, reporting impressive performance (e.g., Beaulieu-Jones and Greene, Reference Beaulieu-Jones and Greene2016; Duan et al., Reference Duan, Lv, Kang and Zhao2014). These studies, however, neither offer a general model of DA-based imputation nor combine DAs with MI, forgoing the latter’s advantages vis-á-vis single imputation in bias reduction, efficiency, and uncertainty representation.
To our knowledge, the only existing attempt to implement MI using DAs comes from Gondara and Wang (Reference Gondara and Wang2018), who propose a model in which data are provisionally completed using mean or mode imputation before being corrupted and passed into the DA.Footnote 7 While Gondara and Wang offer a relatively brief overview of their approach, it appears to suffer from three limitations. First, its loss functions fail to distinguish between originally observed and originally missing values, causing reconstruction error to be measured against the mean/mode imputations, which typically lead to biased parameter estimates. Second, it injects stochastic noise into inputs once rather than in each training epoch, increasing the risk of overfitting and reducing model robustness. Third, instead of sampling from a single trained network, it trains a different network for each set of imputations, substantially slowing runtime—storing all trained models and imputations in memory is computationally demanding—without improving performance. In the rest of the section, we present an alternative approach to MI based on DAs that avoids these issues.
2.3 The MIDAS Model
MIDAS modifies the standard DA model in two key ways. First, as part of the initial corruption process, it forces all missing values—in addition to a random subset of inputs—to 0. The task of the DA is thus to predict corrupted values that were both originally missing (
 $\tilde {\mathbf {x}}_{\text {mis}}$
) and originally observed (
 $\tilde {\mathbf {x}}_{\text {obs}}$
) using a loss function that only includes the latter. Second, to further reduce the risk of overfitting, MIDAS regularizes the DA with the complementary technique of dropout. Introduced by Hinton et al. (Reference Hinton, Srivastava, Krizhevsky, Sutskever and Salakhutdinov2012), dropout involves randomly removing (or “dropping”) nodes in the hidden layers of a network during training, typically by multiplying outputs from each of these layers by a Bernoulli vector
 $\mathbf {v}$
that takes a value of 1 with probability p:
 $\tilde {\mathbf {y}}^{(h)} = \mathbf {v}^{(h)} \mathbf {y}^{(h)}, \mathbf {v}^{(h)} \sim \text {Bernoulli}(p)$
. Dropout is thus a generalization of the idea behind DAs, extending stochastic corruption to the hidden layers and hence enabling the extraction of even more robust features.
Dropout training proceeds by sampling an arbitrary number of “thinned” networks, with a different set of nodes dropped in each iteration. At test time, Hinton et al. propose scaling the weights of a single unthinned network by the probability that their originating nodes were retained during training. To produce multiple imputations, MIDAS instead samples M thinned networks. This procedure has recently received a powerful independent justification from Gal and Ghahramani (Reference Gal and Ghahramani2016), who show through simulation experiments that it results in more accurate parameter estimation with no additional model complexity or training time. Notably, they also prove that dropout training is mathematically equivalent to a Bayesian variational approximation of a Gaussian process (GP), a commonly used probability distribution over functions. The implication is that MIDAS posits not a joint distribution of the data but a distribution over possible functions that describe the data. Since GP models can estimate any continuous function arbitrarily well—they are usually considered nonparametric because they have a potentially infinite number of parameters—MIDAS can thus capture a wider class of joint distributions than existing approaches to MI without making any additional parametric assumptions.
The encoder of an imputation-generating DA trained with dropout—a MIDAS network—can thus be described as:
 $$ \begin{align} \tilde{\mathbf{y}} = f_\theta(\tilde{\mathbf{x}}) = \sigma( \mathbf{W}^{(B)} \mathbf{v}^{(B)} [...[\sigma ( \mathbf{W}^{(2)} \mathbf{v}^{(2)} [\sigma (\mathbf{W}^{(1)} \tilde{\mathbf{x}} + \mathbf{b}^{(1)})] + \mathbf{b}^{(2)})]...] + \mathbf{b}^{(B)}). \end{align} $$
The decoder, in turn, becomes:
 $$ \begin{align} \mathbf{z} = g_{\theta^\prime} (\tilde{\mathbf{y}}) = \Phi ( \mathbf{W}^{(H) \prime}[...[\sigma ( \mathbf{W}^{(B+2) \prime} [\sigma (\mathbf{W}^{(B+1) \prime} \tilde{\mathbf{y}} + \mathbf{b}^{(B+1) \prime})] + \mathbf{b}^{(B+2) \prime})]...] + \mathbf{b}^{(H) \prime}), \end{align} $$
where
 $g\mathrel {\dot \sim } \text {GP}$
and
 $\mathbf {z}$
represents a fully observed vector containing predictions of
 $\tilde {\mathbf {x}}_{\text {obs}}$
and
 $\tilde {\mathbf {x}}_{\text {mis}}$
. To produce a completed dataset, predictions of
 $\tilde {\mathbf {x}}_{\text {mis}}$
are substituted for
 $\mathbf {x}_{\text {mis}}$
in
 $\mathbf {D}$
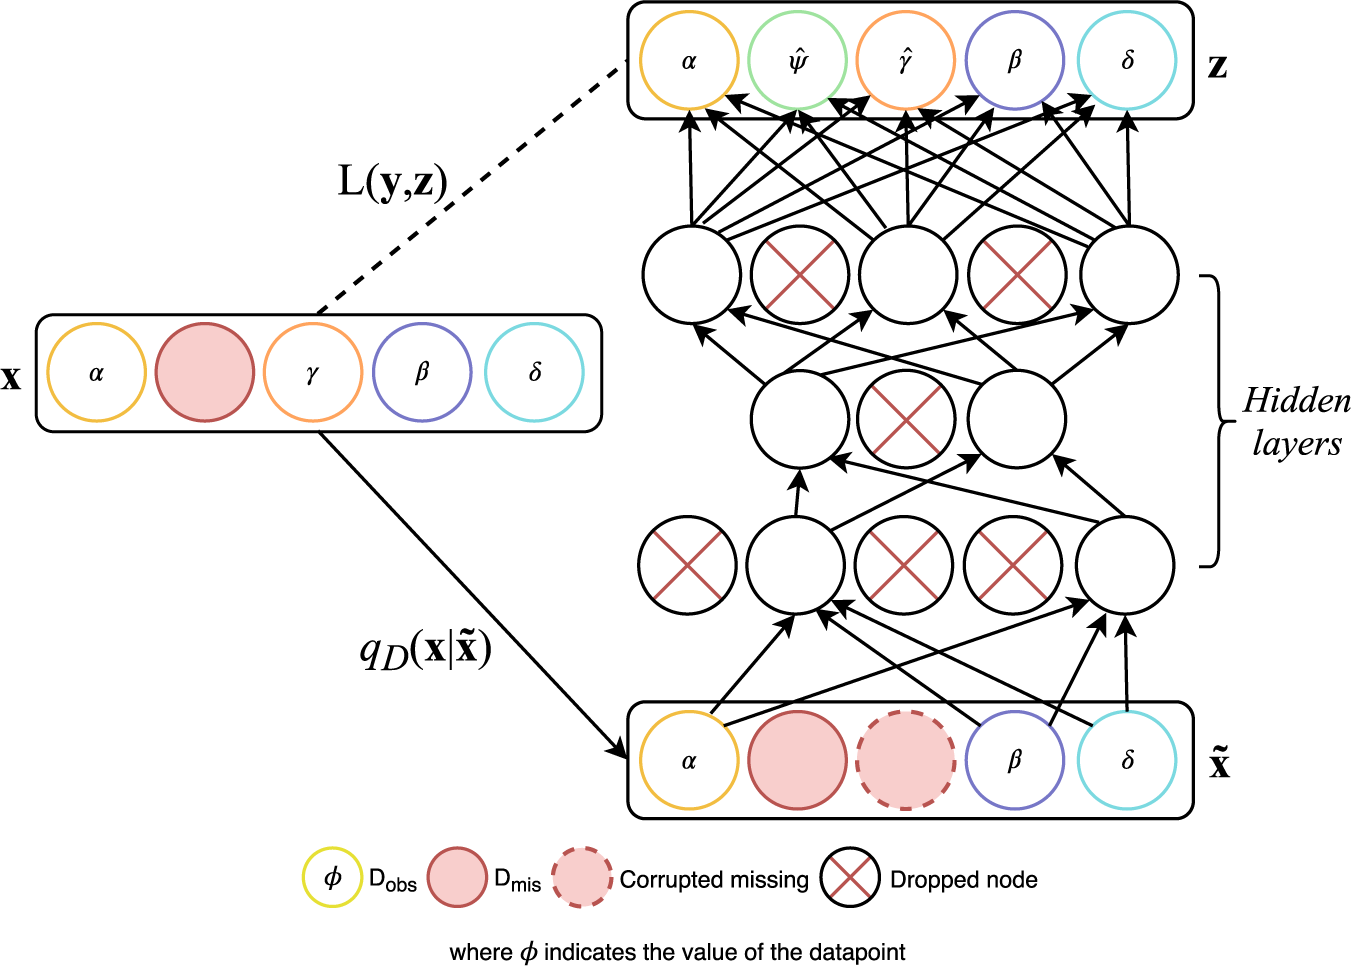
. The full architecture of a MIDAS network is illustrated in Figure 1.Footnote 8
MIDAS neural network architecture.
 $\mathbf {x}$
is a vector of inputs,
 $q_D(\mathbf {x}|\tilde {\mathbf {x}})$
is the corruption process, and
 $\mathbf {z}$
is the “denoised” version of
 $\tilde {\mathbf {x}}$
.

The default activation function in MIDAS is exponential linear unit (ELU), which is known to facilitate efficient training in deep neural networks. The final-layer activation function is chosen according to the distribution of the input data
 $\mathbf {x}$
, with identity, logistic, and softmax functions assigned to continuous, binary, and categorical variables, respectively. Loss functions take the same form as in a regular DA, measuring the distance between
 $\mathbf {x}$
and
 $\mathbf {z}$
:
 $L(\mathbf {x},\mathbf {z})$
. As we are only interested in the reconstruction error for predictions of originally observed corrupted values (
 $\tilde {\mathbf {x}}_{\text {obs}}$
), however, these functions are multiplied by a missingness indicator vector
 $\mathbf {r}$
. MIDAS employs root mean squared error (RMSE) and cross-entropy loss functions for continuous and categorical variables, respectively:
 $$ \begin{align} L(\mathbf{x},\mathbf{z}, \mathbf{r}) = \begin{cases} [\frac{1}{J} \sum_{j=1}^J\mathbf{r}_j(\mathbf{x}_j-\mathbf{z}_j)^2]^{\frac{1}{2}} & \text{if }\mathbf{x}\text{ is continuous} \\ -\frac{1}{J} \sum_{j=1}^J \mathbf{r}_j[\mathbf{x}_j \log \mathbf{z}_j + (1-\mathbf{x}_j) \log (1-\mathbf{z}_j)] & \text{if }\mathbf{x}\text{ is categorical.} \end{cases} \end{align} $$
In sum, unlike most existing approaches to MI, MIDAS does not assume a joint distribution of the data and use an iterative method to draw imputed values from the posterior of this distribution. Rather, it uses a neural network to “learn” the form of the data by fitting a series of nonlinear functions—in effect, a nonparametric model that only constrains the range of functions that are consistent with the data—which enables it to capture both simple and highly complex patterns. This is implemented by introducing additional missingness into the data during training, minimizing the reconstruction error for predictions of these corrupted values, and drawing imputations from the trained network.
2.4 Algorithm
The algorithm we have developed to implement MIDAS takes an incomplete dataset
 $\mathbf {D}$
as its input and returns M completed datasets. The algorithm proceeds in three stages, each comprising a number of smaller steps. In the first stage, the input data
 $\mathbf {D}$
are prepared for training. Categorical variables are “one-hot” encoded (i.e., converted into separate dummy variables for each unique class) and continuous variables are rescaled between 0 and 1 to improve convergence. In addition, a missingness indicator matrix
 $\mathbf {R}$
is constructed for
 $\mathbf {D}$
, allowing us to later distinguish between
 $\mathbf {D}_{\text {mis}}$
and
 $\mathbf {D}_{\text {obs}}$
, and all elements of
 $\mathbf {D}_{\text {mis}}$
are set to 0. A DA is then initialized according to the dimensions of
 $\mathbf {D}$
; the default architecture is a three-layer network with 256 nodes per layer.
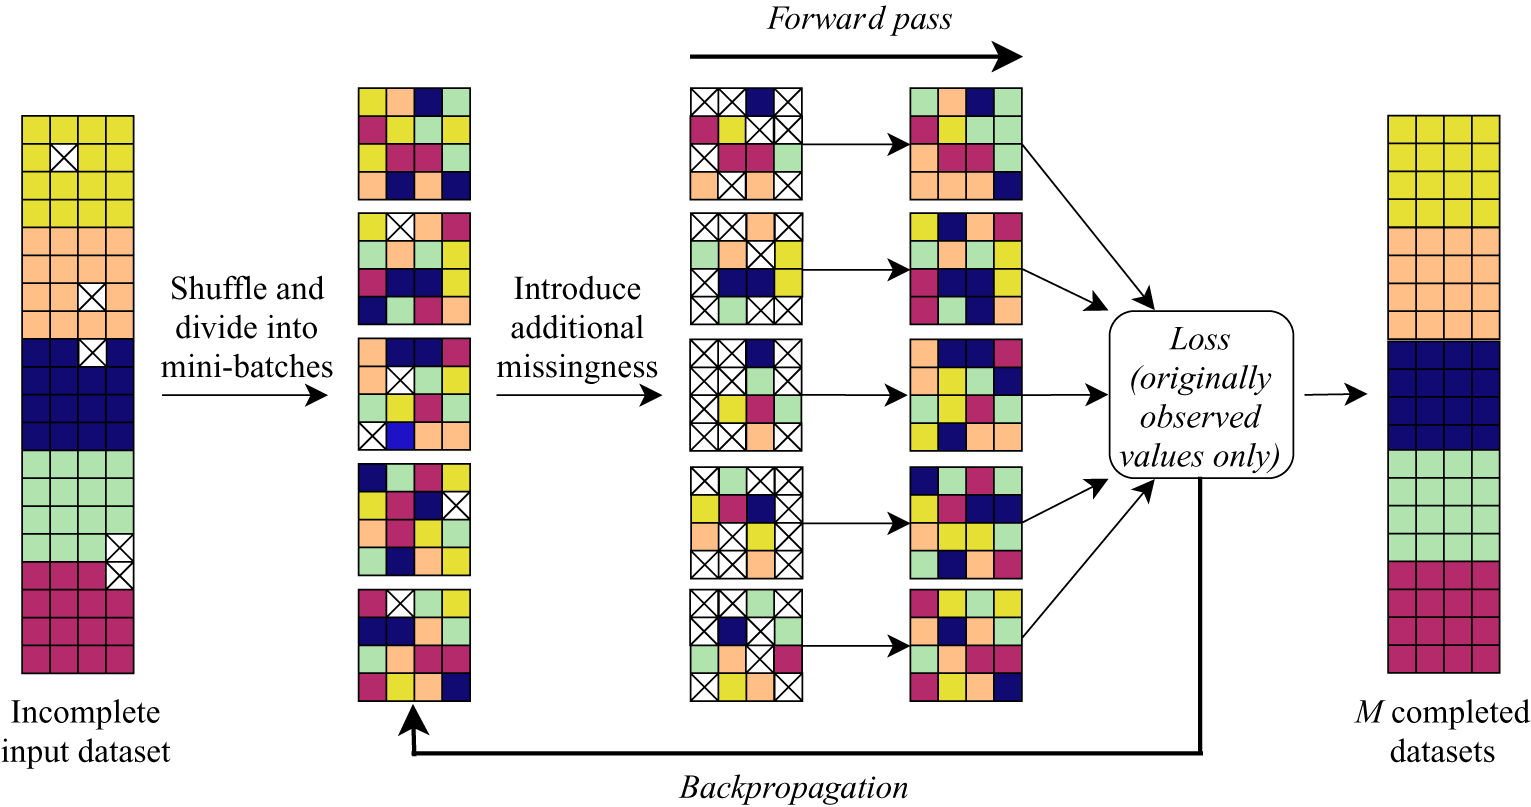
In the training stage, the following five steps are repeated (see Figure 2 for a visual schematic and Online Appendix 2B for a more formal description): (1)
 $\mathbf {D}$
and
 $\mathbf {R}$
are shuffled and sliced row-wise into paired mini-batches (
 $\mathcal {B}_{1},\mathcal {B}_{2},...,\mathcal {B}_{n}$
) to accelerate convergence; (2) mini-batch inputs are partially corrupted through multiplication by a Bernoulli vector
 $\mathbf {v}$
(default p = 0.8); (3) in line with standard implementations of dropout, outputs from half of the nodes in hidden layers are corrupted using the same procedure; (4) a forward pass through the DA is conducted and the reconstruction error on predictions of
 $\tilde {\mathbf {x}}_{\text {obs}}$
is calculated using the loss functions defined in Equation (7); and (5) loss values are aggregated into a single term and backpropagated through the DA, with the resulting error gradients used to adjust weights for the next epoch.
Schematic of MIDAS training steps. Shaded blocks represent data points (shades denote different variables); crosses indicate missing values.

Finally, once training is complete, the whole of
 $\mathbf {D}$
is passed into the DA, which attempts to reconstruct all (i.e., originally observed and originally missing) corrupted values. A completed dataset is then constructed by replacing
 $\mathbf {D}_{\text {mis}}$
with predictions of the originally missing values from the network’s output. This stage is repeated M times.
3 Accuracy Tests
How does MIDAS perform in practice? The next two sections present tests of the method’s accuracy and scalability involving both simulated and real data. We begin with two tough simulation tests that gauge MIDAS’s accuracy under the multivariate normal conditions assumed by the dominant approach to MI (without building a linearity constraint into the MIDAS model). The first is the “MAR-1” experiment first conducted by King et al. (Reference King, Honaker, Joseph and Scheve2001), which assesses whether MIDAS generates correct estimates of linear regression parameters; the second is the continuous component of a more general test conducted by Kropko et al. (Reference Kropko, Goodrich, Gelman and Hill2014), which also assesses the accuracy of MIDAS’s imputed values. The third part of the section tests MIDAS’s performance on similar metrics in a more realistic context by simulating a variety of missingness conditions in a popular census dataset.
3.1 MAR-1 Experiment
The MAR-1 experiment involves simulating 100 datasets containing 500 rows and five (moderately correlated) standardized variables
 $Y, X_1,..., X_4$
from a multivariate normal distribution. A mixed pattern of missingness is introduced, leaving an average of 72% of rows in each sample fully observed: Y and
 $X_4$
are MCAR, while
 $X_1$
and
 $X_2$
are MAR as a function of
 $X_3$
. We estimate the linear model
 $Y = \beta _0 + \beta _1 X_1 + \beta _2 X_2$
using four strategies: (1) MIDAS, which we implement using our Python class MIDASpy; (2) multivariate normal MI, implemented with the Amelia package in R (Honaker et al., Reference Honaker, King and Blackwell2011), which employs an expectation-maximization with bootstrapping algorithm; (3) listwise deletion; and (4) analysis of the complete dataset.Footnote 9
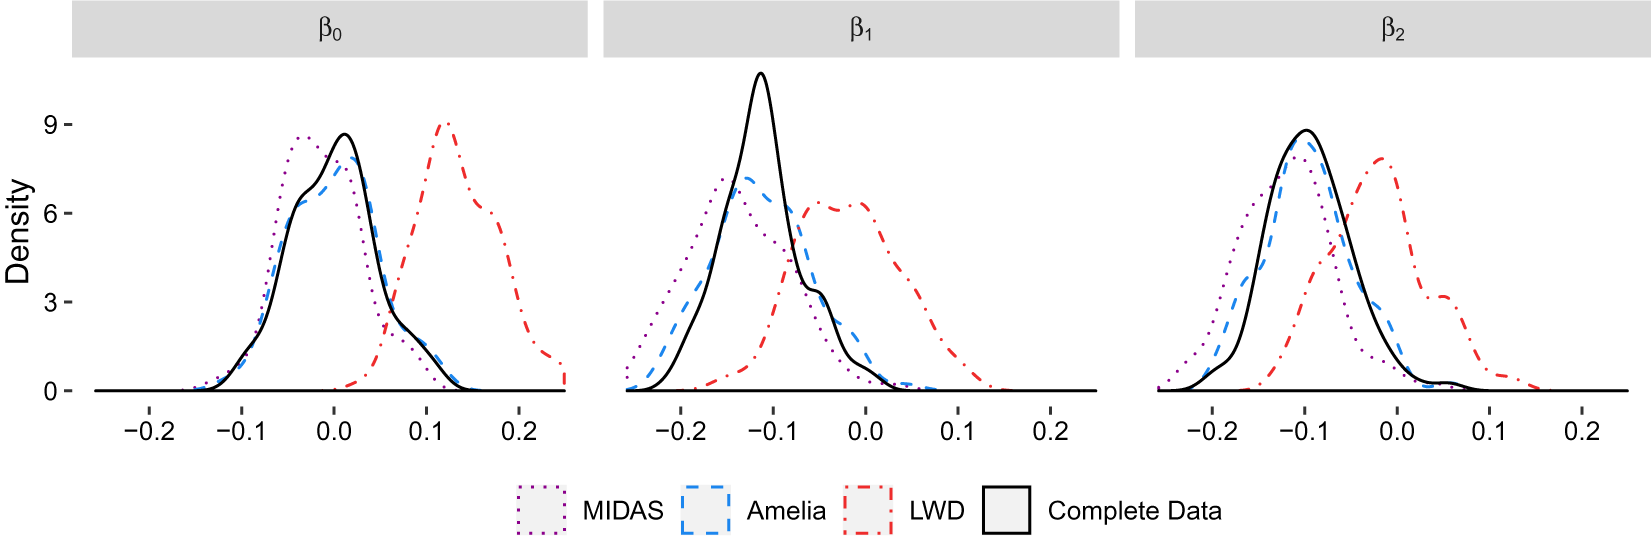
Figure 3 plots the posterior densities of the estimated coefficients on
 $\beta _0$
,
 $\beta _1$
, and
 $\beta _2$
for each strategy. For all three parameters, MIDAS yields very similar results to Amelia. Both sets of estimates are close to the true density, though in the case of
 $\beta _1$
have smaller peaks and larger variances (due to their lower information content). Listwise deletion estimates, by contrast, are severely biased away the true density of every parameter, mostly possessing the incorrect sign as well as a higher variance than the other densities. In Online Appendix 3, we further demonstrate that MIDAS and Amelia produce accurate estimated 95% confidence intervals, with listwise deletion again performing substantially worse.
Estimated posterior densities in MAR-1 simulation experiment. Coefficient estimates from a linear regression based on Monte Carlo-simulated data with 500 rows, 72% of which are fully observed, and five standardized variables drawn from a multivariate normal distribution.

3.2 Simulation Test of Imputation and Linear Model Quality
The continuous portion of Kropko et al.’s (Reference Kropko, Goodrich, Gelman and Hill2014) simulation-based accuracy test involves generating 1,000 multivariate normal datasets with 1,000 rows and 8 standardized variables, and inducing MAR missingness in 5 of the latter (with proportions of 0.1, 0.1, 0.1, 0.1, and 0.25). To assess how the strength of relationships between variables affects MIDAS’s performance, we generate two versions of the simulated datasets: one in which correlations between variables are moderate and another in which they are strong.Footnote 10
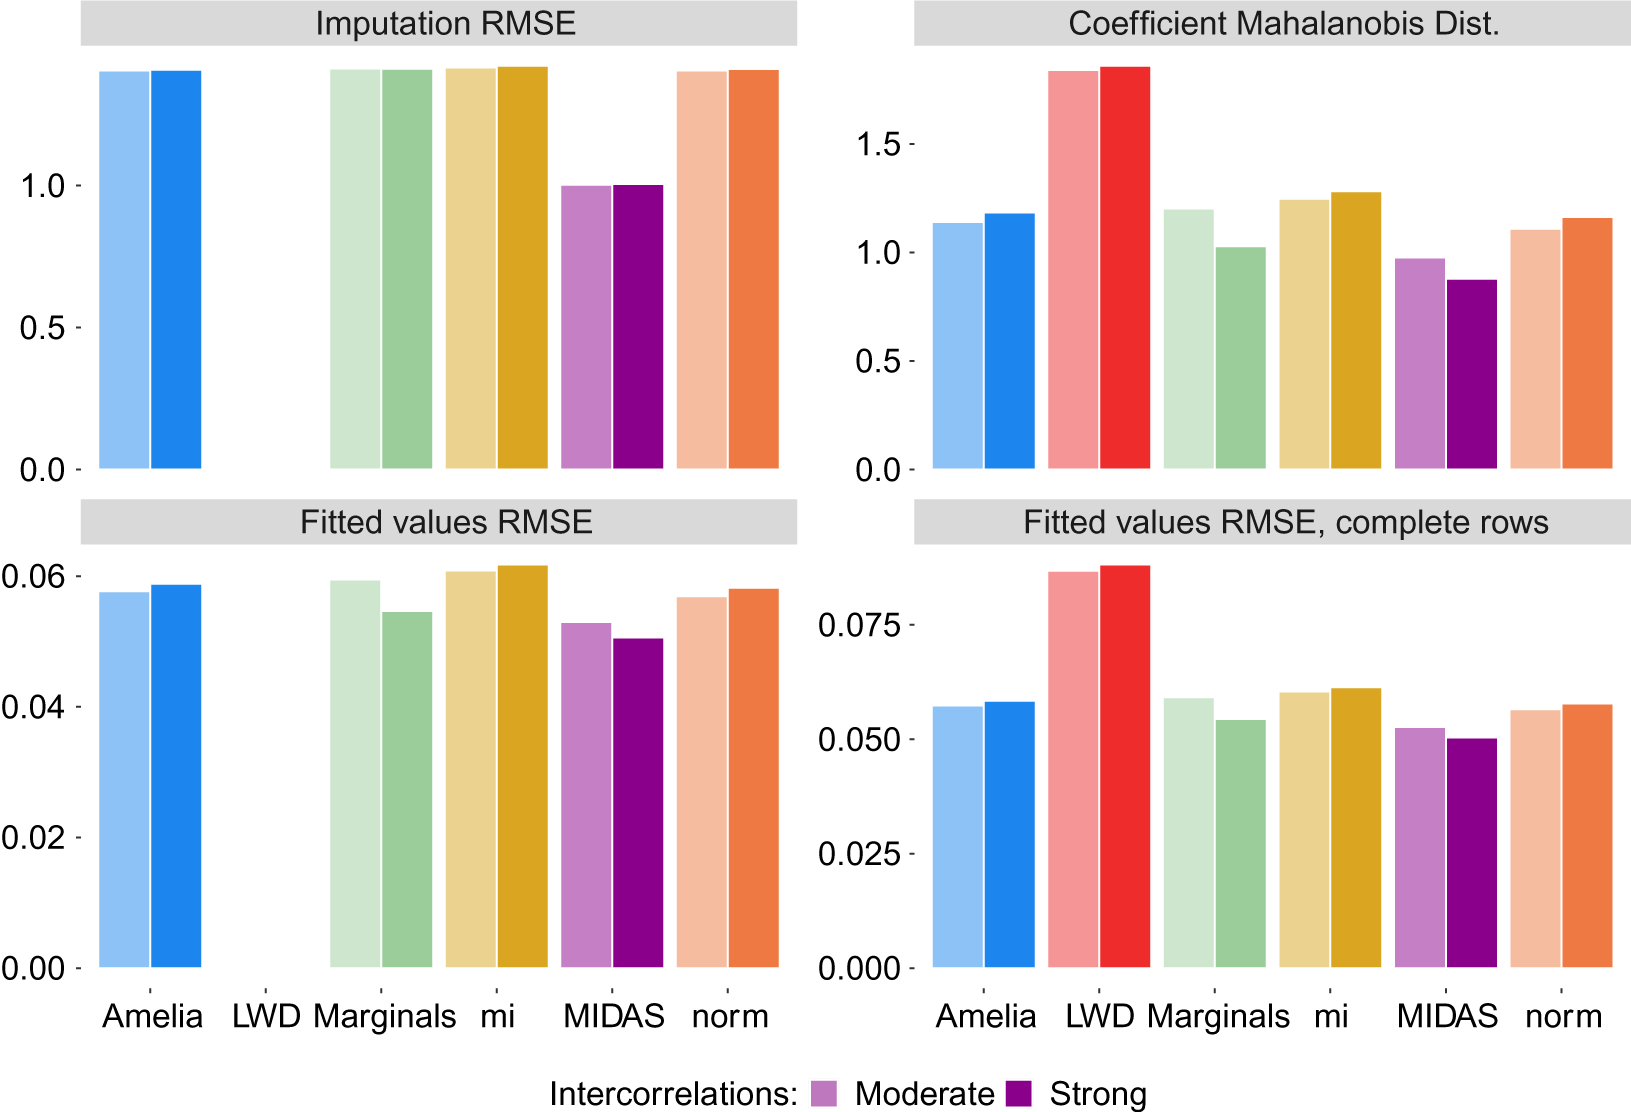
In addition to MIDAS, five missing-data strategies are applied to the incomplete datasets: (1) conditional MI, implemented with the mi package in R (Su et al., Reference Su, Gelman, Hill and Yajima2011); multivariate normal MI, implemented with (2) Amelia and (3) the norm package in R (which employs a traditional expectation-maximization algorithm) (Schafer and Olsen, Reference Schafer and Olsen1998); (4) listwise deletion; and (5) replacing missing values with draws from each variable’s marginal distribution. The six strategies are assessed on two metrics: (1) RMSE relative to true values (averaging imputed values) and (2) the accuracy of coefficient estimates from a regression of one variable on the remaining seven, measured as (i) the Mahalanobis distance between model estimates and complete-data estimates, (ii) the RMSE of model fitted values relative to complete-data fitted values, and (iii) the previous metric excluding incomplete rows.
The results are displayed in Figure 4. In the moderate-correlation scenario, MIDAS outperforms the other four MI strategies on all four metrics. When we strengthen correlations, this gap remains essentially the same in terms of imputation accuracy but becomes even larger in terms of coefficient and fitted-value accuracy (except with respect to marginal draws). Even without a linearity constraint, therefore, MIDAS can produce accurate imputations and parameter estimates under multivariate normality, with its absolute and relative performance improving with the strength of relationships between variables.
Inverse imputation and linear model accuracy in Kropko et al.’s simulation test. The results are based on Monte Carlo simulated data with 1,000 rows and 8 standardized variables, 5 of which contain MAR missingness, drawn from a multivariate normal distribution. Lower RMSE indicates greater imputation/fitted-value accuracy; lower Mahalanobis distances indicate greater coefficient accuracy.

3.3 Applied Test with Adult Dataset
Real data, of course, are rarely multivariate normal. We thus supplement the previous simulation exercises with an applied accuracy test based on the Adult dataset, an extract from the 1994 United States Census that measures 15 characteristics of 48,842 individuals (a mixture of continuous and categorical variables).Footnote 11 We select this dataset for two reasons. First, in addition to being frequently used by social scientists, it is a standard benchmarking dataset for machine learning tasks. Second, it is one of the few real social science datasets we were able to find that is almost entirely complete—just 0.009% of values are missing—which gives us near-complete discretion to manipulate missingness in the test (while mitigating possible concerns about the exclusion of originally missing values). Summary statistics for the dataset are provided in Online Appendix 3.
In contrast to the previous tests, we separately induce varying proportions of MCAR, MAR, and MNAR missingness in the dataset. For each missingness pattern, we create four versions of the dataset in which 30%, 50%, 70%, and 90% of columns are randomly selected for corruption. In the MCAR treatment, half of the values in the selected columns are randomly set to missing. In the MAR treatment, a missingness indicator L is randomly drawn from the nonselected columns. If L is continuous, a subset of observations at or below its median value are set to missing in the selected columns; if L is categorical, half of its categories are randomly sampled and a subset of corresponding observations in the selected columns are set to missing. The MNAR treatment is similar to the MAR treatment, with the key difference that L is the selected column itself. These treatments are described in more detail in Online Appendix 3. Since Amelia’s runtime substantially increases when categorical variables have more than 10 classes (which is prohibited in its default settings),
 $native\_country$
,
 $occupation$
, and
 $education$
are excluded from the corruption process.
We include the same five missing-data strategies as the previous test, comparing their imputation accuracy using similar metrics: the RMSE of imputed versus actual values for continuous variables; and classification error for categorical variables. We refrain from conducting a model-based accuracy test because, unlike in Kropko et al.’s simulation, we do not know the true joint distribution of the data. We instantiate MIDAS with two hidden layers of 256 nodes, an input corruption proportion of 0.75, and 20 training epochs, leaving all other hyperparameters at their default settings. Amelia only converges with a ridge prior of 1% of the number of rows in the imputation model, a modification that shrinks covariances between variables and thus introduces some degree of bias (Honaker et al., Reference Honaker, King and Blackwell2011, 19-20). We swap the earlier version of the norm package, which is unable to handle the treated datasets, with an updated version based on the same algorithmic logic (Novo, Reference Novo2015). To enable mi to complete the test in a reasonable time, we modify its settings to complete datasets after either 15 imputation iterations (default = 30) or the default maximum iteration time of 20 minutes—whichever comes first.
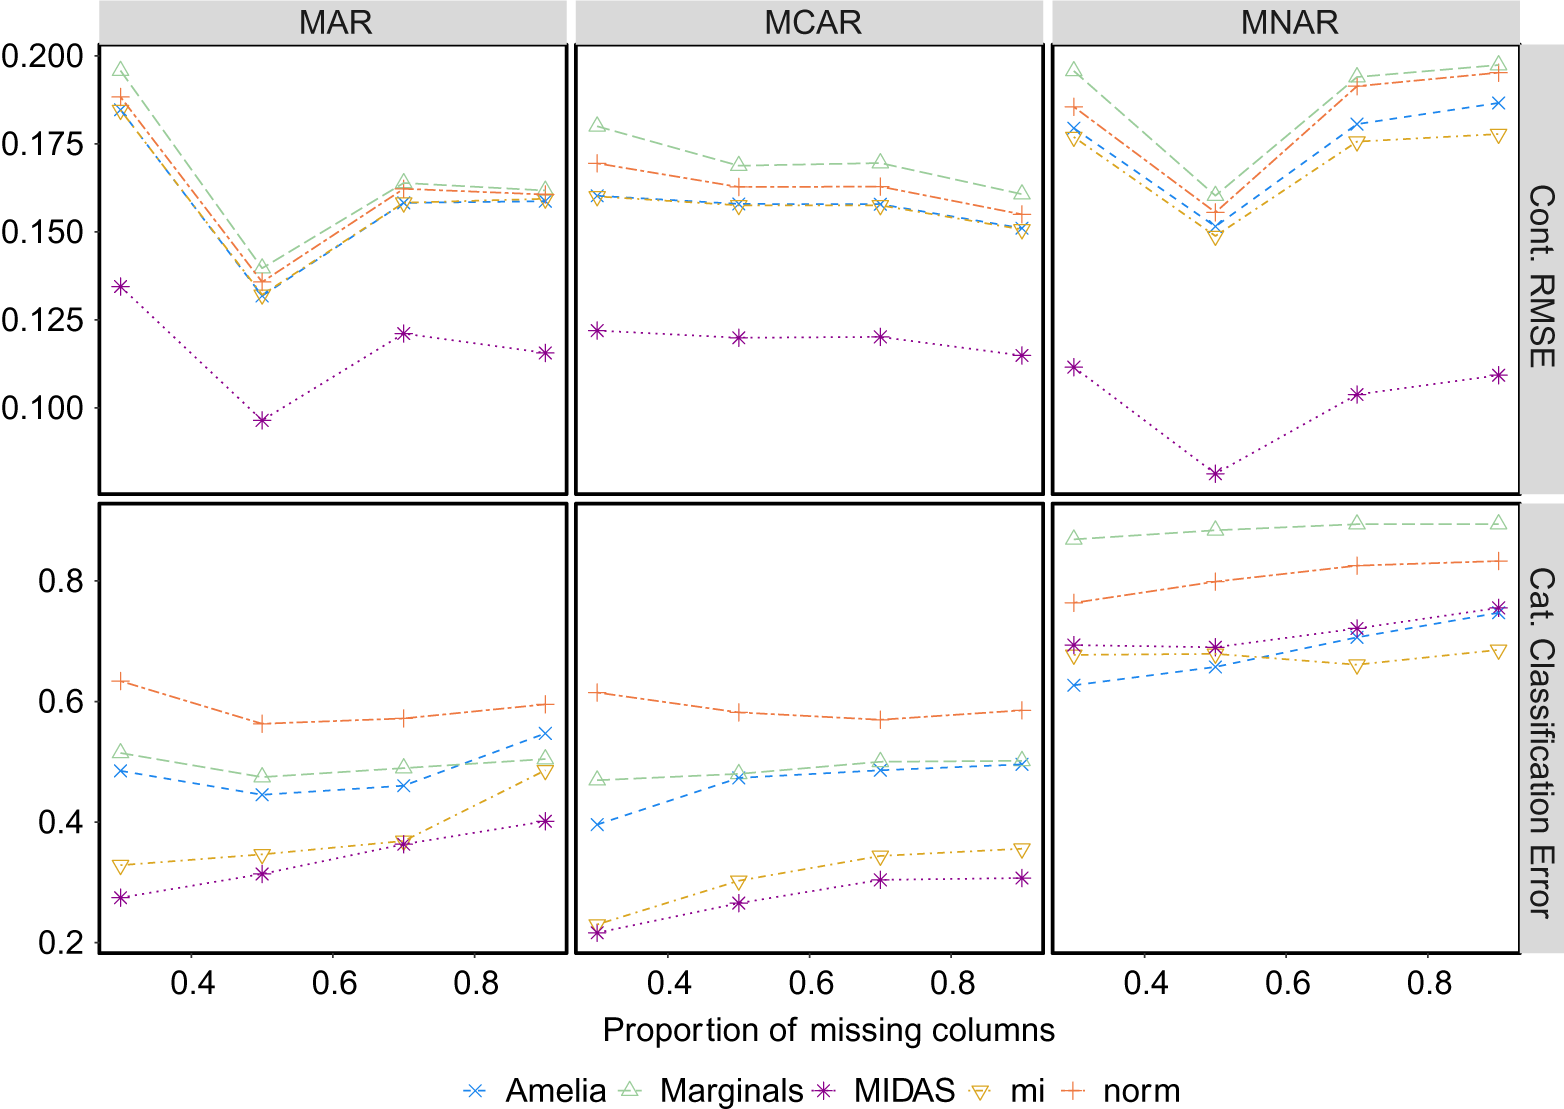
The results are summarized in Figure 5. Across almost all corruption levels and missingness patterns, MIDAS’s imputed values are more accurate than those of other strategies. This advantage is largest for continuous variables: the mean RMSE of MIDAS imputations is around 30% lower than that of the next best algorithm, mi. The gap in classification accuracy is narrower but still clear in the MAR and MCAR scenarios. Under MNAR, Amelia and mi are the best category classifiers, though MIDAS’s performance is comparable. In short, as we move to a more realistic setting in which multivariate normality does not hold, MIDAS continues to exhibit strong relative performance on key metrics of accuracy.
Results of applied imputation accuracy test. MCAR, MAR, and MNAR missingness are separately induced in varying proportions of randomly selected columns in the Adult dataset, with up to 50% of values are set as missing. Lower RMSE and classification error values indicate greater imputation accuracy.

4 Scalability Tests
To facilitate comparison, the previous tests were conducted on small or medium-sized datasets that do not pose (major) computational problems for existing MI algorithms. We now relax this constraint, comparing the algorithms’ efficiency in handling progressively larger datasets. We conduct separate tests for increasing numbers of columns and rows, though place greater weight on the former: additional columns are more computationally demanding for MI algorithms than additional rows because they entail a greater marginal increase in the number and complexity of relationships within the observed data.Footnote 12
4.1 Column-Wise Scalability
Rather than scaling up a purely simulated dataset, which is unlikely to capture the complexity and richness of real data, we conduct both tests using the 2018 Cooperative Congressional Election Study (CCES), a large-scale electoral survey commonly used by political scientists that encompasses a representative sample of 60,000 respondents in the United States. We focus on the subset of personal profile questions asked to all respondents, in addition to a selection of voting- and political activity-related questions (details are provided in Online Appendix 5). To generate a baseline sample for the column-wise test, we remove all columns that are perfectly collinear or that contain at least 10,000 missing values (which generally indicates structural missingness associated with survey flow) and all rows with responses of “don’t know.” This leaves a sample of 30,421 rows and 144 variables. Once categorical variables are one-hot encoded, there are 443 “effective” columns.
To examine the effect of increasing dataset width on imputation speed, we randomly draw columns without replacement from the baseline sample based on a target number of effective columns, which we vary from 25 to 400. If, after selecting a given variable, the number of effective columns is more than 25% higher than the target, this variable is replaced and a new one is selected. After each dataset has been generated, we induce 50% MCAR missingness in every column. To ensure that the data do not become too sparse for imputation, we include the fully observed
 $gender$
and
 $birthyr$
variables in all samples.
We test the same five MI strategies as before, comparing the time they take to complete 10 datasets. MIDAS is instantiated with three 256-node layers, a dropout rate of 0.75, and 30 training epochs—a conservative setup, especially for narrow datasets. Where possible, we parallelize other MI algorithms using the doparallel and foreach packages in R.
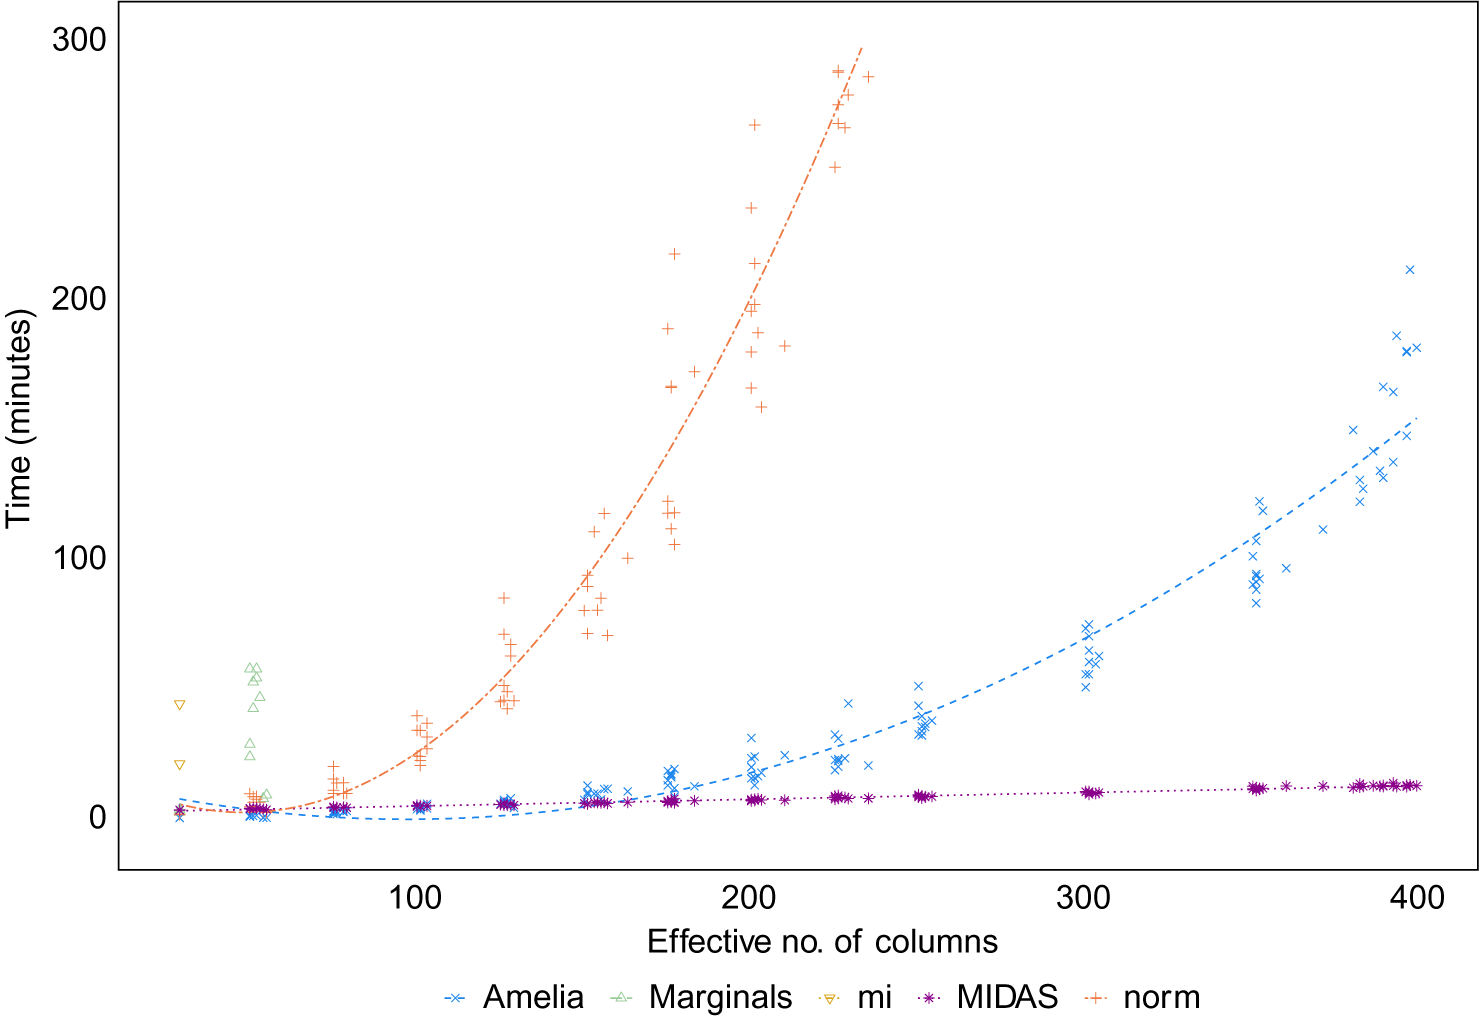
Figure 6 displays the results, including predicted values from a regression of runtime on the effective number of columns (which includes quadratic terms for Amelia and norm due to the distribution of their runtimes). Differences in scalability emerge even at the smallest widths, with the mi package and marginal draws recording runtimes several times longer than the remaining three algorithms for samples with 50 columns.Footnote 13 The latter routines perform similarly up to this width, with Amelia slightly faster than norm and MIDAS but (unlike other algorithms) failing to converge on several occasions. Note again that we do not adjust the MIDAS network’s size by width; a 3-layer, 256-node network is not necessary for narrow datasets, and a leaner architecture would result in faster computation.
Results of column-wise scalability test. The y-axis measures the time taken to produce 10 completed versions of a CCES sample with 50% MCAR missingness; the x-axis measures the number of columns in the sample after categorical variables have been one-hot encoded. Dashed lines show predicted values from a regression of y on x (including quadratic terms for Amelia and norm).

As the number of columns increases, MIDAS’s efficiency emerges clearly. MIDAS becomes faster than norm at a width of around 75 columns and Amelia just before 125 columns. By 200 columns, MIDAS is three times quicker than Amelia and almost 30 times quicker than norm. At the maximum number of columns in the test, 400, MIDAS is 12 times faster than Amelia. Extrapolating from these results, Amelia would take more than 6,000 hours to produce 10 completed versions of the full CCES, approximately 100 times longer than MIDAS. As indicated by the slope of the regression lines, MIDAS’s efficiency advantage increases exponentially with the effective number of columns: the relationship between computation time and data width is linear for MIDAS but quadratic for Amelia and the other algorithms. This constitutes a major advantage in the Big Data era, in which datasets can contain thousands or even tens of thousands of variables.
4.2 Row-Wise Scalability
We test row-wise scalability by extracting a similar baseline sample from the CCES. To ensure a comparable overall runtime to the column-wise test, we focus on personal profile variables that are continuous, binary, or nominal and have fewer than seven levels. In total, the sample contains 22 variables and 34,441 complete rows. We vary sample length by bootstrapping rows to create datasets with between 5,000 and 500,000 rows. We then induce MCAR missingness in 30% of values in each column. As in the column-wise test, we exclude
 $birthyr$
and
 $gender$
from the missingness treatment to prevent excessive sparsity. As the baseline sample is smaller and less complex than before, we shrink the MIDAS network to two layers of 256 nodes and set the number of training epochs as 20.
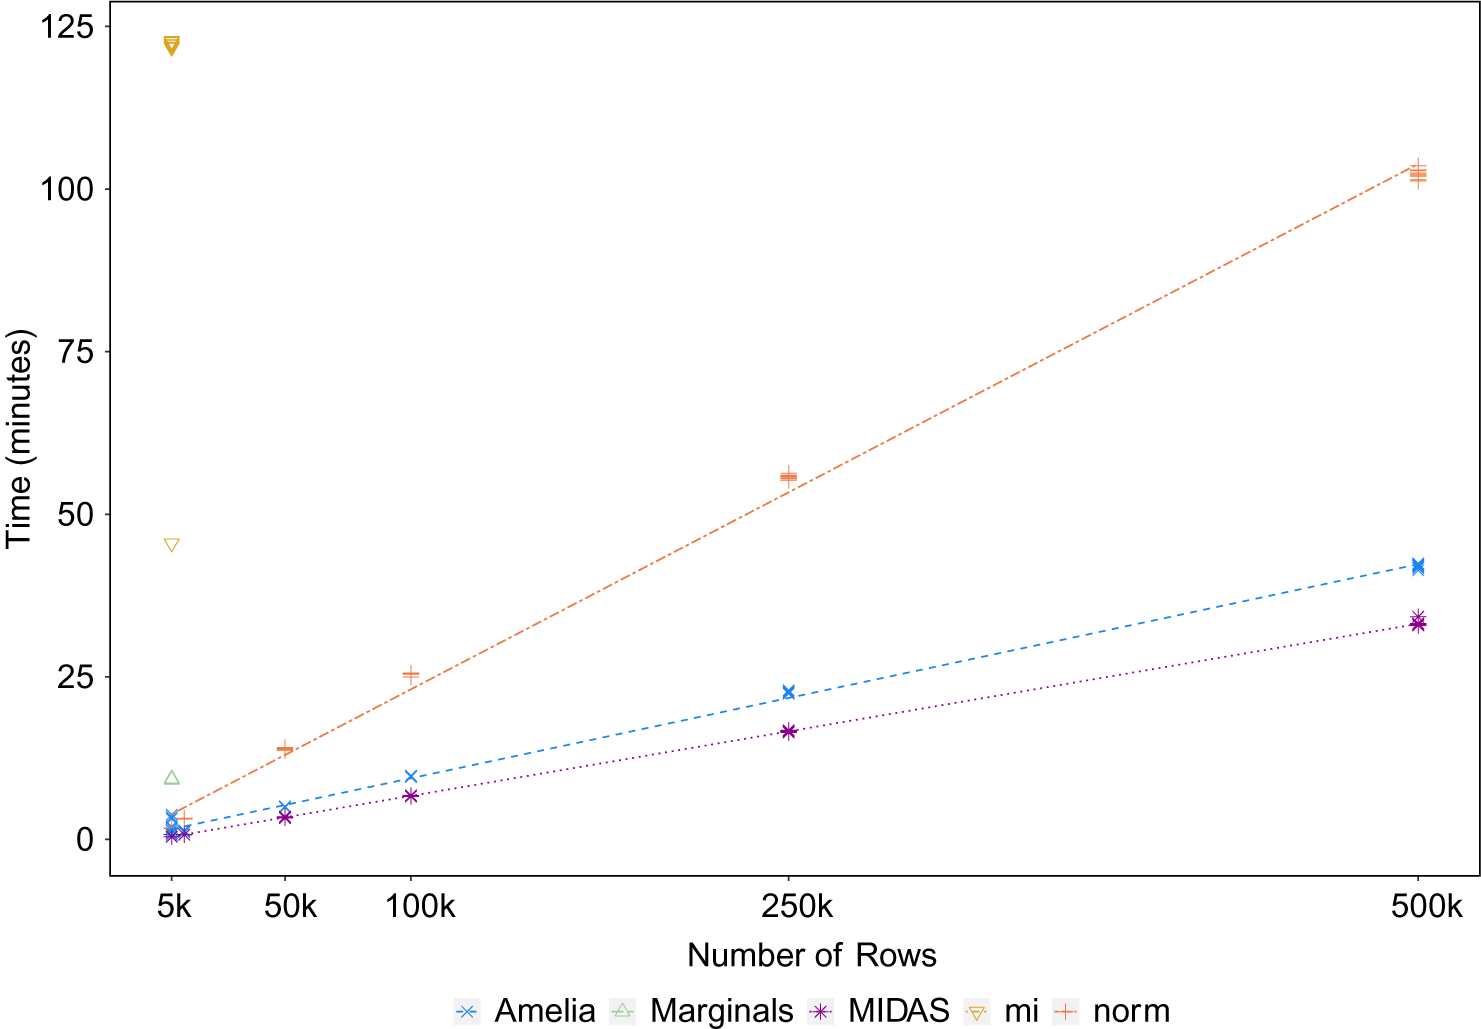
The results are plotted in Figure 7. Across all sample lengths, MIDAS is the most efficient strategy. For datasets with 500,000 rows, MIDAS’s average runtime is three times quicker than than that of norm, the third fastest algorithm, and 25% quicker than that of Amelia, the second fastest, with these gaps increasing in proportion to length. Unlike in the column-wise test, therefore, computation time scales linearly with the number of rows for MIDAS as well as norm and Amelia, a finding consistent with the less intensive computational demands created by additional rows. As before, mi and marginal draws record the longest runtimes, producing the completed datasets in an average of 115 and 9.2 minutes, respectively, at the smallest number of rows (5,000).Footnote 14
Results of row-wise scalability test. The y-axis measures the time taken to produce 10 completed versions of a CCES sample with 30% MCAR missingness; the x-axis measures the number of rows in the sample. Dashed lines show regression-based predicted values for each strategy.

Note that while the performance gap between MIDAS and Amelia is smaller in this test, there are caveats to the latter’s results. Amelia did not converge with any dataset without the inclusion of a bias-inducing ridge prior in the imputation model (of 0.005 times the number of rows), most likely due to high correlations among some variables. Even with this modification, it failed to converge in 16 of the 60 iterations of the simulation.
5 Applied Illustration: Estimating Ideology from CCES Data
In this section, we provide a brief illustration of MIDAS’s capacity to handle real missing-data situations whose scale presents difficulties for existing MI algorithms. We continue to focus on the CCES, whose large number of columns—a feature shared with other electoral surveys—can prevent the usage of such algorithms. Specifically, we use MIDAS to shed new light on the distribution of political ideology among respondents, a topic of substantive interest to scholars of electoral politics in the United States and elsewhere.
Respondents to the CCES are asked to report their ideological position on a seven-point scale ranging from 1 for “Very Liberal” to 7 for “Very Conservative.” Self-reported ideology, however, is known to be a noisy proxy for underlying beliefs (for instance, due to social desirability biases and variation in ideological positions across policy dimensions). A variety of approaches have been proposed to capture respondents’ latent ideology, most of which involve estimating ideology using responses to policy-related questions. In the 2018 CCES, individuals are asked their opinion on a series of policy proposals in areas such as the budget, healthcare, and environmental protection. These items have a higher rate of nonresponse than the CCES in general, with an average of 14% of respondents failing to provide an answer. Does this missingness affect estimates of latent ideology?
Building on recent work by Ramseyer and Rasmussen (Reference Ramseyer and Rasmussen2016), we regress respondent i’s self-reported ideology on responses to 19 policy questions in the CCES (see Online Appendix 6A for the list):
 $$ \begin{align} \text{Self-Reported Ideology}_i = \alpha + \sum^{19}_{j=1}\beta_{j} \times \text{Policy}_{i,j} + \epsilon_i, \end{align} $$
where j denotes a given policy question. The fitted values from Equation (8) represent estimates of latent ideology. We compare such estimates under two missing-data strategies: (1) listwise deletion (following Ramseyer and Rasmussen) and (2) MIDAS, which we implement using a rich battery of 163 demographic and socioeconomic variables—an imputation model too large to be computed by any existing MI algorithm—and a 2-layer, 256-node network trained for 200 epochs.Footnote 15 MIDAS allows us to produce estimates for more than 10,000 more respondents, almost one-fifth of the full CCES.
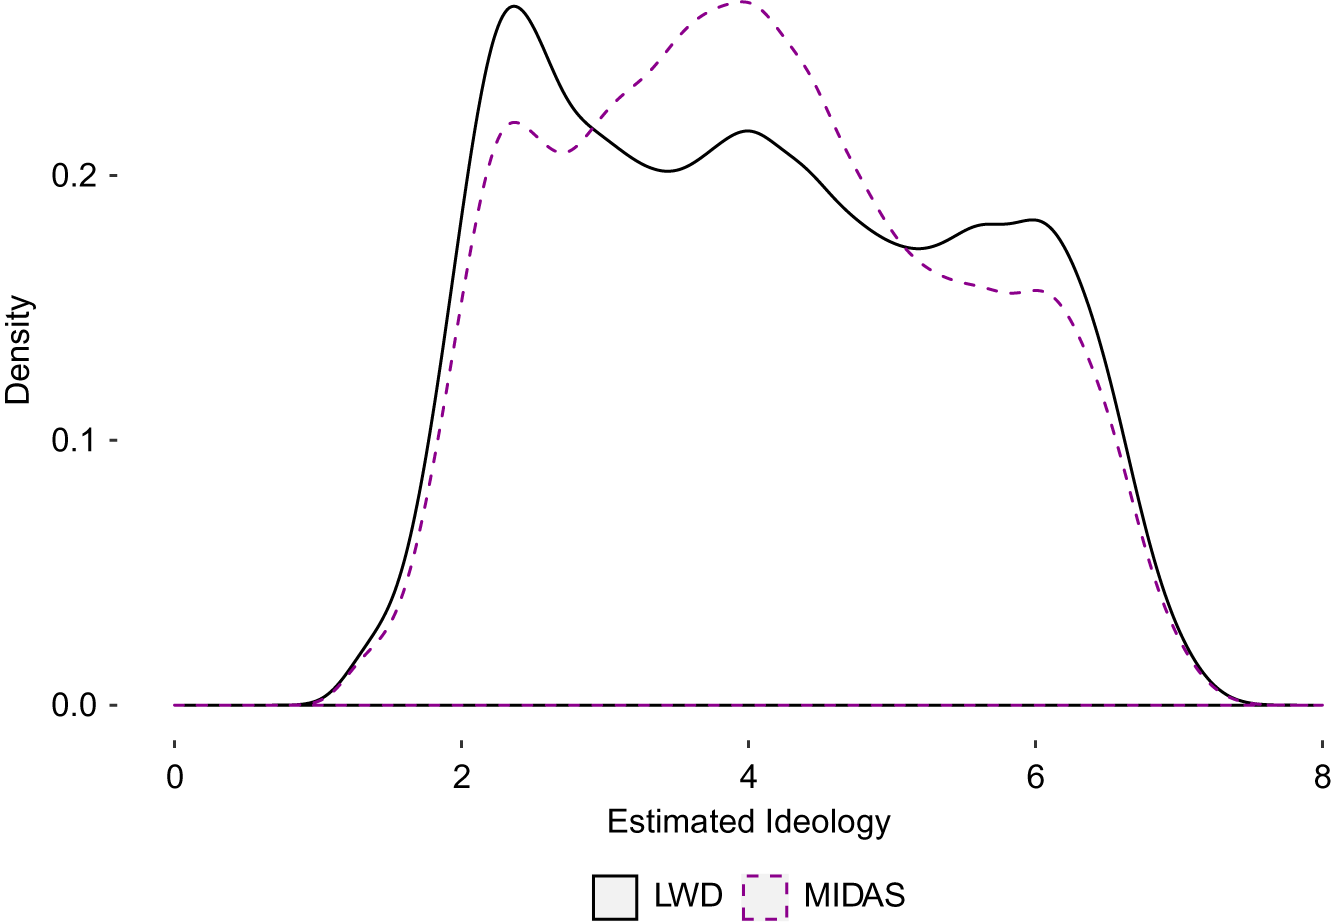
Figure 8 plots the densities of the two sets of latent ideology estimates. The two distributions have similar variances but divergent peaks; the null hypothesis that they are drawn from the same distribution can be rejected under a Kolmogorov–Smirnov test. The distribution of listwise deletion estimates is skewed toward the left (liberal) side of the ideology scale—the modal estimate is 2—though also contains smaller peaks in the center and on the right (conservative) side. The MIDAS estimates, in contrast, follow a more normal shape, peaking at 4. In the absence of MI, therefore, there is a danger that analysts could overestimate the proportion of strong liberal and strong conservative respondents.
Regression-based estimates of CCES respondents’ latent ideology.

This finding also has implications for our understanding of the relationship between ideology and other variables of substantive interest in the CCES, such as respondents’ assessment of President Donald Trump’s performance in office. Table 1 shows the results of regressing responses to the CCES presidential job approval question, which range from 1 for “strongly approve” to 4 for “strongly disapprove,” on (1) self-reported ideology and (2) the MIDAS-based regression estimates of latent ideology.Footnote 16 In both models, the estimated coefficient on the ideology measure is negative and statistically significant, indicating that respondents classified as more liberal express lower average levels of presidential job approval. The MIDAS-based measure, however, is a far better predictor of job approval than the self-reported alternative, possessing a coefficient almost 50% larger (with an identical standard error) and accounting for 20% more model-adjusted variance in the outcome.
Regression of presidential job approval on different measures of ideology.

6 Potential Limitations
While MIDAS’s flexibility render it suitable for a wide range of missing-data problems, there are nevertheless circumstances in which it may perform suboptimally. First, MIDAS cannot, of course, avoid bias when the usual assumptions of MI are violated: data are MNAR, the posited distribution of the data is a poor approximation to reality, or the imputation model is misspecified in some other way. However, as noted earlier—and demonstrated in the applied accuracy test—MIDAS can still perform relatively well under MNAR when there are strong predictors of missingness in the imputation model.
Second, like other approaches to MI, MIDAS is not guaranteed to perform well with certain unconventional data structures, such as nonexchangable data, multilevel data, and spatially lagged data. In general, however, we have found MIDAS to be surprisingly effective at learning observed-data relationships within these structures (without including any special features in the imputation model). Online Appendix 7 provides an illustration of this capacity in the context of time-series cross-sectional data—perhaps the most common form of nonexchangable data in social science research—adapting an exercise conducted by Honaker and King (Reference Honaker and King2010) to show how MIDAS can impute smooth nonlinear time trends in economic variables. This illustration, which involves another dataset too large to be processed by existing MI algorithms, highlights how the flexibility of neural networks can sometimes mitigate the need for manual feature transformation.
Finally, MIDAS inherits the general risks associated with neural network-based methods. These include misspecification of hyperparameters, which can result in bias; overfitting—despite MIDAS’s heavy inbuilt regularization—the likelihood of which increases with the size, dimensionality, and sparsity of the dataset; and poor performance on very small datasets. Such risks can be compounded by the “black box” nature of neural networks, which makes it difficult for analysts to conduct parameter and posterior checks to identify problems. Our software for implementing MIDAS offers two diagnostic tools to help analysts conduct such checks (see Online Appendix 1 for details): (1) the technique of “overimputation” (Honaker et al., Reference Honaker, King and Blackwell2011, 27-29), which involves sequentially removing observed values and checking the accuracy of their imputations and (2) the use of a variational autoencoder component to generate an alternative set of imputations based on more stringent assumptions about the distribution of the latent input space. We acknowledge, however, that these tools do not guarantee detection of all problems.
7 Concluding Remarks
As the scale and complexity of real-world data continue to grow, it is increasingly important that analysts have access to accurate, fast, and scalable methods for analyzing missing values. The approach to MI we have developed in this article, MIDAS, seeks to deliver these advantages by drawing on recent theoretical and computational advances in deep learning. A battery of tests involving real and simulated data suggest that MIDAS can provide gains in accuracy over existing approaches to MI (as well as listwise deletion) even in small- and medium-sized applications, with larger improvements when data possess more complex features. Relative to leading MI algorithms, it can offer improvements in efficiency when datasets contain as few as 200 columns (with the gap increasing exponentially beyond this width) and 5,000 rows (with the gap increasing linearly beyond this length).
To be sure, MIDAS is not a panacea for missing-data problems in the emerging era of Big Data. As discussed earlier, despite its flexibility, the approach is not guaranteed to perform well with every type of data and may be not be straightforward to optimize for particular applications. Nevertheless, we believe that it constitutes a helpful addition to the methodological toolkit of analysts and nicely complements the strengths of existing approaches to MI. Indeed, it is precisely the kinds of applications with which these approaches can struggle where MIDAS comes into its own.
Acknowledgments
For valuable feedback on previous drafts, we are grateful to Matthew Blackwell, Andrew Eggers, Jeff Gill, Kosuke Imai, Gary King, Walter Mattli, Alex Stenlake, and the anonymous reviewers of Political Analysis. We also thank Kin Wai Chan, James Honaker, Musashi Jacobs-Harukawa, Ankur Moitra, and Devrarat Shah for helpful conversations on this research and Jonathan Kropko for generously sharing replication code. Earlier versions of this article were presented at the Quantitative Social Science Colloquium at Princeton University and the Artificial Intelligence and Machine Learning Society at the University of Queensland. The software accompanying this article was developed by Ranjit Lall, Thomas Robinson, and Alex Stenlake.
Data Availability Statement
Replication materials for this article are available in Lall and Robinson (Reference Lall and Robinson2020).
Supplementary Material
To view supplementary material for this article, please visit https://doi.org/10.1017/pan.2020.49.