For more than two centuries, African Americans faced extraordinary levels of discrimination compared with whites. Each of the seven children born into a typical African American household in 1860 could expect to acquire less than a single year of formal schooling, compared with 4.5 years for each of the five children born into a typical white household. By the year 2000, black fertility had declined to 2.2 and formal schooling had risen to 14.3 years, not much different than the figures of 2.0 and 14.9 for whites.
Our paper presents newly compiled data on state black fertility, 1820–2000, and white fertility, 1800–2000. This data was produced using US Census surveys for children ever born covering years 1890–1990. For 2000, we used the 1998, 2000, 2002, and 2004 CPS Supplements surveys of children ever born. For years prior to 1890, we used the age structure of the population, and estimates of infant and young child mortality to produce new estimates of fertility by race and state. For schooling, we followed our procedure in Murphy, Simon and Tamura (Reference Murphy, Simon and Tamura2008) to construct expected years of schooling for cohorts by state and by race. See below for more details, as well as the appendix.
This paper documents and attempts to place a value on the improvement in black schooling and mortality between 1820 and 2000 by parameterizing a dynamic, dynastic model of fertility choice with both quantity and quality dimensions (Becker, Murphy and Tamura Reference Tamura1990; Murphy, Simon and Tamura Reference Murphy, Simon and Tamura2008). In this model, parents choose gross fertility and the level of human capital with which to invest each child, conditional on the probability of the child surviving to adulthood, schooling cost, and the productivity of human capital investment.Footnote 1
A parameterized, dynamic, dynastic fertility model is a promising framework for valuing the gradual lifting of discriminatory barriers against blacks. For example, discriminatory access to health care would increase child mortality and thus increase the precautionary demand for children (Kalemli-Ozcan Reference Kalemli-Ozcan2002, Reference Kalemli-Ozcan2003; Tamura Reference Tamura2006). Prior to 1870, one out every two black child ever born did not survive to young adulthood, compared with one in three among whites. After 1960, 95 black children and 98 white children in 100 survive. Because fertility is costly, this reduces the resources available for schooling the next generation.
One manifestation of racial discrimination against blacks was unequal access to schooling (Margo Reference Margo1990; Canaday and Tamura Reference Canaday and Tamura2009, Carruthers and Wanamaker (Reference Carruthers and Wanamaker2015)). In this model, human capital accumulates from one generation to the next, and is used, along with parental time, to produce the next generation’s human capital. The effects of such discrimination are therefore manifested in two ways. First, because human capital is transmitted from one generation to the next, discriminatory access to schooling in one generation means that the next generation must start with a lower level of human capital than otherwise. Second, because parents’ human capital is used to produce the next generation’s human capital, dynasties with lower parental human capital are less efficient in producing child human capital.
We parameterize the fertility model by fitting decadal US time series on fertility, mortality, and schooling for blacks and whites, by state, for the time period 1800–2000. Our parameterization eschews the use of data on income, which are not available until 1940, for two reasons. First, much of our interest lies in the earlier years. Second, the fact that inequality is transmitted from one generation to the next complicates measurements of discrimination based on current labor market earnings. Part of the value of human capital lies in its productivity in producing and educating one’s children.
The quantity–quality fertility model permits us, in absence of data on income, to calculate the reduction of black welfare due to higher mortality and schooling cost, in units of human capital. Because wealth is proportional to human capital, the ratio of white to black human capital is a natural metric for welfare. It is therefore possible to calculate the proportionate increase in wealth that would have been required to compensate blacks for the higher mortality and schooling costs they faced, compared with whites. To foreshadow our findings, the estimates indicate that prior to 1960, black wealth would have had to increase by between 60% and 500%.
We do not intend our measurements to fully capture the burden of racial discrimination, which impacted a greater range of economic activity than schooling alone, and which included social costs above purely economic costs. That being said, we think that our paper represents a step forward in measuring the costs of discrimination by explicitly considering its implications for a largely non-market, yet fundamental activity, namely that of raising and schooling one’s children.
The remainder of the paper is organized as follows. Section 1 presents our data. Section 2 outlines our theoretical model. The numerical solutions to the model are presented in Section 3. Section 4 presents a robustness check on the parameterization. Section 5 examines the plausibility of our estimates of human capital. Section 6 concludes with a brief summary and an outline of future paths of research.
1. DATA
In this section, we present new data on the price of space, fertility, schooling, and mortality risk, by race.
1.1. Price of Living Space
We use a variant of the model from Tamura and Simon (Reference Turner, Tamura and Mulholland2015), and Murphy, Simon and Tamura (Reference Murphy, Simon and Tamura2008) to calibrate for white and black fertility in each state. In those papers, the forcing variable that induces the Baby Boom is a reduction in the price of space.Footnote 2 For this paper, we computed race specific, state specific “price” of space measures, taken to be equal to population density. For each state, race, and year we compute the state population density. We compute the population density of each county, and then weight each county by the county’s share of the white or black state population. Consider state i, with J > 1 counties. Let sizeijt represent the number of square miles county j in state i in year t has. Then, the population density of state i for race R = black (b), white (w) is given as
 $$\begin{equation}
r_{\it iRt} = \sum \limits _{j=1}^J \frac{\it pop_{ijt}}{\it size_{ijt}} \frac{\it pop_{ijt}^R}{\it pop_{it}^R}.
\end{equation}$$
Thus for each year, each state, for blacks (whites), we have the number of people per square mile for a randomly chosen black (white) in the state. It is quite possible that population density can decline even when the state population rises. This occurs when the population share of the lower density counties rises sufficiently, more than offsetting the rise in population density of any or even all counties. Additionally, the US population density can decline even though the US population has never declined, as population within a state becomes less dense as above, or if population shares of less densely populated states (typically the south and west) rise. These are graphed in Figure 1, nationally and by division. Nationally, white population density rises from 1800 until 1920 and then declines for the remainder of the years. From 1800 to 1940 whites lived in more densely populated areas than blacks. For the period which covers the Baby Boom years, 1950–1970, and the Baby Bust years, 1980–2000, blacks have a higher population density than whites. For blacks, generally their price of space rises from 1820 to 1970. Indeed the onset of the black Baby Boom appears to be totally driven by the dramatic decline in the cost of schooling, as will be detailed below. Only in the last 30 years has population density for blacks declined.
Black and white price of space, r b, wt in 1000s per square mile.

1.2. Fertility
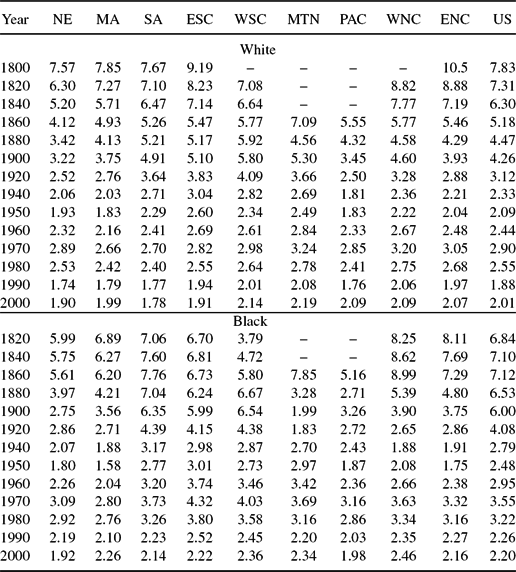
Our fertility data for years 1890–2000 are derived from information on children ever born to ever married women aged 35–44 years, collected from decennial Censuses. We used the procedures used in Murphy, Simon and Tamura (Reference Murphy, Simon and Tamura2008) to produce estimates of black and white fertility for years prior to 1890.Footnote 3Figures 2 and 3 graph white and black fertility for the US as a whole between 1800 and 2000 and by census division. White fertility in 1800 was 7.8, and declined to 7.4 in 1820, 6.3 in 1840, and 5.3 in 1850. Black fertility averaged 6.8 in 1820 (the start of the series), rose to 7.7 in 1830, and fell to 7.1 in 1840. Generally, fertility among blacks and whites declined steadily until 1950, to 2.1 for whites and 2.5 for blacks, rose during the baby boom until 1970, and resumed their decline until the end of the data period in 2000. The fertility of blacks exceeded that of whites thereafter, but had converged to within 0.19 by 2000. The black–white fertility differential is largest in 1850, more than 2.5 children ever born (7.9–5.3). By 1950, the gap had shrunk to just 0.4, (2.48–2.09).Footnote 4 The information is contained in Table 1.
Cohort black and white fertility.
Cohort black and white fertility.
Children ever born: By census division and race
Table reports our estimates of children ever born from 1800–1880 for whites and 1820–1880 for blacks using the procedure of Murphy, Simon and Tamura (Reference Murphy, Simon and Tamura2008). For 1890–1990, we report the values of children ever born to women 35–44 from various censuses. The 2000 value comes from the averaged children ever born to women 35–44 for 1998, 2000, 2002, 2004 CPS.
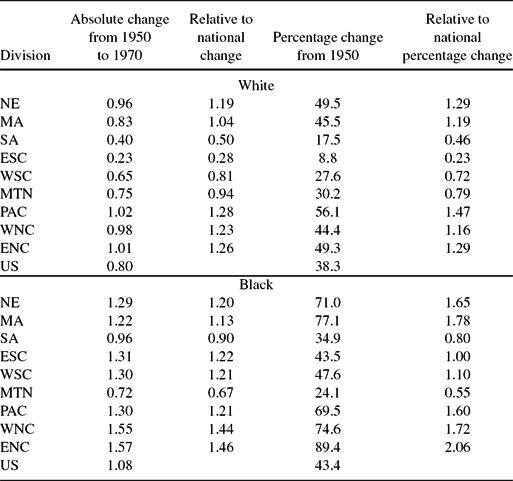
Table 2 contains information on the size of the Baby Boom by race and by census division. We compare the magnitude to the national Baby Boom both in absolute change and in proportionate change. The 1950 cohort of 35–44 women have the lowest fertility prior to 2000, therefore we benchmark our change in fertility between the 1950 cohort and the 1970 cohort. As we found in our previous work, Murphy, Simon and Tamura (Reference Murphy, Simon and Tamura2008), the Baby Boom for white women was larger in the northern divisions compared with the southern divisions. However, the Baby Boom for black women was generally large everywhere, with the exception of the Mountain division.Footnote 5
Changes in children ever born: By census division and race
Table reports both absolute, proportionate, and relative change in fertility during the Baby Boom, by race. In each relative case, we report the changes in comparison to the national change by race.
Alternative theories of the Baby Boom abound. Easterlin (Reference Easterlin1961, Reference Easterlin1966) provided a model of preference formation that caused Depression children to have low expectations of adult consumption. When the Depression ended and the Post World War II Boom occurred, they consumed some of the unexpected wealth in the form of larger families. These boomer children, accustomed to 1950s and early 1960s abundance, expected high levels of adult consumption. When they became adults in the productivity slow down they reduced their fertility to deal with the unexpected slower growth. Greenwood, Seshadri and Vandenbroucke (Reference Greenwood, Seshadri and Vandenbroucke2005) argue that labor saving appliances in the household increased the demand for children, but this increased productivity was not continuous, but rather a one time shock to the level of household technology. However, see Bailey and Collins (Reference Bailey and Collins2011) on the effects of electrification and fertility for some contrary evidence. Doepke, Hazan, Maoz (2015) argue that differential rates of female mobilization during World War II sowed the seeds of the post war Baby Boom. Albanesi (Reference Albanesi2013) and Albanesi and Olivetti (Reference Albanesi and Olivetti2014) provide evidence on the effect of declining maternal mortality risk and possible baby boom responses. Jones and Schoonbroodt (Reference Jones and Schoonbroodt2010) relax some assumptions of the Barro–Becker altruism utility function in order to provide the possibility of baby booms. However, the results in this paper do not hinge on this particular interpretation; all that is required is a decline in the price of some good that is complementary with fertility.
1.3. Schooling
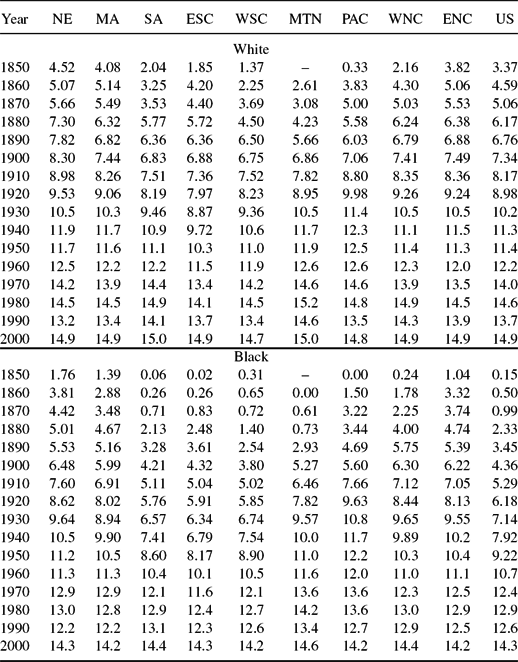
Estimates of schooling by race and state, obtained by extending the procedures of Turner, Tamura, Mulholland and Baier (Reference Turner, Tamura, Mulholland and Baier2007) and our previous paper (2008) are seen in Table 3 and in Figures 4 and 5, by cohort.Footnote 6 Starting in 1839, blacks obtained an average of just 0.15 years of schooling, compared with 3.4 years among whites, a figure not achieved by blacks until the 1879 cohort. By 2000, both blacks and whites are predicted to have between 14 and 15 years of schooling.
Cohort black and white schooling.
Cohort black and white schooling.
Cohort average years of schooling: By census division and race
Table reports our estimates of years of schooling by cohort from 1850–2000 for whites and blacks using the procedure of Murphy, Simon and Tamura (Reference Murphy, Simon and Tamura2008).
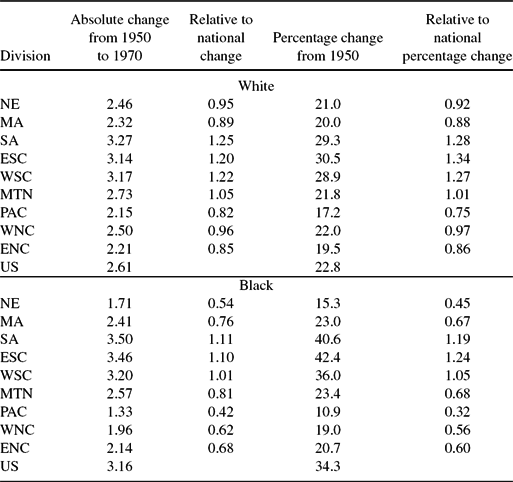
Table 4 contains a breakdown of the change in years of schooling over the Baby Boom. For whites, the increase in schooling of the 1970 Baby Boom, 1959 birth year, compared with the 1950 Baby Bust, 1939 birth year, is 2.6 years. This was almost a 25% increase in years of schooling across cohorts. The largest increase in white years of schooling occurred in the four small Baby Boom divisions. This is true whether we compare the absolute changes in schooling with the national change, or if we compare percentage increase in schooling with the national percentage increase in schooling.
Changes in average years of schooling: By census division and race
Table reports both absolute, proportionate, and relative change in schooling during the Baby Boom, by race. In each relative case, we report the changes in comparison to the national change by race.
For blacks, national schooling rose over the baby boom by 3.2 years, or more than 33%. The largest increase in schooling years occurred in the three southern divisions, South Atlantic, East South Central, and West South Central. Again this is true whether measure comparing absolute years of schooling increases with the national increase in schooling, or comparing percentage increase in schooling with the national percentage increase in schooling. As with whites, the divisions with larger baby booms were also those with smaller increases in schooling years.
Although the Baby Boom is not the primary focus of the current paper, it is worth pointing out that for every division the white Baby Boom 1970 cohort enjoys a higher level of schooling than any prior white cohort. An identical pattern holds for blacks. That the rise in fertility during the Baby Boom for both races was not accompanied by a decline in schooling is a challenge for any model of fertility that incorporates a quantity–quality tradeoff (Becker and Lewis Reference Becker and Lewis1973; Becker, Murphy and Tamura Reference Becker, Murphy and Tamura1990). We will accomplish this feat in our model via the schooling efficiency parameter.Footnote 7
1.4. Mortality
Our data on mortality are collected from life tables of so-called “death registration states,” available for selected states starting in 1890 and becoming available for almost all states by 1920. For years not covered in the life tables, we combined information on (potentially error-ridden) reported deaths in the decennial Censuses with our own back-forecasts of state-specific mortality, described in the Appendix. The resulting data series begin in 1800 for whites and in 1820 for blacks.
The mortality data are graphed in Figures 6–9; infant mortality are graphed in Figures 6 and 7. Probabilitiy of dying before age 15 years, are graphed in Figures 8 and 9.Footnote 8 Dramatic declines in mortality across all divisions are evident, as is a convergence in mortality across Census divisions. The higher mortality observed among northerners reflects the impact of urbanization, with its accompanying problems of waste disposal, lack of sewer and water treatment, and generally high density and sanitation problems documented by McNeill (Reference McNeil1977), Melosi (Reference Melosi1999), and Troesken (Reference Troesken2004).
Cohort black and white infant mortality.
Cohort black and white infant mortality.
Cohort black and white mortality before 15.
Cohort black and white mortality before 15.
2. MODEL
Our model is designed to match time series on fertility and years of schooling over time and across states, for blacks and whites. Although we wish to explain differences in schooling outcomes for blacks and whites, our focus on just these two variables leads us to adopt a framework that abstracts from institutional detail. In our model, parents choose their consumption, the amount of space for each child, the number of children born and child quality, given the constraints imposed by their initial human capital stock, the probability of child survival, the price of living space, and most importantly for our purposes, the efficiency of resources – here, time – devoted to schooling.
2.1. Preferences
A parent of race R belonging to cohort t and living in state i chooses consumption ciRt, gross fertility xiRt, living space (per child) SiRt, and human capital investment (also per child) h iRt + 1 in order to maximize:
 $$\begin{eqnarray}
&&\alpha \left( c_{iRt}^{\psi }S_{iRt}^{1-\psi }\right) ^{\varphi }\left[ (1-\delta _{iRt})x_{iRt}-a\right] ^{1-\varphi }\nonumber\\
&&\quad+\,\Lambda h_{iRt+1}^{\varphi } \left(1 -\frac{ \beta _{iRt} \delta _{iRt}^{\nu _{iRt}}}{\left[ (1-\delta _{iRt})x_{iRt}-a\right] (1-\delta _{iRt})} \right),
\end{eqnarray}$$
where δiRt is young adult mortality, and in order to place a lower bound on fertility, a ⩾ 0.Footnote 9 Ideally, we would assume that all individuals have identical preferences, regardless of race or state of residence. Originally, we had identical preferences by race and census cohort. Thus, blacks and whites may have different preference parameters (βRt, νRt), where R refers to race, and t to census cohort. In this specification, we were able to fit the national time series of black and white fertility separately. However, the years of schooling fit by race were not that good, and when we examined the census divisions separately, as well as each state separately, the schooling fit was poor. Since the focus of the paper is to measure the welfare cost of unequal schooling access, we felt it more important to fit schooling as well as fertility, compared with maintaining identical preferences by race and cohort. Although we were unable to produce sufficiently accurate predictions imposing identical parameters, the only heterogeneity in preferences that we allow are in (βiRt, νiRt), which relate to the precautionary demand for children. Because precautionary demand vanishes as mortality approaches to zero, blacks and whites therefore have identical preferences in the limit. Thus, preference parameters (α, ψ, φ, a, Λ) are identical across race, state, or birth cohort. Two of these parameters (a, Λ) are fixed by the other taste parameters, technological parameters and stationary solution values of schooling and fertility. These are presented below in subsection 2.5 Model solution. After we present the rest of the model, human capital accumulation technology, the parental budget constraint, we describe how the (βiRt, νiRt) are chosen to fit the data in Section 3.
The fertility and human capital investment decision is similar to the one in Jones (Reference Jones2001), in which declining mortality induces a demographic transition. However, in contrast to Jones (Reference Jones2001), in which the decline in mortality arises due to rising consumption, we take the decline in mortality as parametric. Allowing for endogenous mortality, as in (Tamura Reference Tamura2006), complicates the fitting exercise considerably. Below, we will calculate the value that blacks would have received had they enjoyed access to the same schooling technology as whites, holding constant mortality. Allowing mortality to be a function of schooling would therefore likely increase this value.
Higher human capital investment (h iRt + 1) raises parental utility directly, but is assumed (as seems intuitive) to increase the disutility of child mortality. The precautionary demand for children is similar to that in Kalemli-Ozcan (Reference Kalemli-Ozcan2002, Reference Kalemli-Ozcan2003) and Tamura (Reference Tamura2006). Higher mortality δiRt reduces utility both directly, in the final term, and indirectly by reducing net fertility below gross fertility xiRt. Declining mortality reduces gross fertility, and in the limit the final term disappears as mortality approaches zero.
2.2. Technology of Human Capital Accumulation
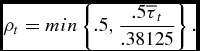
The law of motion for human capital is given by
 $$\begin{eqnarray}
h_{iRt+1}=A\overline{h}_{t}^{\rho _{t}} h_{iRt}^{1-\rho _{t} } \tau _{iRt}^{\mu }
\end{eqnarray}$$
 $$\begin{eqnarray}
\rho _{t}=min \left\lbrace .5, \frac{.5 \overline{\tau }_{t}}{.38125} \right\rbrace .
\end{eqnarray}$$
Parents choose the amount of time to devote to educating their child, τt, which we identify with years of schooling. The productivity of this time is positively related to (a) the (unobserved) existing stock of their human capital, hiRt and (b) the (also unobserved) frontier level of human capital in the economy,  $\overline{h}_{t}$. The term
 $\overline{h}_{t}$ introduces a human capital spillover whose strength is governed by ρt and permits us to generate the convergence of human capital levels seen in the data. Parents are assumed to have perfect foresight regarding the effect of
 $\overline{\tau }_t$ on ρt but ignores the effect of their choice of τt on
 $\overline{\tau }_t$, ρ, and
 $\overline{h}_{t}$.Footnote 10
The parametric form for ρt in equation (4) is similar to Tamura (Reference Tamura2006). We assign each period a calendar duration of 40 years, so 40τt is equal to the average number of years of schooling we observe for a representative member of birth cohort t. To see how this works, suppose that we observe identical years of schooling equal to 12 years in two states that start out with different initial (unobserved) human capital stocks hit. This implies 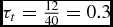 $\tau _t=\frac{12}{40}=0.3$, ρt=0.3934, and 1–ρt=0.6066. The ratio of human capital in the two states after 1 period is therefore equal to
 $$\begin{equation}
\frac{h_{it+1}}{h_{jt+1}} = \left(\frac{h_{it}}{h_{jt}}\right)^{0.6066}.
\end{equation}$$
Because income is proportional to human capital, this implies a rate of income convergence of 1 − 0.60660.025 = 1.24% per year. At 15.25 years of schooling, τt = 0.38125, ρ = 0.5, and convergence is 1.7% per year. Finally, at eight years of schooling, τt = 0.2, ρt = 0.2623, and convergence is only 0.76% per year. A maximum value of ρt of 0.5 seems consistent with the rate of income convergence of 1–2% per year observed in the data.Footnote 11
2.3. The Parental Budget Constraint
The parent’s budget constraint requires that total consumption be equal to income. The budget constraint is given by
 $$\begin{equation}
pc_{iRt}+r_{iRt}x_{iRt}S_{iRt}=h_{iRt}\left[ 1-x_{iRt}\left( \theta +\kappa _{it}^R \tau _{iRt}\right) \right],
\end{equation}$$
where p is the price of consumption, child rearing takes a fixed proportion of time per child, θ, and riRt is the unit price of living space (per child) SiRt, included to capture the Baby Boom.Footnote 12 Parents divide their time between the labor market and raising children.
2.4. The Key Parameter: Schooling Efficiency
Unequal access to schooling was arguably the most important manifestation of racial discrimination against blacks in the US after the end of slavery, (Margo Reference Margo1990; Canaday and Tamura Reference Canaday and Tamura2009).Footnote 13 We assume that unequal access to schooling is manifested in the model via the parameter κt, which governs the (in)efficiency of schooling time. Because the total time cost of educating one’s children is κtτt, higher values of κt require greater diversion of time away from the labor market to produce a given level of human capital investment in one’s children.
Our method of parameterizing discrimination is convenient, and we have used it in other work.Footnote 14
2.5. Model Solution
Ignoring state i and race R subscripts for simplicity, substitute equations (3) and (6) into equation (2) and differentiate to produce the three Euler conditions governing fertility xt, human capital investment h t + 1, and living space St:Footnote 15
 $$\begin{eqnarray}
\frac{\partial }{\partial \tau } &:& \frac{\psi \alpha c_{t}^{\psi \varphi -1}S_{t}^{(1-\psi )\varphi }\left[ \left( 1-\delta _{t}\right) x_{t}-a\right] ^{1-\varphi }}{p}\nonumber\\
&=&\frac{\Lambda \mu A^{\varphi }(\overline{h}_{t}^{\rho }h_{t}^{1-\rho })^{\varphi }\tau _{t}^{\mu \varphi -1}(1 -\frac{ \beta _t \delta _{t}^{\nu _{t}}}{\left[ (1-\delta _{t})x_{t}-a\right] (1-\delta _{t})} )}{h_{t}x_{t}\kappa _{t}}
\end{eqnarray}$$
 $$\begin{eqnarray}
\frac{\partial }{\partial x} &:&\psi \varphi \alpha c_{t}^{\psi \varphi -1}S_{t}^{(1-\psi )\varphi }\left[ \left( 1-\delta _{t}\right) x_{t}-a\right] ^{1-\varphi }\frac{h_{t}\left[ \theta +\kappa _{t}\tau _{t}\right] +r_{t}S_{t}}{p} \nonumber \\
&=&\left( 1-\varphi \right) \alpha c_{t}^{\psi \varphi }S_{t}^{(1-\psi )\varphi }\left[ \left( 1-\delta _{t}\right) x_{t}-a\right] ^{-\varphi }\left( 1-\delta _{t}\right) +\Lambda h_{t+1}^{\varphi } \frac{\beta \delta _{t}^{\nu _{t}}}{ [ (1-\delta )x_{t}-a]^{2}} \nonumber\\
\end{eqnarray}$$
 $$\begin{eqnarray}
\frac{\partial }{\partial S} &:&\psi \varphi \alpha c_{t}^{\psi \varphi -1}S_{t}^{(1-\psi )\varphi }\left[ \left( 1-\delta _{t}\right) x_{t}-a\right] ^{1-\varphi }\frac{r_{t}x_{t}}{p} \nonumber \\
&=&\alpha \left( 1-\psi \right) \varphi c_{t}^{\psi \varphi }S_{t}^{(1-\psi )\varphi -1}\left[ \left( 1-\delta _{t}\right) x_{t}-a\right] ^{1-\varphi }.
\end{eqnarray}$$
Using (9) to solve for ct as a function of St and xt yields
 $$\begin{equation}
c_{t}=\left( \frac{\psi }{1-\psi }\right) \frac{r_{t}x_{t}S_{t}}{p}.
\end{equation}$$
Substituting for ct in the budget constraint produces
 $$\begin{equation}
r_{t}x_{t}S_{t}=\left( 1-\psi \right) h_{t}\left[ 1-x_{t}\left( \theta +\kappa _{t}\tau _{t}\right) \right].
\end{equation}$$
Substituting the budget constraint into the utility function gives the new maximand:
 $$\begin{equation}
v \left( h_t | \kappa _t , r_t \right) = \max _{x_{t},\tau _{t}}\left\lbrace \begin{array}{l}\alpha \left( \frac{\psi }{p}\right) ^{\psi \varphi }\left( \frac{1-\psi }{r_{t}x_{t}}\right) ^{\left( 1-\psi \right) \varphi }\left( h_{t}\left[ 1-x_{t}\left( \theta +\kappa _{t}\tau _{t}\right) \right] \right) ^{\varphi }\\ \qquad\times\left[ \left( 1-\delta _{t}\right) x_{t}-a\right] ^{1-\varphi } \\
\quad+\Lambda \left( A \overline{h}_t^{\rho _t} h_t^{1-\rho _t} \tau _t^{\mu } \right)^{\varphi }(1-\frac{ \beta _t \delta _{t}^{\nu _{t}}}{(1-\delta _{t})\left[ (1-\delta _{t})x_{t}-a \right]}) \end{array} \right\rbrace .
\end{equation}$$
Because fertility xt interacts with St and h t + 1, the budget constraint (6) is not convex and thus (12) need not be globally concave. It is therefore not feasible to derive analytically tractable comparative statics.Footnote 16 However, conditional on fertility, the problem is concave in the remaining choice variables. We therefore solve the model in the same way as in Tamura (Reference Tamura2006), and Tamura and Simon (Reference Tamura and Simon2015), by constructing a grid of fertility values that range from  $\frac{a}{1-\delta _t}$ to the biological maximum of
 $\frac{1}{\theta }$, solving for the remaining choice variable τt(xt), and choosing the level of fertility that yields the highest level of utility.Footnote 17
However, before going to the numerical solutions, there are a pair of parameter restrictions that we impose on preferences, (a, Λ). In other words, we impose these restrictions in order to calibrate from the balanced growth path with zero mortality, constant price of consumption, p, constant rental price of space, r, and a fixed population. Thus, fertility is equal to one, x = 1, and a constant schooling time,  $\overline{\tau }$. Under these assumptions, (a, Λ) must satisfy
 $$\begin{eqnarray}
a= 1 - \frac{(1-\varphi )(1-\theta -\overline{\tau })}{\varphi [1-\psi (1-\theta -\overline{\tau })]}
\end{eqnarray}$$
 $$\begin{eqnarray}
\Lambda =\frac{\alpha \psi ^{\psi \varphi } (1-\psi )^{(1-\psi )\varphi } (1-a)^{1-\varphi } \overline{\tau }^{1-\mu \varphi }}{\mu (A p^{\psi } r^{1-\psi })^{\varphi } (1-\theta -\overline{\tau })^{1-\varphi }}.
\end{eqnarray}$$
3. NUMERICAL SOLUTIONS
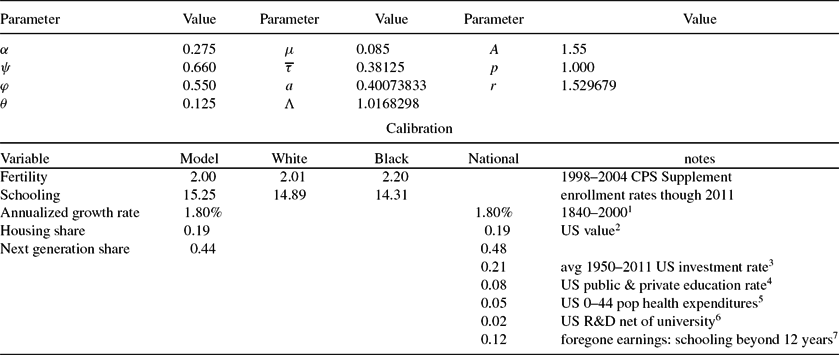
Table 5 contains the common calibrated parameters in the model. Most of the choices are standard. For example, the time cost of rearing a child, θ = 0.125 implies a biological maximum fertility of 8 in an asexual model, or 16 in a model with males and females. With a period of 40 years, it also implies that a child is 5 years old when he or she enters school. Our choice of  $\overline{\tau }=0.38125$ implies a steady state value of 15.125 years of schooling.Footnote 18 Finally, our choice of price of space per child is a bit more difficult. Our chosen value is the average value of white population density of US states in 2000, where we weight the states by their white population.
Parameter values & calibration
Parameter values that are constant throughout the solution. The value of a and Λ are determined by the other parameters and are given by (13) and (14), respectively. We assume that consumption is the numeraire. The value of r is the average white state density for 2000, where we weighted by the 2000 white population. 1For the model, we assumed that the growth rate is computed as  $\ln (A \overline{\tau }^{\mu })/20$. Annualized growth of real output per worker from 1840–2000, Turner, Tamura and Mulholland (2010). 2OECD Better Life Index. 3Penn World Tables. 4Digest of Education Statistics 5Lassman, et al. 6Figure comes from WDI less R&D expenditures by universities, the latter figure from Chronicle of Higher Education Almanac issue 2013–14. 7Authors’ calculations using a 4.5% discount rate, $31,700 median full time male worker earnings of high school graduates (25–34 years old), and $41,700 median full-time male worker earnings of workers with an Associate Degree (25–34 years old).
Our choice for (A, μ) is consistent with a annualized balanced growth path growth rate of 1.80%.Footnote 19 Our choice of parameters (θ, ψ) together with our calibrated long run values of fertility and schooling,  $x=1, \overline{\tau }=0.38125$, and our assumed stationary value of κ = 1, imply a stationary budget share for space or housing, S, of about 19%.Footnote 20 This is the US housing budget share reported in the OECD Better Life Index, and compares with the OECD average of 21%. All other consumption expenditure share comes from (10) and is about 37%. Thus, total consumption in the model is 56% of measured income, with the rest, 44% spent on schooling. This is obviosly much higher than the US data. Of course in the model there is no physical capital, so all investment for the next generation comes from human capital accumulation. If we use the 21% physical capital investment share of GDP (from PWT), 7.8% total public and private education share of GDP (from Digest of Education Statistics) and share of health expenditures on the population 0–44 (763 out of 2193) on GDP of 14958.3 or 5.1% (from US Health Spending Trends by Age and Gender: Selected Years 2002–10 by Lassman, Hartman, Washington, Andrews and Catlin), and total public and private R&D expenditures as share of GDP 2.74% or $410 billion less $60 billion spent by higher education. Thus, something like $350 billion of R&D are not spent by higher education institutions, or 2.3%. Combining these four produces, a next generation expenditure share of 36.2%. We assume that the first 12 years of schooling has no opportunity cost for the child. We compute the opportunity cost of the 3.25 additional years of schooling in the following manner. We used the year 2013 $31,700 median annual earnings of full time high school graduate male workers, ages 25–34 years. For an economy with 15.25 years of schooling, we assumed these workers earn the year 2013 $41,700 median annual earnings of full time Associate Degree male workers, ages 25–34 years. Using a 4.5% annual discount rate, we find that the foregone earnings are equal to 18% of lifetime earnings of Associate Degree workers. With a labor share of
 $\frac{2}{3}$, this produces a foregone earnings cost of 12%. We thus arrive at 48% share of GDP spent on the next generation.Footnote 21 We summarize our calibration measures in the bottom panel of Table 5. Thus, our stationary values of fertility, schooling, consumption, housing, and next generation expenditures are close to those observed in the US data.
A brief description about the “calibration exercise” for choice of βiRt, νiRt, and κRit is useful. The parameters βiRt, νiRt, and κRit are chosen to fit the race specific data on fertility and cohort years of schooling as closely as possible. We will show below that assuming divisional or national preferences by race and cohort, still fit their respective data extremely well, and the welfare costs of unequal schooling access are very similar to those from state, race, and cohort specific preferences. Although we expected to find higher average values of κRit (that is, lower schooling efficiency) for blacks than for whites for most of the years, no effort was made to ensure κwit < κitb. We followed a two step procedure to fit state, cohort and race specific fertility and schooling. First, the preference pair βiRt, νiRt are not separately identified; they always appear together as βiRtδνiRtiRt. The major discipline that we imposed on our calibration exercise was to force ν = 0.5 for all years 1950–2000. Otherwise, we allowed βiRt and νiRt to vary. This procedure allowed us to match fertility by state, race, and cohort specific fertility. The second step was to search for κRit in order to match the state, race, and cohort specific schooling. Typically, there was little feedback from changing values of κ on fertility. However, if there was sufficient feedback, we then returned to βiRt and νiRt to match state, race, and cohort fertility for the κRit. Then, we returned to the fit of schooling. Generally, this iterative process converged to triple, (βiRt, νiRt, κRit) that fit both fertility and schooling. Our method of “identifying” κbit and κwit is similar to the pioneering work of Mulligan (Reference Mulligan2004, Reference Mulligan2005).
We compute welfare costs of unequal access to schooling using three sets of (β, ν) parameters. Our preferred method allows for full state, race, and cohort heterogeneity in the parameters, (βiRt, νiRt), where i ranges over 1–51. The second method aggregates race preferences within census divisions, weighting by the appropriate race populations within the census division, (βdRt, νdRt), where d ranges over 1–9, the nine census divisions:
 $$\begin{eqnarray}
\beta _{dRt} = \frac{\sum \limits _{j \in d} \beta _{jRt} pop_{jRt}}{\sum \limits _{j \in d} pop_{jRt}},
\end{eqnarray}$$
 $$\begin{eqnarray}
\nu _{dRt} = \frac{\sum \limits _{j \in d} \nu _{jRt} pop_{jRt}}{\sum \limits _{j \in d} pop_{jRt}},
\end{eqnarray}$$
where state j is in census division d. The third method aggregates race preferences nationally, allowing for time variation across cohorts. Thus, we produce
 $$\begin{eqnarray}
\beta _{Rt} = \frac{\sum \limits _{j=1}^{51} \beta _{jRt} pop_{jRt}}{\sum \limits _{j=1}^{51} pop_{jRt}},
\end{eqnarray}$$
 $$\begin{eqnarray}
\nu _{Rt} = \frac{\sum \limits _{j=1}^{51} \nu _{jRt} pop_{jRt}}{\sum \limits _{j=1}^{51} pop_{jRt}}.
\end{eqnarray}$$
For all preference specifications, we used the κRit calibrated to state, race, and cohort preferences to measure the welfare cost of unequal education access.
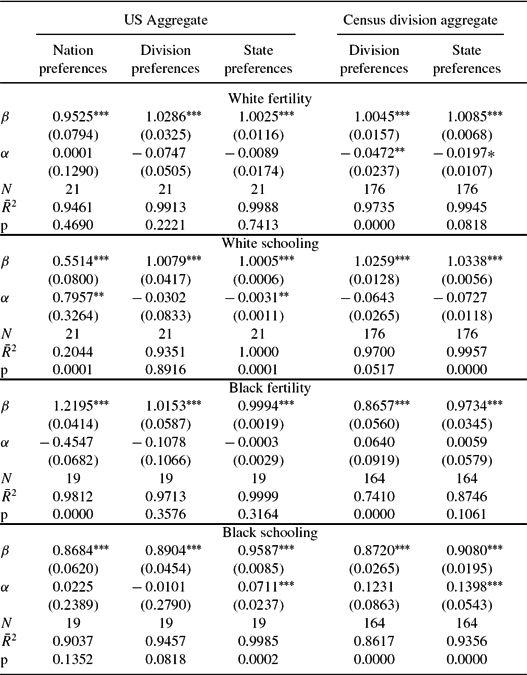
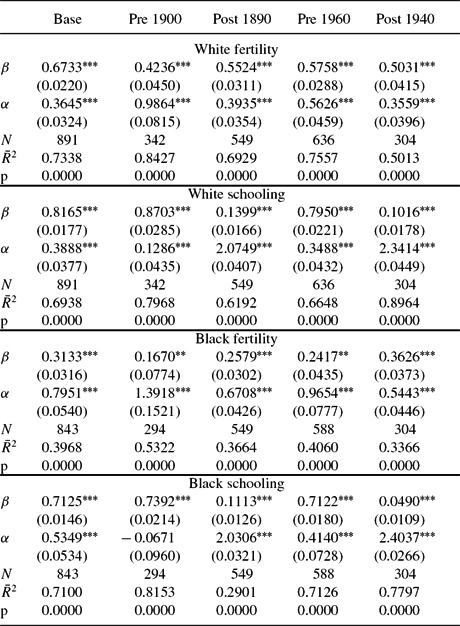
Before presenting the our estimates of κRit, we present the goodness of fit of all three models in matching the respective race and cohort fertility and schooling. Table 6 presents the fit of our solutions with the data. In the first three columns of the table, we compare the log of US national aggregate time series for white, black fertility, and white and black schooling with the log of aggregated solution values for nation preferences, division preferences, and state specific preferences, where the weights are the observed state, race specific, and cohort specific populations. We regressed the log of the actual time series against the log of the model aggregated time series. For the US aggregate series, we corrected for serial correlation and report robust standard errors. With the exception of white schooling, the nation preference model fits the data well. As we allow for more heterogeneity in (βRt, νRt), the fit to the US aggregate series improves. The final two columns present the results of division aggregate values of each of the four series. When there are states present in all nine census divisions for census year t, there are nine different observations in year t. We would not expect nation preferences to fit these series, so we only report the goodness of fit regressions from division preferences and state preferences. Again the fit is quite good; these regressions are the results from pooled regressions with correction for panel serial correlation. We report robust standard errors.
Regressions of log actual observations on log model solutions
Table reports results from pooled regressions with errors corrected for panel autocorrelation and Prais–Winsten heteroskedastic error correction. The final row, marked p, is the p-value on the null hypothesis that β = 1 and α = 0.
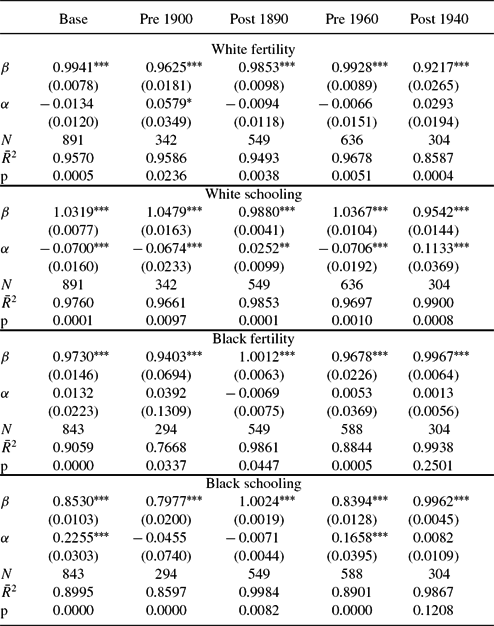
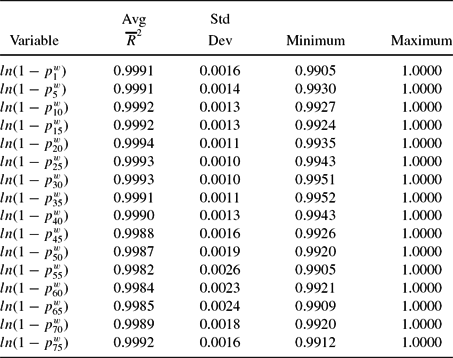
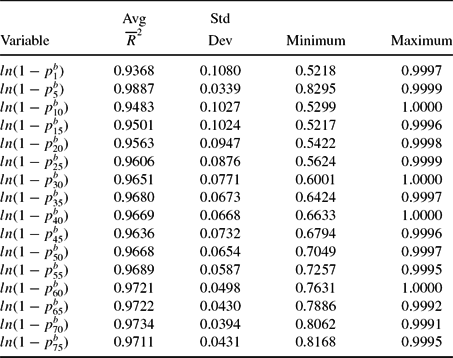
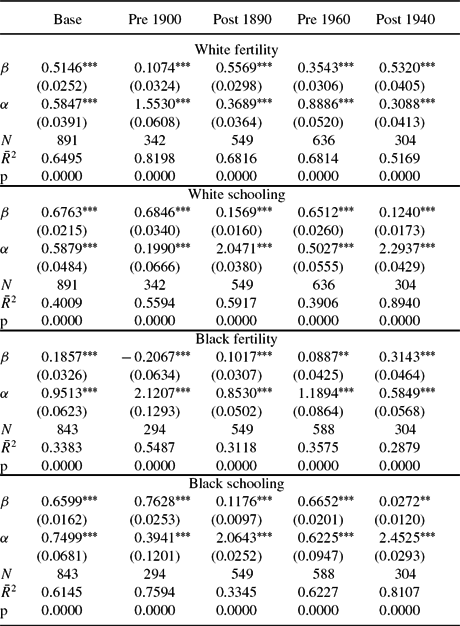
Finally, Table 7 presents the goodness of fit of the model with the actual state, race, and cohort observations in the data for the full model with (βiRt, νiRt), that is state preferences. As before, we regress the log of the actual values of white, black fertility, and white, black schooling. The table reports the results from pooled regressions, with errors corrected for panel serial correlation and robust standard errors. We are comfortable with the ability of the model to capture each state, race, and cohort fertility and schooling. The model fits the entire time series for each series well, c.f. first column. The typical  $\overline{R}^2$ is 0.90 or better. The slope coefficient is close to 1, and the intercept relatively small.Footnote 22 The model can fit separate periods well; these are pre 1900, 1900–2000, pre 1950, and 1950–2000. In the 16 regressions reported in Table 7, only one fails to deliver an
 $\overline{R}^2$ of better than 0.85. The average
 $\overline{R}^2$ in these 16 regressions is 0.9383. The average absolute value deviation from 1 of the slope coefficient is 0.045.Footnote 23 The average absolute value of the intercept is 0.0387.Footnote 24 Another indication of the success of our fit is that the ratio of black human capital to white human capital predicted by our model is 0.54 in 2000 and 0.62 in 2010. The corresponding values for relative black–white earnings for full-time working males who are age 25–64 years and who live in their birth state are 0.59 and 0.57, quite close to our predictions. We believe that Tables 5, 6, and 7 provide strong evidence that the model fits the data well.
Pooled regressions of log actual observations on log model solutions: State preferences
Table reports results from pooled regressions with errors corrected for panel autocorrelation and Prais–Winsten heteroskedastic error correction. The final row, marked p, is the p-value on the null hypothesis that β = 1 and α = 0.
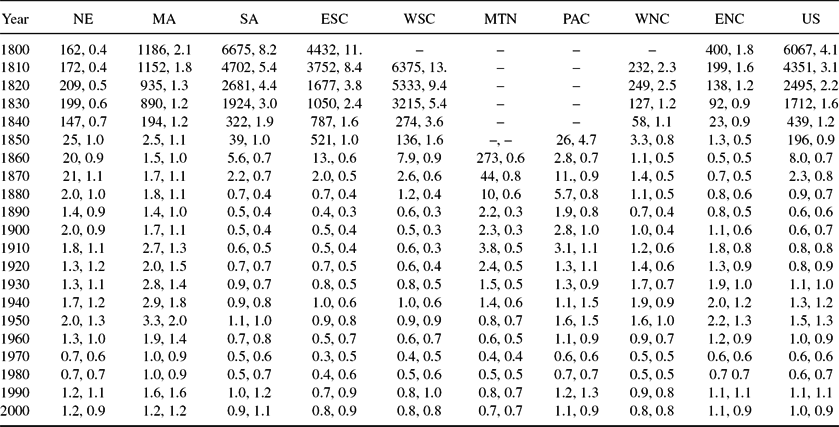
The fitted values of κbt and κwt are shown in Figure 10 and reported in Table 8 by race, year, and census division. The cost of schooling for blacks was prohibitive prior to 1820. As late as 1860, southern black children acquired less than 0.5 years of schooling, compared with between 2 and 4 years of schooling for whites. Matters for blacks improved during Reconstruction, κbt falling, and schooling among southern blacks rising to 2.5–3.5 years. Schooling for the 1950 cohort of southern blacks, those born in 1939, had reached 8–9 years, prior to the 1954 Brown vs. Board of Education decision, about 80% of the level achieved by whites. Average schooling of blacks exceeded 12 years as early as 1970, and by 2000 average black schooling exceeded 14 years, 95% or better of the level achieved by whites.Footnote 25
Black and white cost of schooling, κb, wt.
The declining values in κRt always lead to higher child quality, but need not induce substitution away from quantity. Indeed, our estimates indicate that declining κbt helped to produce the black Baby Boom, despite a rise in population density (the price of living space) and despite declining child mortality. We see κbt decline from 1.5 in 1950 to 1.0 in 1960, to 0.6 in 1970. By 1980, κb1980 = 0.6, but then reverses trend, rising to κb1990 = 1.1 in 1990 and levels off at κb2000 = 1.0 in 2000.
4. VALUING IMPROVEMENTS IN ACCESS TO SCHOOLING
Prior to the civil rights era, we find that κbt ⩾ κtw, indicating that blacks faced much higher schooling costs, or, equivalently, lower schooling efficiency than whites. In terms of our model, this means that for given levels of mortality, human capital stock, and the price of living space, blacks would have chosen counterfactually higher levels of schooling had they enjoyed parity in schooling efficiency.Footnote 26 The relative values of κ converge markedly during the civil rights era.
How much would blacks have been willing to sacrifice in order to face κwt rather than κbt? Denote the utility of a black parent in generation t with initial human capital stock hbt facing schooling efficiency κbt and rental price of space rbt as v(hbt|κtb, rbt). Suppose that this parent faced the series (κwt, rt b), thereby achieving utility level v(hbt|κtw, rbt). We can then answer the question by calculating the additional human capital, hbtΔtb, that must be transferred to blacks so that v(hbt + ht bΔbt|κtb, rbt) = v(ht b|κwt, rt b). This quantity of human capital, equal to the equivalent variation, hbtΔtb = EVbt, is how we measure the welfare cost of discrimination against blacks in access to schooling.
There are three alternative measures of the welfare loss to differential schooling efficiency. The compensating variation for whites, were they to face the schooling efficiency faced by blacks is equal to CVwt = ht wΔwt, and solves v(hwt + ht wΔwt|κtb, rwt) = v(ht w|κwt, rt w). The equivalent variation for whites, the amount a white parent would pay to avoid having black schooling efficiency, EVwt = −ht wΩwt, is implicitly defined as v(hwt(1 − Ωtw))|κwt, rt w) = v(hwt|κtb, rwt). Finally, the black compensating variation is the amount of wealth a black would have willingly given up to purchase the white schooling efficiency: CVbt = −ht bΩbt, defined implicitly as v(hbt(1 − Ωtb))|κwt, rt b) = v(hbt|κtb, rbt). We approximate the equivalent variations and compensating variations by taking advantage of the fact that for any (xt, τt) pair, optimal adult consumption, c, and space per child, S, are linear functions of parental human capital, h. Thus, the utility function is homogeneous of degree φ in h.Footnote 27 Thus,
 $$\begin{eqnarray}
EV_t^b = h_t^b \Delta _t^b: \Delta _t^b \approx & \left[\frac{v(h_t^b |\kappa _t^w, r_t^b)}{v(h_t^b |\kappa _t^b, r_t^b)} \right]^{\frac{1}{\varphi }}-1
\end{eqnarray}$$
 $$\begin{eqnarray}
CV_t^b = -h_t^b \Omega _t^b: -\Omega _t^b \approx & \left[\frac{v(h_t^b |\kappa _t^b, r_t^b)}{v(h_t^b |\kappa _t^w, r_t^b)} \right]^{\frac{1}{\varphi }}-1
\end{eqnarray}$$
 $$\begin{eqnarray}
EV_t^w = -h_t^w \Omega _t^w: -\Omega _t^w \approx & \left[\frac{v(h_t^w |\kappa _t^b, r_t^w)}{v(h_t^w |\kappa _t^w, r_t^w)} \right]^{\frac{1}{\varphi }}-1
\end{eqnarray}$$
 $$\begin{eqnarray}
CV_t^w = h_t^w \Delta _t^w: \Delta _t^w \approx & \left[\frac{v(h_t^w |\kappa _t^w, r_t^w)}{v(h_t^w |\kappa _t^b, r_t^w)} \right]^{\frac{1}{\varphi }}-1.
\end{eqnarray}$$
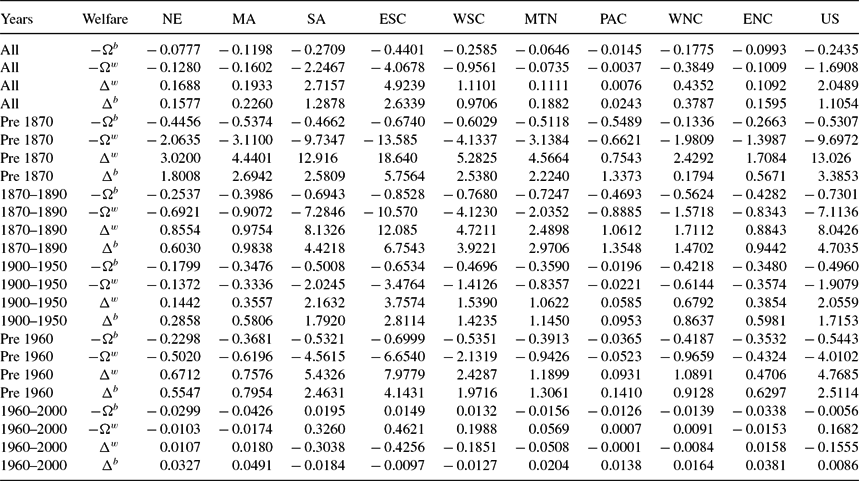
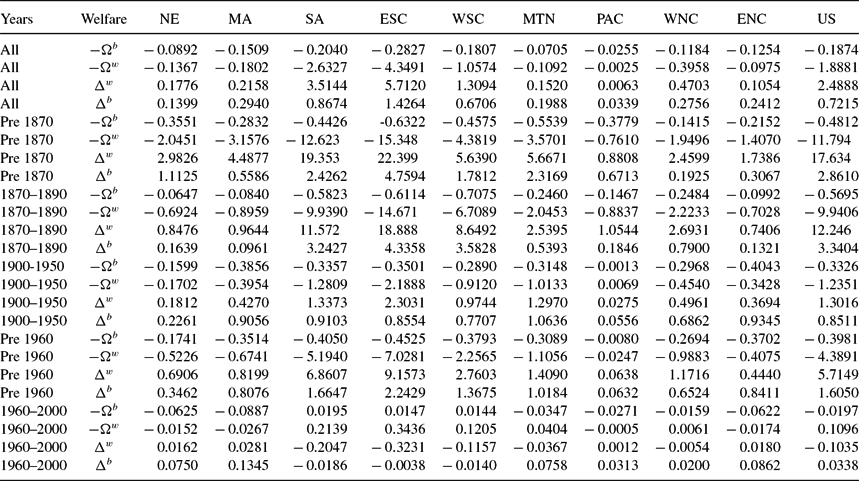
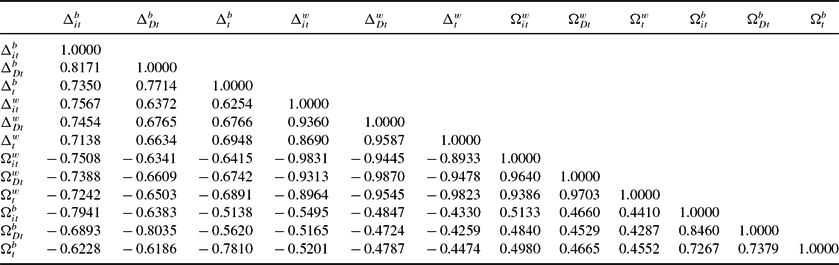
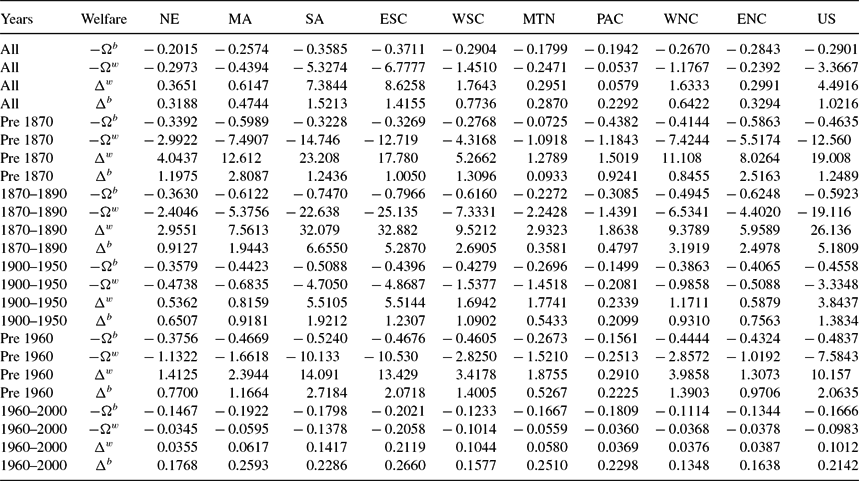
Table 9 reports estimates for all four welfare measures with state preferences. All measures are presented as a proportion of black wealth, and are averaged over the black population of each state. Thus for Δw and Ωw, we multiply each state’s welfare measure by  $\frac{h_t^w}{h_t^b}$. The measures are presented over all years and for the five subperiods of our data: slavery (pre 1870), Reconstruction (1870 to 1890), Jim Crow (1900 to 1950), pre Civil Rights (pre 1960), and the Civil Rights era (1960 to 2000). We present the average results by Census division and for the US as a whole.
Prior to 1870, blacks are estimated to have needed an additional Δbt=3.4 times their lifetime wealth to have the same utility they would have enjoyed with the same schooling efficiency as whites in the US as a whole. The estimated value of Δbt varies widely across regions, ranging from a low of 0.18 in the West North Central to a high of 5.8 in the East South Central. Using division nation preferences and division preferences produces Δbt equal to 2.9 and 2.8 times lifetime black wealth, respectively.Footnote 28 Thus, our results do not depend on preference heterogeneity.Footnote 29
During Reconstruction, the equivalent variation actually rises to 4.7 in the US as a whole. The estimated value of Δbt is lowest in New England, with a value of 0.60, and Δbt rises in the East South Central to 6.8. The rise in Δbt seems paradoxical in light of the absolute and relative decline in κbt. The explanation lies in the differential mortality risk borne by blacks, which remained much higher than for whites. Young adult mortality fell among blacks from 50% prior to the Civil War to 42% during Reconstruction, while mortality among whites fell from 31% to 26%. The result is that black precautionary demand for children remained relatively high. Despite a decline in  $\frac{\kappa _t^b}{\kappa _t^w}$ from 350 to 2.25, the still high precautionary fertility demand made the discrimination more costly, raising Δbt.Footnote 30 Thus while both preferences produce rising welfare costs of unequal school access, they are much smaller than under state preferences. Welfare costs under nation preferences rise from 2.9 to 3.3, and they rise under division preferences from 2.8 to 3.0.
Black schooling efficiency is estimated to have improved during the Jim Crow era, Δbt falling from 4.7 to 1.7 in the US as a whole, and from 6.8 to 2.8 in the East South Central.Footnote 31 The magnitude of the rise in black welfare seems a bit optimistic in light of the legal and social environment faced by blacks. To investigate further, we plot in Figure 10 the time series of (κb, κw) for each census division as well as the US as a whole from 1800–2000. During the Jim Crow era, black schooling costs rise from 0.6 in 1900 to 1.5 in 1950, compared with a rise among whites from 0.7 to 1.3. What, then, accounts for the decline in Δbt during the period? Average black young adult mortality risk declined to 23%, reducing the precautionary demand for children, and thus freeing up resources for better educating the children of those now-smaller families. It seems likely that the reduced precautionary demand for children is the source of much of the relative gains of blacks during this era.
Taken at face value, the estimated values of Δbt for the Civil Rights era suggest that blacks achieved schooling parity with whites in the sense that the estimated values of Δbt are different from zero only in the second decimal place. There are, however, a number of caveats. First, this exercise focuses on the quantity of schooling and not its quality. If the cost of school quality for blacks fell more slowly than the cost of school quantity, and blacks substituted school quantity for school quality, we would exaggerate the decline in κbt and hence understate Δbt. Second, Canaday and Tamura (Reference Canaday and Tamura2009) note that tax revenues paid by blacks could have been diverted to pay for the schooling of whites. Third, the model does not permit labor market discrimination, such as the monopsonization of black employment modeled by Canaday and Tamura (Reference Canaday and Tamura2009).Footnote 32
Population weighted average schooling costs: κb, κw
Table reports our estimates of the schooling access costs, κi, where i = b, w, averages are weighted by black and white populations, respectively.
Welfare cost of education discrimination, state preferences (no DC): Black compensating variation − Ωb, white equivalent variation − Ωw, white compensating variation Δw, black equivalent variation Δb (all as proportion of black life time wealth)
Table reports our estimates of the welfare cost of discrimination in the cost of schooling, as well as the value of Civil Rights. All values are weighted by black population.
Table 9 also presents the other three welfare measures. The broad pattern with these are similar with Δbt. One difference is that the white measures of welfare costs show a decline during Reconstruction as compared with slavery. All four measures show a decline in the welfare cost of education discrimination during Jim Crow compared with Reconstruction.Footnote 33
4.1. Comparisons with Mincerian Returns
Because Mincerian returns are on the order of 10% per year of schooling, our estimates of the welfare cost of schooling inefficiency are several orders of magnitude larger. The reason for the discrepancy is that Mincerian returns measure solely the marginal, market return to a year of schooling, whereas in our model schooling is an input into the production of the next generation’s human capital as well as a market return. Higher schooling costs today reduce the acquisition of schooling of children today, which reduces the ability of those children to teach their children.Footnote 34 Consider, then, the second additive term in (12), and focus only on the utility gain from human capital accumulation of children. The relative utility gain between no discrimination and the historical level of discrimination to a black parent in state s in year t, measured in units of parental wealth, is
 $$\begin{equation}
\left(\frac{\bar{h}_t}{h_{st}}\right)^{\rho _{\kappa ^w}-\rho _{\kappa ^b}} \left(\frac{\tau _{\kappa ^w}}{\tau _{\kappa ^b}} \right)^{\mu }.
\end{equation}$$
The first term captures the feature that as schooling increases, the ability to take advantage of the spillover human capital rises.Footnote 35 The second term is the direct effect from rising schooling levels.Footnote 36
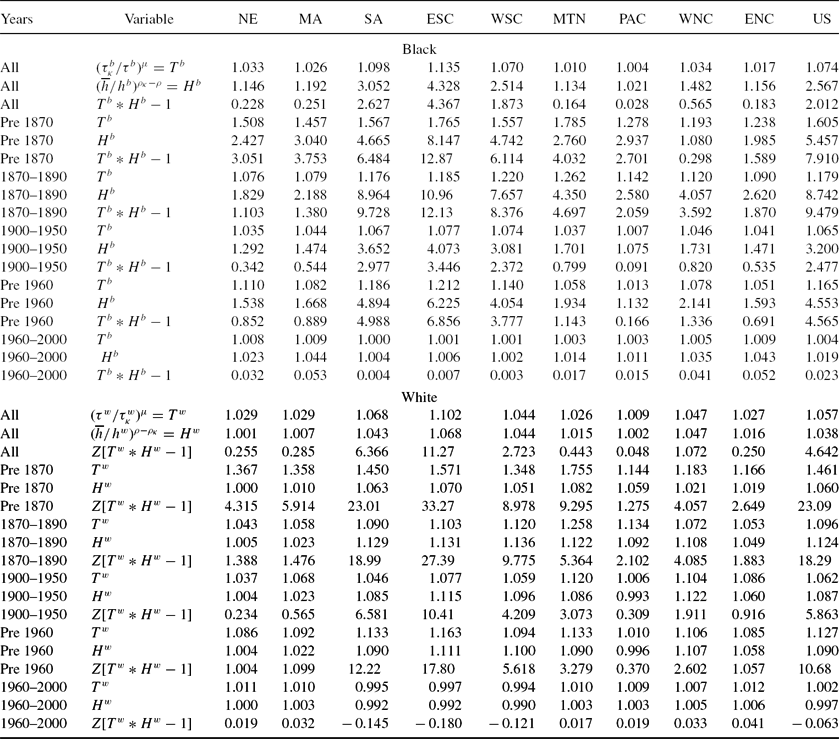
The gains from increased schooling are contained in Table 10, which shows blacks in the top panel and whites in the bottom. Within each panel, we examine the same time periods and divisions, but present the three measures of gains. The first,  $(\frac{\tau _{\kappa }^b}{\tau ^b})^{\mu }=T^b$, measures the increased human capital from increased schooling. The second,
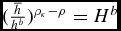 $(\frac{\overline{h}}{h^b})^{\rho _{\kappa }-\rho }=H^b$, measures the increased human capital from increased utilization of the spillover human capital,
 $\overline{h}$. The third measures the net percent gain in human capital, Tb*Hb − 1. The average gain for blacks prior to the Civil War was almost 800%. This ranged from as small as 30% in the West North Central division, to a high of almost 1300% in the East South Central division. The other two southern divisions each had human capital gains of over 600%. Outside of the south all divisions had gains essentially less than 400%.
Sub-utility gains from equal Education opportunity schooling differences, no DC
Table reports our estimates of the gains in human capital from equal education opportunity, that is assuming κbit = κitw. In the white panel of the table, the first two rows in each sub-panel are as percent of white wealth. The third row in each sub-panel is as a percent of black wealth, therefore Z = hw/hb. All values are weighted by black population.
During Reconstruction, human capital gains for blacks rise from 800% to 950%, largely due to the increased value of utilizing the spillover human capital. Staying in school longer and increasing the ability to tap into the spillover, rising ρ, causes an increase in human capital by about 875%. In fact the direct gain from longer schooling falls from 60% prior to the Civil War to less than 20% during Reconstruction. However, there is a reduction in human capital gains in three divisions: New England, Middle Atlantic, and the Pacific. These are precisely the divisions with lower welfare cost measures of discrimination measured by CVb, and two of the three divisions, Pacific being the lone exception, measured by EVb.
The bottom half of Table 10 shows the white human capital gains from decreased education discrimination, that is what the additional human capital white children acquire given their κwit instead of facing κbit. In order to express the human capital gain as a proportion of black human capital in the white panel we apply the  $Z=\frac{h^w}{h^b}$ term in the third measure. During Reconstruction, the human capital gain declines from the pre Civil War value of 2300% to bit more than 1800%. Notice that the gains in increased schooling length from decreased education discrimination fall from 46% prior to the Civil War to 10% during Reconstruction. Also the gains from additional utilization of the human capital spillover increases modestly, from 6% to 12%. The large human capital gains accrue via the large gap between black and white human capital. Prior to the Civil War white parental human capital was about 40 times that of black parental human capital. In the southern three divisions it is more than 41 times larger, and outside of these three divisions it was more than 18 times larger. During Reconstruction, white parental human capital of blacks was 77 times larger than black parental human capital. White parents in the southern three divisions had more than 83 times the average black parental human capital. Outside of the southern three divisions, white parental human capital was 19 times larger than black parental human capital. Outside of the south, there was barely any change in the ratio of white to black parental human capital. In combination with the general reduction in gains from white schooling gains, and white gain from greater spillover utilization, there is a reduction in human capital gains, as measured relative to black human capital in the northern census divisions. Four of six northern census divisions have declining welfare costs of education discrimination, and one with basically no change. Only the Pacific shows a rising welfare cost of education discrimination. Even in the south, two of three census divisions have declining welfare costs of education discrimination, with rising welfare costs only in the West South Central division. Therefore six of nine divisions have declining human capital gains, one essentially constant human capital gain, and two rising human capital gains. However these human capital gains overstate the utility gain, as falling κ would induce a substitution away from children and towards higher schooling levels. Since parents like children, lowered fertility tempers the overall utility gain from declining education discrimination.
During Jim Crow, for blacks or whites, the human capital gains are smaller than the gains that would have occurred during Reconstruction. Thus, the welfare costs of discrimination are declining. In all nine census divisions, blacks over the 1900–1950 period would have enjoyed about 250% more human capital without the education discrimination. This compares with the 950% human capital gains during Reconstruction. In every census division, whites during Jim Crow would see their own human capital gains as nearly 600% of black human capital. While large, this is much smaller than their gains equal to a bit more than 1800% of black human capital.
We present the welfare results graphically in Figure 11. The left side of Figure 11 contains the results of the analyses for the nation. We used the computed EVb κ and CVw κ for changes in κ. We averaged over the states weighting by the state black population. Both are measured as a proportion of black lifetime wealth. In the right side of Figure 11, we present the EVw κ, averaging over the states weighting by the state white population. We also present the CVb κ averaging over the states weighting by the state black population. Since in these cases for most of the years κbt > κtw, the EVw κ, and the CVb κ will be negative, but bounded below by − 1, we expressed these as shares of their respective race human capital. Prior to 1870, whites would have been willing to give up roughly 20% of their wealth to keep their schooling costs from becoming as bad as those faced by their state counterpart blacks. During this same period, blacks would have been willing to give up roughly 70% of their wealth in order to obtain the white prices for schooling in their states.Footnote 37
Left panel: EVb κ, CVw κ, right panel: CVb κ, EVw κ.
4.2. Mortality Differences and the Value of Rising Child Life Expectancy
In this section, we examine the robustness of the welfare costs of unequal education access by looking at two other welfare costs. The model can be used to compute the welfare costs of differential mortality risks, and the welfare gains from falling mortality risk. Using the same parameterization, we can compute both the equivalent and compensating variations to both blacks and whites of mortality differentials. We compute how much better off (worse off) a typical black (white) would have been if he or she faced the same mortality risk as his or her white (black) counterpart in the state. We find that the value of differential mortality risks is similar to the value of differential education access. The timing of the maximum welfare gains for whites and blacks are quite similar to those in education access for EVb and CVb. Maximal gains arise for blacks during Reconstruction and then fall throughout the 1900–2000 period. This is the same pattern for whites using CVw and EVw, a rise in the welfare costs of black mortality risk during Reconstruction with falling welfare costs from 1900–2000. This is in contrast to the time pattern from education discrimination welfare costs from above. Recall that whites had declining welfare costs from black schooling access over the entire 1820–2000 period.
Second, we use the model to compute the value of improved life expectancy over the period 1970 vs 2000, 1950 vs 2000, 1900 vs 2000, and 1850 vs 2000. In the first case, we compare our results with those in Murphy and Topel (Reference Murphy and Topel2006). We find that improved survivor probability of the next generation produces less welfare gains than those arising from improved survivor probability of parents at older ages. Murphy and Topel (Reference Murphy and Topel2006) estimated the value of increased longevity in the US since 1970 to be equal to about $3.2 trillion per year, for a cumulative value of $95 trillion.Footnote 38
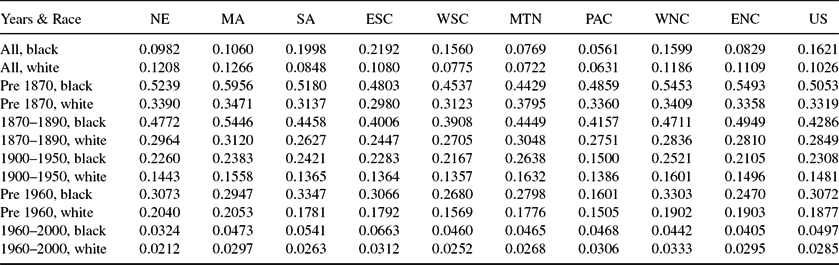
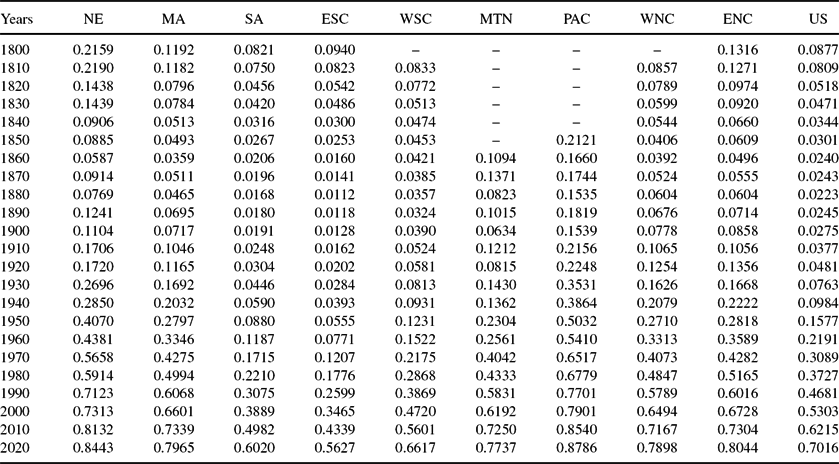
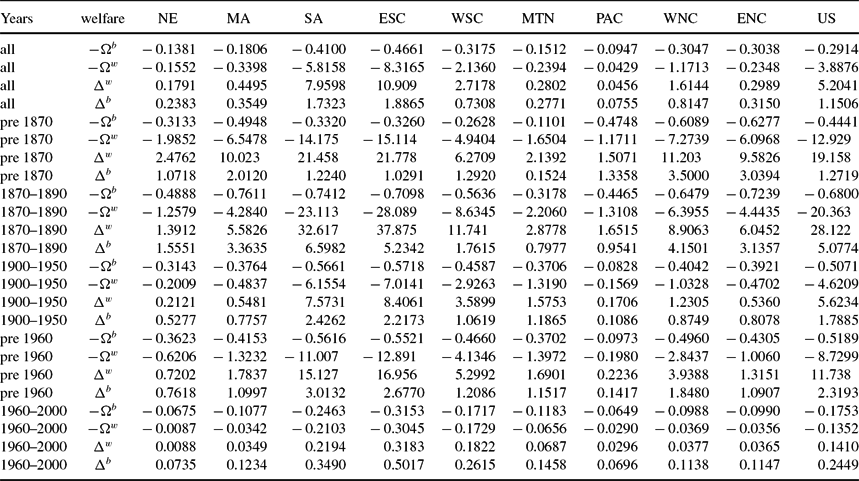
In the first exercise, we judge the robustness of our welfare cost estimates of education discrimination by examining the results arising from mortality differences. There were strong racial differences in mortality risks. This is contained in Table 11.Footnote 39 Blacks generally faced much higher mortality risk in every division of the country. Prior to the end of slavery, the typical black child had less than a 50% probability of living to 35. We produce equivalent and compensating variations for whites and blacks by counterfactually presenting them with their racial counterpart mortality risks. Figure 12 and Table 12 present the results of this experiment, for state preferences. We also find that the magnitudes of welfare costs of higher black mortality are similar to those measured for schooling access differences, which makes us confident in the size of welfare losses to blacks of differential schooling access.Footnote 40
Population weighted average young adult mortality: δb, δw
Table reports average young adult mortality δi, where i = b, w, averages are weighted by black and white populations, respectively.
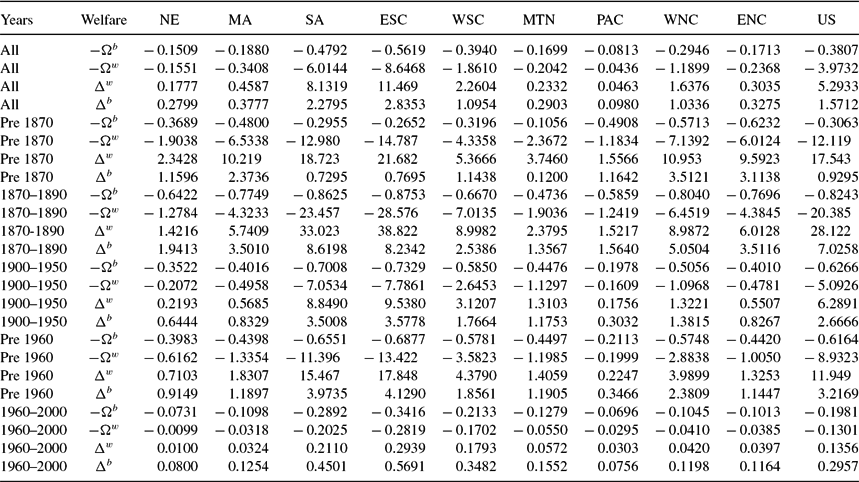
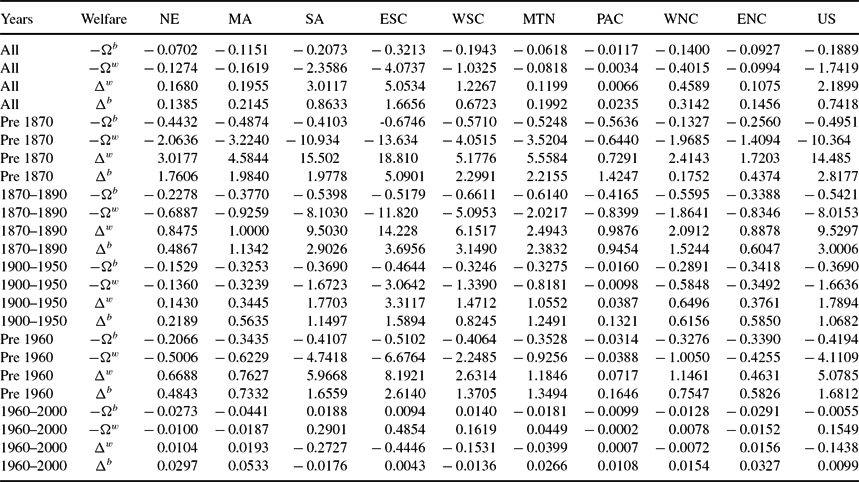
Welfare cost of differential mortality, state preferences: Black compensating variation − Ωb, white equivalent variation − Ωw, white compensating variation Δw, black equivalent variation Δb (all as proportion of black life time wealth)
Table reports our estimates of the welfare cost of differential mortality. All values are weighted by black population.
Left panel: EVbdeath, CVwdeath, right panel: CVbdeath, EVwdeath.
Table 12 contains our welfare estimates of the costs of higher young adult mortality risk. The welfare costs of differential mortality risk range from 38% (CVb) to 150% (EVb) to 400% (EVw), and finally 500% (CVw) of black lifetime wealth. The period of largest welfare costs of differential black young adult mortality is during Reconstruction, when blacks moved from rural to more urban areas within states, and to more populous states from less populous states. Prior to the end of slavery, the welfare costs for blacks range from 30% (CVb) to 90% (EVb) to 1200% (EVw) and finally to 1750% (CVw) of black lifetime wealth. These costs rise during Reconstruction to 80% (CVb) to 700% (EVb) to 2000% (EVw) and finally to 2800% (CVw) of black lifetime wealth. Computing welfare costs of differential black young adult mortality using EVb or CVb, we see that all census divisions had rising costs during Reconstruction compared to before the Civil War. The most pronounced increases occur in the three southern census divisions. Prior to the Civil War, these divisions had lower welfare costs (measured by CVb and EVb)of differential black young adult mortality than in all of the northern divisions, with the exception of the Mountain. This is a reflection of the more rural, and hence healthier location, residential pattern of southern blacks compared to more urban northern blacks. Prior to the Civil War, in these three southern divisions, the average young black adult mortality was about 50%. In comparison, the average white young adult mortality prior to the Civil War was 31%. Prior to 1870 outside of these three southern divisions, young black adult mortality was 57%, and young white adult mortality was 34%. During Reconstruction, there is a dramatic increase in the welfare cost of differential young adult mortality risk, and becomes much larger in the three southern divisions than anywhere else in the US. Black young adult mortality during Reconstruction in the three southern divisions was 42%, compared to 26% for white young adult mortality. Outside of these three southern divisions, during Reconstruction, average black young adult mortality was 50% versus average white young adult mortality of 29%. During Reconstruction for blacks in the three southern divisions, white young adult mortality risk, 26%, is similar to black young adult mortality risk in these southern divisions over the 1900–1940 period, 26%. Average black fertility in the three southern divisions during Reconstruction is 6.8, with average schooling of 2.2 years. Average black fertility in the three southern divisions during 1900–1940, is 4.4, with average schooling of 5.9 years. Thus, the welfare costs to blacks of differential mortality during Reconstruction is in the heart of their demographic transition. To match the pre Civil War southern white young adult mortality of 31%, this occurred for southern blacks over the period 1900–1910, 33%. For these southern blacks, average fertility and schooling is 5.6 children and 4.6 years, respectively. By comparison, average southern black fertility and southern black schooling during the pre Civil War period is 7.4 children and 0.12 years of schooling. Thus prior to the Civil War, we would expect welfare gains arising from a decline of 1.8 children (5.6 vs. 7.4) and an increase of 4.5 years of schooling (4.6 years vs 0.11 years). During Reconstruction, we would expect welfare gains arising from a decline of 2.4 children (4.4 vs. 6.8) and an increase of 3.7 years of schooling (5.9 vs. 2.2). However, recall that during Reconstruction the gain from rising years of schooling to take advantage of the rise in spillover human capital is the largest of all time periods, see Table 10.
In contrast to the time series of welfare costs using EVb or CVb, we find that using EVw or CVw produces rising welfare costs of differential young adult mortality only in the three southern divisions. For the other six divisions, welfare costs fall during Reconstruction compared to the pre-Civil War era. Thus, we are confident that there is a rising cost of differential young adult mortality in the three southern divisions, and more mixed results for the other six census divisions.
During the Jim Crow era, 1900–1950, the welfare costs of differential mortality falls in comparison with the Reconstruction period. This is true of the 36 division cases, nine divisions, and four welfare measures. For the US during Jim Crow, the welfare costs of differential mortality range from 62% (CVb) to 267% (EVb) and from 500% (EVw) to 600% (CVw) of black lifetime wealth. With the exception of CVb, all other welfare measures are less than half their comparable measures during Reconstruction. For CVb, the decline is from 82% to 62%.
Finally during the 1960-2000 period, welfare costs of differential mortality falls in comparison with the Jim Crow era. In every census division, the welfare costs decline substantially. Welfare costs decline by at least 67%, for example the smallest decline comes from CVb. During Jim Crow, the welfare cost was equal to 62% of black lifetime wealth, but during the 1960–2000 period the welfare cost is 20% of black lifetime wealth. In the other three cases, the decline is 90% for EVb, 97% for EVw, and CVw.Footnote 41
4.3. The Value of Improved Child Life Expectancy
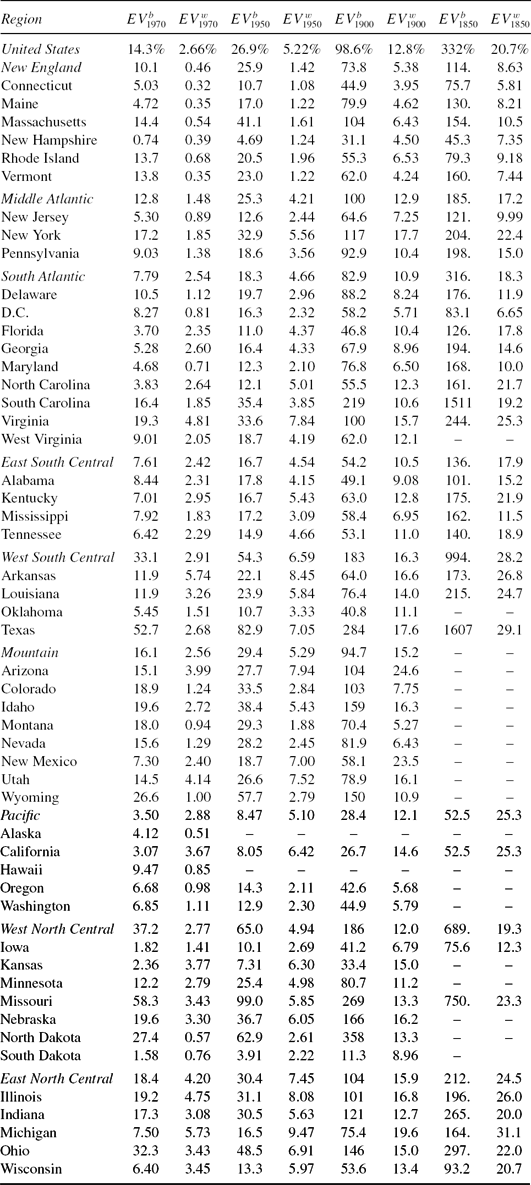
In this subsection, we present measures of the value of improved child longevity since 1970, 1950, 1900, and 1850. We view this exercise as another robustness check on our welfare cost estimates above. We expect that our answers will be smaller in magnitude than what is found in Murphy and Topel (Reference Murphy and Topel2006) as the decline in young adult mortality is discounted relative to one’s own mortality. However, it is conceivable that the mortality declines prior to 1970 are sufficiently large to produce welfare gains in excess of those found in Murphy and Topel (Reference Murphy and Topel2006).
Table 13 presents the Equilibrating Value in the year 2000 of increased child longevity for blacks and whites in each of the four comparison years, 1970, 1950, 1900, and 1850.Footnote 42 For the US as a whole, we find that welfare gains for blacks greatly exceed those for whites. The EVb produces 14% and 3% lifetime wealth gains for blacks and whites respectively from improvements in child survivability since 1970. Recall that Murphy and Topel (Reference Murphy and Topel2006) find welfare gains from life extension, particularly for those over 40, net of increased medical expenditures of $61 trillion, or about 125% of total wealth. Thus, our estimates are only on the order of 2% to 10% of those estimated by Murphy and Topel (Reference Murphy and Topel2006). The value of increased child longevity since 1950, which captures the effect of the discovery of antibiotics, almost double the previous measures, 27% for blacks and 5% for whites. For whites, the range goes from a low of 1% of their wealth in Connecticut, to a high of 9.5% of their wealth in Michigan. For blacks, the range varies from 4% in South Dakota to 99% in Missouri. Since 1900 black gains are equal to 100% of their lifetime wealth, and white gains are equal to 13% of their lifetime wealth. Moving to the gains over the century, our estimates of black gains range from a low of 11% in South Dakota to a high of 360% in North Dakota.Footnote 43 For whites, the gains range from 4% in Connecticut to 24% in New Mexico. Finally, over the 1850–2000 period, the gains to blacks overall are equal to 330% of their lifetime wealth and 21% of white lifetime wealth. For blacks, the range goes from a low of 45% in New Hampshire, to a high of 1600% in Texas. For whites, the gain in child longevity ranges from 6% in Connecticut to 31% in Michigan.
Value of medical advances: Equilibrating values
While the black welfare measures seem quite plausible, with rising welfare gains, going backward in time, of 14% in 1970 to 330% in 1850, the white numbers seem too low. It seems implausibly low that it would only take 21% of lifetime wealth in 2000 to compensate for 1850 child life expectancy. Much of this is driven by the sharp decline in the preference parameter β post 1950. By 2000, the value of β averages 0.09 for whites, whereas for blacks the average is 0.64. The large discrepancy is needed in order to fit black fertility and white fertility during the Civil Rights era. There is almost no corresponding differences in ν. For whites, the average in 2000 of this taste parameter is 0.5, and for blacks the average is 0.49. As a result, there is still a large precautionary demand for fertility amongst blacks, and hence a large premium to be valued for lower mortality risk.
5. HUMAN CAPITAL AND OUTPUT
We have calibrated our model using data on black and white mortality, fertility, and schooling and average long run growth rate of output per worker, but without using data on output or labor market earnings. One might therefore question the validity of estimates of the welfare cost, which are based on equivalent and compensating variations in human capital estimated purely via a quantity–quality model of fertility. In this section, we empirically confront the model solutions of human capital with data on state output per worker, and measures of earnings, and permanent income by state and race. To briefly summarize our findings, the model’s time series of black and white human capital is positively and strongly correlated with measures of state output per worker, black and white permanent income and black and white earnings. Furthermore, the growth rates of black and white human capital are also positively and generally statistically correlated with the growth rates of output per worker, black and white permanent income and black and white earnings.
Figures 13 and 14 present the time series of white and black human capital by division. The human capital from the model can be used to compute average human capital in state i and year t, and is equal to the weighted average of human capital over cohort and race:
 $$\begin{eqnarray}
H_{it} = \sum _{j=1}^2 \sum _{k=1}^5 s_{ijkt} h_{ijkt} \\
\nonumber h_{ij1t} = h_{ij,15-24,t} \\
\nonumber h_{ij2t} = h_{ij,25-34,t} \\
\nonumber h_{ij3t} = h_{ij,35-44,t} \\
\nonumber h_{ij4t} = h_{ij,45-54,t} \\
\nonumber h_{ij5t} = h_{ij,55-64,t} \\
\nonumber 1 = \sum _{j=1}^2 \sum _{k=1}^5 s_{ijkt}.
\end{eqnarray}$$
We compare Hit with state-level data on output per worker from Turner, Tamura, Mulholland (Reference Turner, Tamura and Mulholland2013), available from 1840 through 2000.Footnote 44 State output values prior to 1840 are imputed as a function of the national growth rate of output per worker. For states that we first observe from 1840 onward, but have information on fertility, schooling, and population prior to their first year of observation we imputed output per worker assuming the same national growth rate as the US, and then reduced output per worker by a factor 0.9810 for each decade back-projected, up to a minimum of 0.9830. This assumes a convergence rate similar to that typically measured in the literature of 2% per year, for example, as in Barro and Sala-i-Martin (Reference Barro and Sala-i-Martin1992) and Tamura (Reference Tamura1996). We report our results both with and without this imputed data.
Cohort black and white human capital.
Cohort black and white human capital.
Denoting the data on output per worker as yit, we estimate
 $$\begin{equation}
ln y_{it} = B ln H_{it} + \Gamma \text{Mining}_{it} + \mu _i + \epsilon _{it},
\end{equation}$$
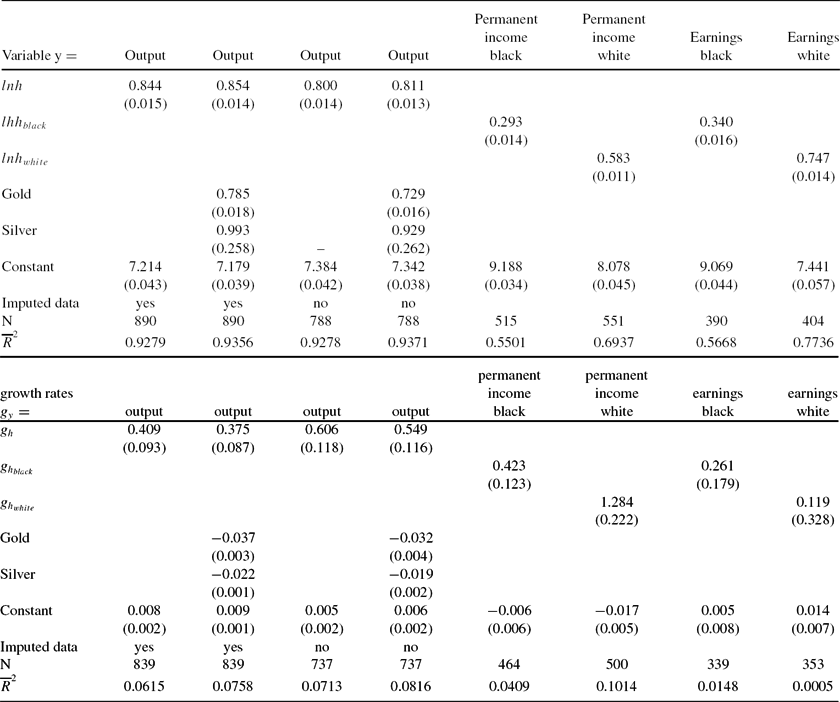
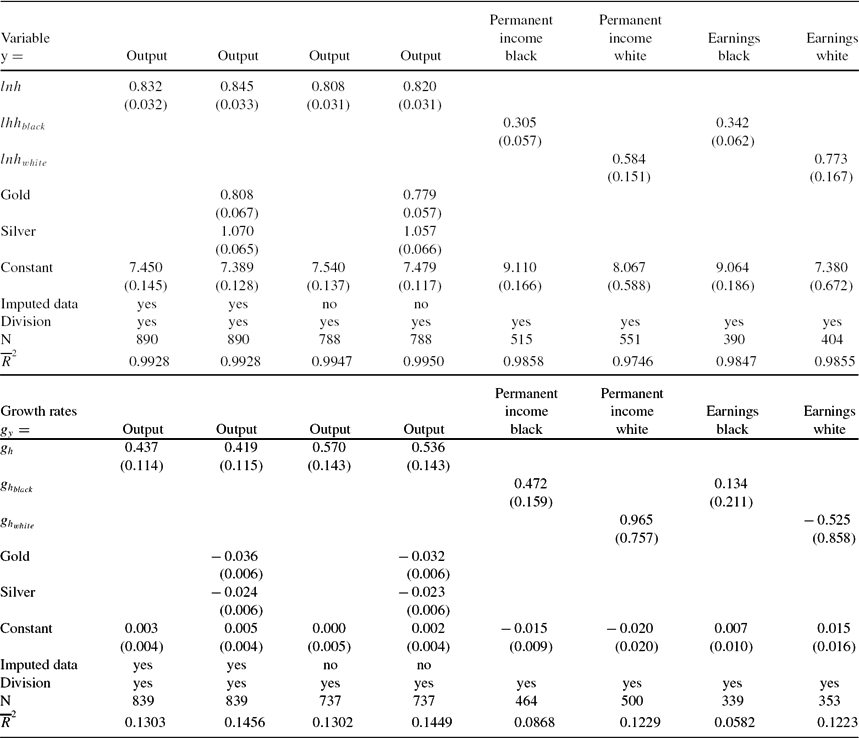
we use fixed effects with errors clustered by state.Footnote 45 We include two dummy variables, denoted Miningit, which are equal to unity for states engaged in large scale gold or silver extraction in year t, and equal to zero otherwise. Table 14 presents the regression results.Footnote 46 The regression results for the whole sample, seen in columns 1 and 2, indicate that our measures of human capital are highly correlated with state output per worker. The results in columns 3 and 4, which drop imputed data, produce nearly identical results.
Fixed effects regressions: ln(y) top panel, gy bottom panel; (standard error)
Two shortcomings of state output per worker is that it may reflect factors other than human capital, and does not capture the flow of income over a lifetime. Data on labor earnings are widely available only starting with the 1940 decennial census. We therefore used census data to calculate earnings by state, census year, race, and 10-year age cohort to construct measures of “permanent income,” defined as the average annual earnings of men between the ages of 26 and 65 years.Footnote 47 Take for example natives of South Carolina who were between 16 and 25 years old in 1930. These individuals will be between the ages of 26 and 35 years in 1940, 36 and 45 in 1950, 46 and 55 in 1960, and 56–65 in 1970. Our synthetic cohort permanent income is defined as the mean earnings, in constant 2009 dollars, over these four age groups (26–65 years), weighted by cell size. We produce estimates of permanent income for whites and blacks, focusing on those born in state i and residing in state i. Ignoring the state identifier we used the following:
 $$\begin{eqnarray}
y_{1910}^{pR} =& \overline{y}_{56-65,1940}^R
\end{eqnarray}$$
 $$\begin{eqnarray}
y_{1920}^{pR} = & \displaystyle\frac{\overline{y}_{46-55,1940}^R n_{46-55,1940}^R + \overline{y}_{56-65,1950}^R n_{56-65,1950}^R}{n_{46-55,1940}^{R} + n_{56-65,1950}^R}
\end{eqnarray}$$
 $$\begin{eqnarray}
y_{1930}^{pR} =& \displaystyle\frac{\overline{y}_{36-45,1940}^Rn_{36-45,1940}^R+\overline{y}_{46-55,1950}^R n_{46-55,1950}^R + \overline{y}_{56-65,1960}^{pR} n_{56-65,1960}^R}{n_{36-45,1940}^R+n_{46-55,1950}^R + n_{56-65,1960}^R}\nonumber\\
\end{eqnarray}$$
 $$\begin{eqnarray}
y_{t}^{pR} =& \frac{\overline{y}_{26-35,t}^R n_{26-35,t}^R+\overline{y}_{36-45,t+10}^Rn_{36-45,t+10}^R+\overline{y}_{46-55,t+20}^R n_{46-55,t+20}^{R} + \overline{y}_{56-65,t+30}^R n_{56-65,t+30}^R}{n_{26-35,t}^R+n_{36-45,t+10}^R+n_{46-55,t+20}^R + n_{56-65,t+30}^R}.
\end{eqnarray}$$
 $$\begin{eqnarray}
t=&1940, 1950, 1960, 1970, 1980
\end{eqnarray}$$
 $$\begin{eqnarray}
y_{1990}^{pR} =& \displaystyle\frac{\overline{y}_{26-35,1990}^R n_{26-35,1990}^R+\overline{y}_{36-45,2000}^R n_{36-45,2000}^R + \overline{y}_{46-55,2010}^{R} n_{46-55,2010}^R}{n_{26-35,1990}^R+n_{36-45,2000}^R + n_{46-55,2010}^R} \nonumber\\
\end{eqnarray}$$
 $$\begin{eqnarray}
y_{2000}^{pR} = & \displaystyle\frac{\overline{y}_{26-35,2000}^R n_{26-35,2000}^R + \overline{y}_{36-45,2010}^R n_{36-45,2010}^R}{n_{26-35,2000}^R + n_{36-45,2010}^R}
\end{eqnarray}$$
 $$\begin{eqnarray}
y_{2010}^{pR} =& \overline{y}_{26-35,2010}^R,
\end{eqnarray}$$
where ypRt is the permanent income of 26–35 year old male cohort in census year t for race R,  $\overline{y}_{X,t}^R$ is the average income of cohort of age X, in year t for race R, and nR X, t is the number of individuals of cohort age X in year t of race R.Footnote 48 We regress our the log of the human capital of the young adult cohort, 25–34, born in state i and residing in state i in year t, lnhR 25 − 34, i, t against lnypRit from above:
 $$\begin{equation}
lny_{it}^{pR} = B lnh_{25-34,i,t}^R + \mu _i + \epsilon _{it}.
\end{equation}$$
Columns 5 and 6 of Table 14 presents the results of these fixed effects regressions (with errors clustered at the state level), by race, of permanent income on lnhRit. In both specifications, the coefficient on log human capital is positive and significant at better than 1%.Footnote 49
Finally, we construct measures of real income by race, by state. We average across all age groups within state i, those men born in state i. Thus, we construct for 1940 ⩽ t ⩽ 2010:
 $$\begin{eqnarray}
y_{t}^R =& \displaystyle\frac{\overline{y}_{26-35,t}^R n_{26-35,t}^R+\overline{y}_{36-45,t}^Rn_{36-45,t}^R+\overline{y}_{46-55,t}^R n_{46-55,t}^R + \overline{y}_{56-65,t}^R n_{56-65,t}^R}{n_{26-35,t}^R+n_{36-45,t}^R+n_{46-55,t}^R + n_{56-65,t}^R} \nonumber\\
\end{eqnarray}$$
 $$\begin{eqnarray}
H_{t}^R =& \displaystyle\frac{h_{26-35,t}^R n_{26-35,t}^R+h_{36-45,t}^Rn_{36-45,t}^R+h_{46-55,t}^R n_{46-55,t}^R + h_{56-65,t}^R n_{56-65,t}^R}{n_{26-35,t}^R+n_{36-45,t}^R+n_{46-55,t}^R + n_{56-65,t}^R}. \nonumber\\
\end{eqnarray}$$
We regress the log of our measure of average human capital against the log of our average real income:
 $$\begin{equation}
lny_{it}^R = B lnH_{i,t}^R + \mu _i + \epsilon _{it}.
\end{equation}$$
Columns 7 and 8 of Table 14 shows the results of these fixed effects regression (with errors clustered at the state level). The results reinforce the conclusions based on permanent income.
The bottom panel of Table 14 contain regression results based on the growth rates of output per worker and the growth rates of human capital from the model.Footnote 50 The first two columns of Table 14 uses all of the data on output per worker, while columns 3 and 4 use the non imputed output per worker data. In all of these regressions, output per worker growth is strongly positively and significantly related to human capital growth. The final four columns present the results from growth rates of permanent income by race, and growth rates of earnings by race. For permanent income growth, we find positive and significant results.Footnote 51 The growth rate of earnings is positively but insignificantly related to our measures of state human capital growth rates.
6. CONCLUSION
This paper used a quantity–quality model of fertility, calibrated to data for the states of the US, by race, between 1800 and 2000, to examine the value of improved schooling access for whites and blacks. We estimate that prior to the Civil War, the welfare cost of discrimination in school access ranged between 50% and 13 times black wealth, depending on division and welfare measure. Prior to 1960, we estimate the welfare cost of discrimination in the south ranges between 50% to 8 times black wealth. Interestingly, the value of schooling gains that occurred during the civil rights era was relatively modest, at just 1% of black wealth for CVb and EVb.Footnote 52 Outside of the South, we find significant costs of discrimination prior to 1960, ranging from 4% to 100% of black wealth. For these divisions from 1960–2000, blacks have attained rough parity in the quantity of schooling. Analysis of the value of access to quality schooling remains an important topic for research. Our measures are consistent with gains from health. Falling mortality and the closing of black and white mortality differences produce similar welfare gains. Finally, our human capital measures are strongly, positively, and significantly correlated with observed measures of output per worker, permanent income, and earnings. The growth rates of human capital from our model are strongly, positively, and significantly related to the growth rates of state output per worker, black and white permanent income. Thus, we find that the state black and white human capital time series produced by the model is empirically plausible.
7 APPENDIX
7.1. Imputation of Mortality Rates
For some states even after becoming a “death registration state,” there are missing values. For these years, we initially seed those observations with interpolated values. We describe the estimates below. We construct log infant survival probability for each state with death registration data:
 $$\begin{equation}
{\rm log\ infant\ survival\ for\ state}\ {i}\ {\rm in\ year\ t} = ln (1 - p_{i0t}),
\end{equation}$$
where p i0t is the infant mortality rate in state i in year t. Based on the information without interpolated values, we run state specific regressions of log infant survival on time and time squared. We use the results of this regression to back forecast missing values of log infant survival, and finally missing infant mortality:
 $$\begin{eqnarray}
ln (1-p_{i0t} ) = \alpha _i + \beta _i t + \gamma _i t^2
\end{eqnarray}$$
 $$\begin{eqnarray}
\hat{z}_{i0t} = \hat{\alpha }_i +\hat{\beta }_i t + \hat{\gamma }_i t^2
\end{eqnarray}$$
 $$\begin{eqnarray}
\hat{p}_{i0t} = \min \lbrace 0{.375, 1-\exp (\hat{z}_{i0t})} \rbrace .
\end{eqnarray}$$
In (41), we place an upper bound on the infant mortality rate, 0.375, in order to keep the following methodology determining cumulative death probabilities non decreasing.Footnote 53 The typical time series regression has an  $\overline{R}^2$ of 0.9609. The standard deviation of the
 $\overline{R}^2$ is 0.04. Only Pennsylvania has an
 $\overline{R}^2$ less than 0.90, and it is 0.7095.Footnote 54
Next, we produce an estimate for missing probability of dying before age 5 years:
 $$\begin{eqnarray}
ln(1-p_{i5t} ) =& \Lambda _{i0} ln ( 1-p_{i0t} )
\end{eqnarray}$$
 $$\begin{eqnarray}
\hat{z}_{i5t} =&\hat{ \Lambda }_{i0} ln ( 1- \hat{p}_{i0t})
\end{eqnarray}$$
 $$\begin{eqnarray}
\hat{p}_{i5t} =& \max \lbrace 1.01 \hat{p}_{i0t}, \min [.45, 1-\exp ( \hat{z}_{i5t} )] \rbrace .
\end{eqnarray}$$
Equation (44) guarantees that the probability of dying before 5 is never less than the infant mortality rate, and is capped at 0.45. We continue in this manner regressing log survival to age X against log survival to age X–5, without a constant; these are presented in equations (45)–(49). We then use this regression to back forecast the missing values of log survival to age X ⩾ 5, before finally producing an estimate for the missing probability of dying before age X ⩾ 5:
 $$\begin{eqnarray}
ln(1-p_{iXt} ) =& \Lambda _{iX} ln (1 - p_{iX-5t} )
\end{eqnarray}$$
 $$\begin{eqnarray}
\hat{z}_{iXt} =& \hat{\Lambda }_{iX} ln ( 1- \hat{p}_{iX-5t} )
\end{eqnarray}$$
 $$\begin{eqnarray}
\hat{p}_{iXt} =& \max \lbrace \Omega _X \hat{p}_{iX-5t} , \min [ \omega _X , 1-\exp ( \hat{z}_{iXt})] \rbrace
\end{eqnarray}$$
 $$\begin{eqnarray}
\Omega _X =& \left\lbrace \begin{array}{@{}l@{\quad }l@{}}1.01, & \text{if } X \in \lbrace 5,10,15,20,25 \rbrace \\
1.001, & \text{if } X \in \lbrace 30, 35, 40, 45, 50, 55 \rbrace \\
1.0001, & \text{if } X \in \lbrace 60, 65 \rbrace \\
1.00001, & \text{if }X \in \lbrace 70, 75 \rbrace \\
\end{array}\right.
\end{eqnarray}$$
 $$\begin{eqnarray}
\omega _X =& \left\lbrace \begin{array}{@{}l@{\quad }l@{}}0.450, & \text{if } X=5 \\
0.525, & \text{if } X = 10 \\
0.575, & \text{if } X = 15\\
1.00, & \text{if } X > 15 \end{array}\right.
\end{eqnarray}$$
We use (47)–(49) to ensure that mortality rates are non decreasing in age. We report the goodness of fit of these regressions in Table 16. As can be seen the fit of these regressions is quite good. The average  $\overline{R}^2$ is better than 0.998. We are confident that this procedure produces good estimates of the state log survival probabilities. Having produced estimates of the state log survival probability for infants (age 0 years) and every 5 year age category all the way to age 75 years, we then regress log survival of whites and log survival of blacks to age X against the state log survival to age X for the years in which the state is a death registration state.
 $$\begin{eqnarray}
ln(1-p_{iXt}^b ) =& \Lambda _{iX}^b ln (1 - p_{iXt} )
\end{eqnarray}$$
 $$\begin{eqnarray}
\hat{z}_{iXt}^b =& \hat{\Lambda }_{iX}^b ln ( 1- \hat{p}_{iXt} )
\end{eqnarray}$$
 $$\begin{eqnarray}
\hat{p}_{iXt}^b =& \min \lbrace \Omega _X \hat{p}_{iX-5t}^b , \min [ \omega _{X} , 1-\exp ( \hat{z}_{iXt}^b)] \rbrace
\end{eqnarray}$$
 $$\begin{eqnarray}
ln(1-p_{iXt}^w ) =& \Lambda _{iX}^w ln (1 - p_{iXt} )
\end{eqnarray}$$
 $$\begin{eqnarray}
\hat{z}_{iXt}^w =& \hat{\Lambda }_{iX}^w ln ( 1- \hat{p}_{iXt} )
\end{eqnarray}$$
 $$\begin{eqnarray}
\hat{p}_{iXt}^w =& \max \lbrace \Omega _X \hat{p}_{iX-5t}^w , \min [ \omega _{X} , 1-\exp ( \hat{z}_{iXt}^w)] \rbrace
\end{eqnarray}$$
 $$\begin{eqnarray}
\Omega _X =& \left\lbrace \begin{array}{@{}l@{\quad }l@{}}1.01, & \text{if } X \in \lbrace 5,10,15,20,25 \rbrace \\
1.001, & \text{if } X \in \lbrace 30, 35, 40, 45, 50, 55 \rbrace \\
1.0001, & \text{if } X \in \lbrace 60, 65 \rbrace \\
1.00001, & \text{if }X \in \lbrace 70, 75 \rbrace \\
\end{array}\right.
\end{eqnarray}$$
 $$\begin{eqnarray}
\omega _X =& \left\lbrace \begin{array}{@{}l@{\quad }l@{}}0.450, & \text{if } X=5 \\
0.525, & \text{if } X = 10 \\
0.575, & \text{if } X = 15\\
1.00, & \text{if } X > 15\\
\end{array}\right.
\end{eqnarray}$$
The results of the goodness of fit of these regressions are contained in Tables 17 and 18. The fit for whites is extremely good. In every state, whites are the majority of the state population, and hence are most important in the determination of the state mortality. The average  $\overline{R}^2$ is 0.999. Thus, our predicted white log survival probability is likely to be very accurate.
Relative black human capital
 $\overline{R}^2$ of ln(1 − p X + 5) on ln(1 − pX)
Our fit for blacks is a tad bit lower. There are quite a few states in which blacks are a very small minority of the state population. Nonetheless, the average  $\overline{R}^2$ is 0.964. The column reporting the minimum
 $\overline{R}^2$ looks potentially worrisome. However, the number of states with
 $\overline{R}^2$ less than 0.81, and hence a correlation of less than 0.9, for all log survival regressions except for log infant survival, is either two or three.Footnote 55 Only log infant survival has more than three states, five, with an
 $\overline{R}^2$ less than 0.81.Footnote 56
For missing values of log survival probabilities for blacks (whites), we used the predicted value from these regressions. We then produce estimates of black (white) probabilities of dying before age X, i.e. 1 – survival probability to age X. For those observations in which we have predicted values of death probabilities, and interpolated values of death probabilities, we then take the arithmetic average of the two values, for blacks and whites.
 $\overline{R}^2$ of ln(1 − pwhiteX) on ln(1 − pX)
 $\overline{R}^2$ of ln(1 − pblackX) on ln(1 − pX)
Finally, we use these estimates along with those that come from the reported deaths contained in the censuses (covering years 1850–1900, inclusive) to produce our final estimates of death probabilities for years 1850–1900. We calculated the convex combination of the back-forecasted death probabilities and the census-derived measure:
 $$\begin{eqnarray}
p_{i0t}^b=&p_{i0t}^{b, census} \beta _t + \hat{p}_{i0t}^{b} (1-\beta _t)
\end{eqnarray}$$
 $$\begin{eqnarray}
p_{i0t}^w=&p_{i0t}^{w, census} \alpha _t + \hat{p}_{i0t}^{w} (1-\alpha _t).
\end{eqnarray}$$
The weights were chosen so as to match the national infant mortality rate reported in Historical Statistics of the United States (2006) for whites 1850–1900, and blacks 1850 & 1900. For whites, we exactly fit the national data, and for blacks we fit 1850 and 1900.Footnote 57 For blacks in the years 1860–1890, inclusive, we log linearly interpolated the weights 1850 and 1900. We report the weight on the Census death measures for whites and blacks over the 1850–1900 period in Table 19.
Black and white infant mortality
For years after 1900 and before the year, the state became a death registration state, we used our forecasted estimates from above, as there are no census reports of deaths to blend. For years 1800(20)–1840 and state i, we used the race specific state i average mortality over 1850–1890. The divisional average probability of dying before age 45 years, middle-age, are graphed in Figures 15 and 16. The divisional average probability of dying before 75 is graphed in Figures 17 and 18. As with infant mortality, and mortality before 15, there has been a powerful decline in mortality risk. Furthermore, there is strong evidence of convergence across census divisions, and across race.
Cohort black and white mortality before 45.
Cohort black and white mortality before 45.
Cohort black and white mortality before 75.
Cohort black and white mortality before 75.
7.2. Black and White Fertility and Schooling
For fertility measures 1890–1990, we used the censuses of 1910, 1940–1990. In these censuses, women were asked how many children were ever born alive to them. The answers were reported by age category, and we focus on the 35–44 ever married group. The averages are also reported for ever married women 45–54 and ever married women 55 and older. We used these latter two categories to produce fertility measures for 1890, 1900, 1920, and 1930. For 2000, we used the 1998, 2000, 2002, and 2004 waves of the CPS that asked children ever born to women 35–44. For years prior to 1890, we used the same procedure detailed in our (2008) paper. A brief description is given below.
7.2.1. Black fertility 1820–1880
For 1820, we have census measures of black children under the age of 16 years. We computed the number of black children 0–15 relative to the number of black women aged 16–44 years, nb 0 − 15. We then assumed that lifetime black fertility in 1820 is given by
 $$\begin{equation}
x_{1820}^b = \frac{n_{0-15}^b}{1-p_{15}^b},
\end{equation}$$
where pb 15 is the probability of dying before the age of 15 years. Given the large probability of dying before age 15 years for blacks in 1820, the average is 40%, with a range of 24.5% and 69%, we assumed that this is a good measure of completed fertility as black women would have continually had children to replace lost children. For example, the black infant mortality rate in 1820 was 280 per 1000 live births.Footnote 58
For years 1830 and 1840, we have census measures of black children under the age of 10 years. We computed the number of black children 0–9 relative to the number of black women aged 16–44 years, nb t, 0, 9. We then assumed that lifetime black fertility in 1830 and 1840 are given by
 $$\begin{equation}
x_{t}^b = \frac{n_{t, 0-9}^b}{1-p_{t,10}^b},
\end{equation}$$
where t = 1830, 1840, and pb t, 10 is the probability of a black child dying before reaching the age of 10 years. Again because infant mortality is so high, 275 and 267 per 1000 live births, respectively, we assume that black mothers are continually replacing children that die. The average probabilities of dying before age 10 years for these years are 38.4% and 37.2%, respectively. Overall for 1820–1840, our measure of black fertility is quite similar to a total fertility rate.Footnote 59
For 1850–1880, inclusive, we use different information to produce a synthetic total fertility rate. In these years, the census provides the number of black children under the age of 1, nb t, 0, and the number of black children between 1 and 4, nb t, 1 − 4, inclusive, relative to the number of black women aged 16–44 years. Thus, to produce our estimate of state black fertility we used
 $$\begin{equation}
x_t^b = 6 \left\lbrace \frac{n_{t,0}^b}{1-p_{t,0}^b} + \frac{n_{t,1-4}^b}{1-p_{t,5}^b} \right\rbrace ,
\end{equation}$$
where pb t, 0 is black infant mortality in the state in year t, and pb t, 5 is the state black probability of dying before age 5 years. Unlike the previous years 1820–1840, we adjust the measure by multiplying by 6. We believe that looking at the much younger cohort of children, ages 0–4 years, is too short a horizon to fully account for total live births per woman. Also, the series fits quite well between the 1820–1840 period and the 1890–1910 period.
7.2.2. White fertility 1800–1880
For whites in years 1800–1840, we used the same procedure as for blacks for 1830–1840. We used census estimates of children under the age of 10 years per white women aged 16–44 years, nw t, 0 − 9, and our estimates of the probability of dying before the age of 10 years, pw t, 10. Thus, our estimate of state white fertility for these years is given by
 $$\begin{equation}
x_{t}^w = \frac{n_{0-9}^w}{1-p_{t,10}^w}.
\end{equation}$$
As with black fertility, we chose not to multiply this value by 3 or 2.Footnote 60 Comparing our estimates for years 1800–1840 shows that this measure is larger than the comparable year total fertility rate estimate from Haines. However, our 1830 and 1840 values are both quite close to his national estimates. In 1830, we are 1.8% higher, and in 1840 we are 2.6% higher. However, in the earliest years, 1800–1820, we exceed Haines estimates by 11.2%, 11.5% and 8.6%, respectively.
For 1850–1880, we followed the same procedure as for blacks. That is we compute a measure of white fertility as
 $$\begin{equation}
x_t^w = 6 \left\lbrace \frac{n_{t,0}^w}{1-p_{t,0}^w} + \frac{n_{t,1-4}^w}{1-p_{t,5}^w} \right\rbrace ,
\end{equation}$$
where nw t, 0 is the number of white children under the age of 1 year relative to the white female population aged 16–44 years, nw t, 1 − 4 is the number of white children between the ages of 1 and 4 years, inclusive, relative to the white female population aged 16–44 years, pw t, 0 is the white infant mortality rate, and pw t, 5 is the white probability of dying before the age of 5 years. Table 20 shows that our fit with Haines national total fertility estimate for whites is quite good. The percent errors for these years for whites are: −2.4%, −0.6%, 4.6%, and 5.4%, respectively. A simple average of these four years produces 4.925 children per woman for our series and 4.855 for Haines.
Black and white fertility
Our fertility measure is total live births for women ever married aged 35 to 44 years in the year reported for years 1890–2000, and are contained in Table 1. For years prior to 1890, our measure is akin to a total fertility rate. For blacks, our 1850 value is very close to the national black estimate from Haines. Our 1860–1880 values are slightly below Haines’ national black estimates. Thus, we feel comfortable that our 1850–1880 procedure, multiplying by 6, is a good approximation to overall total fertility rates for black women in these years. Our estimates for 1820–1840, we also believe are reasonable. The percent error for 1850–1880 between our estimates of black fertility and Haines national black total fertility rates are: −0.3%, −6.0%, −12.4%, −10.1%. The average % deviation is −7.2%. Absent additional information, we are not comfortable multiplying by greater than 6, since for the 1850–1880 period, we are using essentially the relative number of children under the age of 5 years compared with the number of black women aged 16–44 years. Thus, it would seem that we are looking at something like 5 years of completed fertility, at the largest, compared with 30 years of fertile child bearing years. Furthermore, this procedure works well for whites, although, we slightly overestimate white total fertility rates, and this overestimate is rising over time.Footnote 61 The largest discrepancy between our estimates and those from Haines, occur in 1950, 1960, and 1980. These correspond with the Baby Boom years and the Baby Bust year. In 1950, our fertility estimates reach a local minimum: fertility of 2.09 and 2.48 for white and black ever married 35 to 44 women. However, since the Baby Boom begins in 1946, the sharp increase in the hazard rate of births to the younger age cohort, 15–24 years and 25–34 years causes the total fertility rate, reported by Haines, to differ by 0.9 white children, and 1.45 black children. In 1960, our white and black estimates are too low by 1.09 white children and 1.50 black children. The 1980 Baby Bust in Haines’ estimates occur before our estimates return to pre 1960 levels. Thus in 1980, our measures are too large by 0.78 white children and 1.04 black children. Over the entire overlapping years 1890–2000, our children ever born measures are on average 4.6% too high for white fertility and 1.2% too high for black fertility. For the 1800–1880, white fertility period, and 1820–1880 black fertility period, our average deviation from Haines is 4.8% for whites, and −7.2% for blacks. Thus, we feel our black and white fertility measures over the entire period are accurate and reasonable measures of true underlying fertility for blacks and whites.
7.2.3. Black and white schooling
For schooling, we used a similar procedure as Turner, Tamura, Mulholland and Baier (Reference Turner, Tamura, Mulholland and Baier2007) and in our 2008 paper. The only exceptions to this were the assumed age of the children, and also the additional computation of years of schooling prior to 1850. In our earlier paper, we assumed that for a year X cohort of women aged 35–44 years, the children in year X are 6 years old. Thus, we computed expected years of schooling for that birth cohort by adding the enrollment rates (potentially capped at 100%) from year X to year X+18. This assumes that the median mother was 33.5 years old when the children were born. For this paper, we decided to assume the child was 11 years old in year X. Thus, we assumed that the median mother was 28.5 years old when the children were born, which we believe better fits the age distribution of births. For white schooling estimates prior to the 1850 cohort, we used the ten year growth rate of schooling between 1850 and 1860 to back solve for schooling. In rare instances schooling fell between 1850 and 1860, and then we assumed that the growth rate of schooling from 1850–1870 prevailed. For blacks, prior to the end of slavery, we typically assumed that the years of schooling were constant, and equal to their value in 1850.
7.3. Model Fit
Figure 23 shows comparisons of the model solutions for black and white fertility and black and white schooling with the data. The data are displayed as solid lines. State-level solutions, that is allowing (βiRt, νiRt, κRit) to vary by race, R, state, i, and year t, are represented as triangles. Division-level solutions, that is allowing (βDRt, νDRt) to vary by race, census division, D, and year, are represented as smaller squares.Footnote 62 Nation solutions, that is allowing (βRt, νRt) to vary by race and year, are represented as circles.Footnote 63Figures 24–27 contain the data for black and white fertility, black and white schooling by census division. The figures contain the data, as well as the division averages arising from black and white nation preferences, division preferences and state preferences.Footnote 64
EVb κ, CVw κ.
EVw κ, CVb κ.
EVbdeath, CVwdeath.
EVwdeath, CVbdeath.
Cohort black and white fertility and schooling.
Cohort black and white fertility.
Cohort black and white fertility.
Cohort black and white schooling.
Cohort black and white schooling.
Black and white β.
Cohort black and white β.
Black and white ν.
Cohort black and white ν.
Recall Table 6 of the paper presents the goodness of fit of the calibrated nation preference, division preference and state models with respect to black and white national, and divisional fertility and schooling, respectively. Also Table 7 of the paper shows how well the state model fits all observations. Tables 21 and 22 augment these measures of fit, and contain the results of regressions by race of state fertility data against nation and division preference model solution fertility, and state schooling data on nation and division model solution schooling. In each case, we regress the log of the white outcome data on the log of the white model solution, as well as the log of the black outcome data on the log of the black model solution. Table 21 presents the fit with nation, time varying preferences by race, while Table 22 provides the fit for division, time varying preferences by race. In the first column of each table, we regress the data on all years. The next two columns present regression results for the 19th century and the 20th century (2000 included), respectively. The penultimate column contains the pre 1960 years, and the final column contains the 1950–2000 period.Footnote 65 The final row of each panel contains the p-value of the joint hypotheses that β = 1, α = 0. Under nation preferences, the average 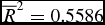 $\overline{R}^2= 0.5586$. For a panel, this is pretty unimpressive. Our fit improves when we allow preference heterogeneity at the division level. The average
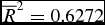 $\overline{R}^2=0.6272$. In the 20 cases, the
 $\overline{R}^2$ increases 16 times. Finally, under state preferences the average
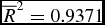 $\overline{R}^2=0.9371$. The weakest fits have
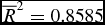 $\overline{R}^2=0.8585$, post 1940 white fertility, and
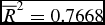 $\overline{R}^2=0.7668$, pre 1900 black fertility. We are certainly able to match the data well, with increasing fit as preferences are allowed more heterogeneity. Schooling is a trended variable, and hence is easier to fit than fertility. Still the overall fit, given by the results in the base column, indicate that the model can replicate the observed fertility data for whites and blacks. There is very little difference in the model’s ability to fit black or white fertility, when preferences are state specific.
Pooled regressions of log actual observations on log model solutions: Nation preferences
Pooled regressions of log actual observations on log model Solutions: Division preferences
8. WELFARE COST ESTIMATES BY DIVISION & ROBUSTNESS
The welfare costs of unequal education access are presented graphically by census division, and race below. The three southern divisions have the highest measured welfare costs.
In Tables 23 and 24, we reproduce welfare cost measures of unequal education access using nation preferences and division preferences. In both cases, the magnitudes of our welfare cost measures are very similar. In Table 25, we show that the correlations are quite high. Recall that two of our measures will be negative under unequal access, and two will be positive under unequal access.Footnote 66 The average absolute value of these correlations is 0.69. The within welfare measure correlation averages, that is looking at the same welfare measure, but varying the level of preference aggregation, are higher. They are: Δb = 0.77; Δw = 0.92; Ωb = 0.77, and Ωw = 0.96. Thus, preference aggregation does not change our estimates of the welfare costs of unequal education access.
Welfare cost of education discrimination, nation preferences (no DC): Black compensating variation − Ωb, white equivalent variation − Ωw, white compensating variation Δw, black equivalent variation Δb (all as proportion of black life time wealth)
Welfare cost of education discrimination, division preferences (no DC): Black compensating variation − Ωb, white equivalent variation − Ωw, white compensating variation Δw, black equivalent variation Δb (all as proportion of black life time wealth)
Correlation of welfare measures
8.1. Mortality Differences
We also present the welfare costs measures of higher mortality risks faced by blacks. Tables 26 and 27 present the welfare costs of higher black mortality by census division and time period. As with our measures of the welfare cost of unequal access to education, these tables show that our measures are robust to preference aggregation.
Welfare cost of differential mortality, nation preferences: Black compensating variation − Ωb, white equivalent variation − Ωw, white compensating variation Δw, black equivalent variation Δb (all as proportion of black life time wealth)
Welfare cost of differential mortality, division preferences: Black compensating variation − Ωb, white equivalent variation − Ωw, white compensating variation Δw, black equivalent variation Δb (all as proportion of black life time wealth)
9. HUMAN CAPITAL AND OUTPUT
Finally, we present empirical estimates of the correlation between our measures of human capital and different measures of state output per worker, permanent income, and earnings. In Table 28 we report the results using Prais–Winsten regressions, correcting for panel serial correlation. These results are quite similar to those of the paper, and hence confirms our view that the model’s time series of black and white human capital are indeed highly correlated with measures of productivity.
Prais–Winsten regressions: ln(y) top panel, gy bottom panel; (standard error)