Introduction
Soil moisture, the amount of water in the soil, has been of great interest in agriculture. It is often expressed as a dimensionless ratio of volume or weight of water to the volume or weight of oven dry soil (Smith, Reference Smith2000). Determining soil moisture levels is highly desirable in farm management as soil water is the single most important resource for pasture production on New Zealand hill country farms (Woodward et al., Reference Woodward, Barker and Zyskowski2001). Hill country is defined as land with slopes greater than 15° and below an altitude of 1000 metres above sea level (Basher et al., Reference Basher, Botha, Dodd, Douglas, Lynn, Marden, Mclvor and Smith2008). Based on this definition, 10 million hectares of New Zealand is considered as hill country and a significant 4 million hectares designated as pastoral hill country farmland in the North Island (Cameron, Reference Cameron2016), making a major annual contribution to the economy (Statistics New Zealand, 2015).
The fact that pasture production is strongly related to the water content of the soil has received early recognition in the hill country (Booth and Gibbs, Reference Booth and Gibbs1969). It has been shown that seasonal deficit and the annual pattern of soil moisture change affect plant growth modelling and decision making in feed and stock management (Bircham and Gillingham, Reference Bircham and Gillingham1986; Bretherton et al., Reference Bretherton, Scotter, Horne and Hedley2011). The specific challenges are the slope and aspect landscape features, which dominate pasture productivity levels, with production declining as slope increases (mainly due to moisture limitations) (Roberts and White, Reference Roberts and White2016). Daily, monthly and annual soil moisture measurements are extremely valuable for the investigation of stored water variability along the rooting zone (Hillel, Reference Hillel1998; Nolz, Reference Nolz2013). However, monitoring hill country soils in traditional ways is an expensive and labour intensive task, therefore, the objective of this study was to deploy a monitoring system using Wireless Sensor Network (WSN) technology for long-term, multi-level soil moisture observations on a hill country farm. One of the objectives of this system is to provide continuous multi-layer information on soil water on pastoral land to assess the response to rainfall events as well as the relationship in soil moisture variability, redistribution, and topographical factors.
Materials and methods
Research site
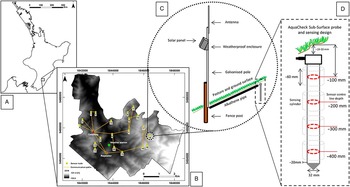
The study was conducted on a 2623 ha hill country property, Pati Tapu Station, located in the Wairarapa region of the North Island of New Zealand (40.745 02 S, 175.88732 E, Fig. 1A). The site was situated within the East Coast hill country area, which was an extensive section of primarily pastoral farmland and forestry on rolling to steep hills, interspersed with flat terraces and fertile plains (Lang, Reference Lang2015). The average annual rainfall was 1127 mm in the broader area and 1050 mm on the study site (NIWA CliFlo database, 1970-2010). The property was classified following the Land Use Capability (Lynn et al ., Reference Lynn, Manderson, Page, Harmsworth, Eyles, Douglas, Mackay and Newsome2009) slope categories and it met the requirements of a typical hill country farm. Elevation ranges from 160-535 m above sea level and the property was equipped with a permanent weather station (Fig. 1B). The sensing sites were selected from pastoral areas where the predominant plant communities are ryegrass species and the probes are placed in soils with silt loam and silty clay loam characteristics.
Research site location (A) and the farm extent are displayed with the deployed WSN architecture and probe ID numbers on a DEM (B). The sensor node design is presented in (C) and the configuration of the probe with the sensing range can be seen on the right (D).

Instrumentation
As water extraction occurs to a depth of at least 350mm in the hill country (Bretherton et al ., Reference Bretherton, Scotter, Horne and Hedley2011), a capacitance-based, 400 mm long AquaCheck Sub-surface Probe (AquaCheck Soil Moisture Management, Durbanville, South Africa) was chosen. It is a robust multi-sensor logging probe, where the internal electronics are fully protected and designed to be completely buried (Fig. 1D). AquaCheck sensors are used to derive soil moisture from frequency-based dielectric measurements (Aquacheck, Reference Aquacheck2008). The probes are connected to firmly protected, long-range telemetry units (Tag I.T Technologies Ltd, Hamilton, New Zealand) for logging and transmitting data. These devices have the capability of gathering sensory information, processing data, generating alerts, scheduling tasks and communicating with other nodes. They have embedded processors, limited memory and the whole unit is operated by batteries recharged by a solar panel. The sensor and radio connection interface board, batteries and wiring are placed in a weatherproof WSN enclosure mounted on a galvanised pole along with a high range, omni-directional antenna (Fig. 1C).
WSN architecture and communication
WSN technology has attracted worldwide interest due to the recent development of micro-electro-mechanical systems and computer technologies. A WSN is composed of a collection of spatially distributed, autonomous devices, called sensor nodes, organised into a cooperative network (Rawat et al ., Reference Rawat, Singh, Chaouchi and Bonnin2014). The nodes can sense and gather information from the targeted environment and communicate local status or conditions to the user (Rawat et al., Reference Rawat, Singh, Chaouchi and Bonnin2014). The advances in WSNs enable better spatial coverage, with a higher temporal resolution of parameters, such as soil moisture, compared to traditional methods (Bogena et al ., Reference Bogena, Herbst, Huisman, Rosenbaum, Weuthen and Vereecken2010).
The WSN architecture consists of a gateway, a repeater station and twenty sensor nodes arrayed in a hybrid topology collecting soil moisture values at four depths (Fig. 1B). The gateway unit provides a connection between a PC-based user platform and the physical world.
The HALO Farm System, an online service developed by Tag I.T is used for monitoring and visualising the data received from the network via an Internet connection. The data packages are passed through underground wires from the sensors to the telemetry units among which the data is transmitted via radio connection until they reach the gateway. The information is uploaded to a server via 3G ensuring near real-time fault alerts and access to the data. The repeater station has a role in extending the coverage area and increasing the number of backup routes. The hybrid structure provides extended range and self-healing, dynamic tree-structured communication with enhanced fault tolerance where the nodes can communicate with every node within radio distance creating numerous alternative paths for stable data transfer. A 1.5 km communication range was taken into account during the design phase.
Geomorphometric analysis
The study of quantitative land-surface analysis or geomorphometry is an analytical-cartographic approach often used as a GIS (Geographic Information Systems)-based application for analysis of the data derived from continuous elevation products (i.e. Digital Elevation Models (DEM)) (Pike, Reference Pike2000). This study used GIS-assisted methodologies to explore potential sensor locations and to design a WSN to effectively monitor soil moisture over a broad range of topographic attributes.
The geomorphometric analysis used an 8 m pixel size DEM derived from 20 m contour lines, obtained from Land Information New Zealand (LINZ). The quantitative comparison of the DEM to higher accuracy ground control points enabled to examine the accuracy of the elevation data set (Fisher and Tate, Reference Fisher and Tate2006). Root Mean Square Error (RMSE) was chosen as vertical error descriptor using 368 ground control points, surveyed by Real Time Kinematic Global Positioning System (RTK-GPS), resulting in an RMSE value of 5.05 m. As compound attributes, the topographic wetness index was calculated (Moore et al., Reference Moore, Grayson and Ladson1991) to avoid possible extremely wet or dry areas and by the construction of topographic position index (Jenness, Reference Jenness2006) a landform classification was performed to identify suitable topographic positions as part of the site selection stage.
Since line-of-sight communication was required between nodes, intervisibility analysis (De Floriani and Magillo, Reference De Floriani and Magillo1999) was applied to determine whether a given node location on the terrain is visible from another potential site within the optimal telemetry range. Following the initial site selection in the office, site visits were carried out. Due to the vertical errors of the DEM, some of the sites had to be shifted to meet the line-of-sight visibility requirement and additional changes were made to accommodate farm management plans.
Statistical analysis and data sets
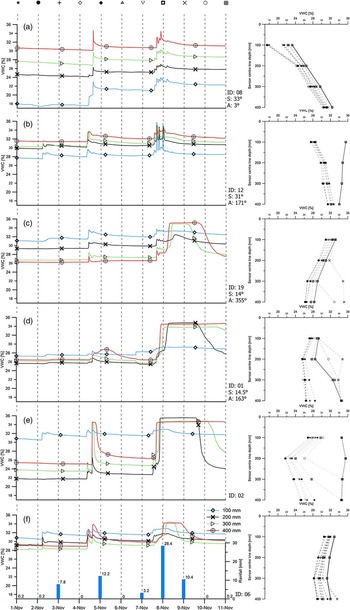
Soil moisture data sets were collected from six sensors between the 1st and 11th of November 2016 receiving a total rainfall of 62.4 mm, representing steep slopes (25–35°), rolling slopes (7–15°) and flat areas (0–3°). Two large precipitation events (total daily rainfall of 12.2 and 28.3 mm) occurred at the time giving the opportunity to examine sensor and soil water response along the profiles in different topographical situations (Fig. 2). In the previous month, there was a total rainfall of 67 mm with largest precipitation event of 11.4 mm occurring on the 10th of October resulting in moderately moist initial soil conditions. Sensor readings from 100, 200, 300 and 400 mm depths were collected with a time interval of 15 minutes and converted to volumetric soil water content (VWC) by means of the respective calibration function provided by the manufacturer. In order to apply the most suitable conversion, soil resource information was derived from a spatial soil database created by the Horizons Regional Council (Landvision Ltd., 2009). The data sets were investigated using univariate descriptive statistical methods frequently used for studying the variability of soil moisture profiles. For each soil layer, the mean soil moisture (mean VWC) and soil moisture variability (expressed by the standard deviation (SD) and the coefficient of variation (CV)) were calculated.
Time series (1-11 November 2016) of rainfall and soil moisture (left) are presented along with moisture profiles (right) on steep sites (a, b), rolling slopes (c, d) and flat areas (e, f). Slope (S) and aspect (A) values are shown below the probe ID in the middle.

Results and discussion
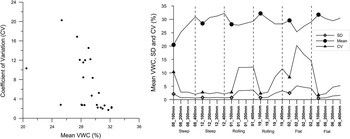
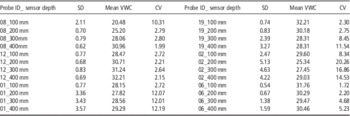
The calculation of descriptive statistical parameters identified the differences among soil water profiles at various topographical positions. The results for six sensor probes (24 sensors) are summarised in Table 1. The largest temporal variability of soil moisture can be found in the data from the flat and rolling areas with a CV up to 20.26%, while the steep slopes show less fluctuation in water content with most CV values in the range of 2–3%. This is partly caused by the upper slope position of the sensor probes and so the smaller upslope contributing areas. On the rolling slopes and flat areas, the 200–400 mm depth showed significantly higher variation than the 100 mm depth. An inverse relationship between soil moisture and CV was found with linearly increasing mean soil moisture as the CV decreases (Fig. 3) which is consistent with previous studies (Korres et al., Reference Korres, Reichenau, Fiener, Koyama, Bogena, Cornelissen, Baatz, Herbst, Diekkrüger, Vereecken and Schneider2015). It indicates that root zone soil moisture tends to have less variation when the soil becomes wetter.
The relationship among mean volumetric water content (VWC), standard deviation (SD) and coefficient of variation (CV) for 24 data sets acquired from six sensor probes.

Descriptive statistics of the 24 data sets collected from six probes (SD-standard deviation, VWC-volumetric water content, CV-coefficient of variation are shown as %).

Slope degree and mean VWC represent another inverse relationship denoting that steep slopes are most likely drier and the soils can hold less water than soils on gentler slopes or flat terrains. The mean soil moisture values at each depth were lower on the north-facing steep slope relative to the levels on the south-facing slope indicating the significant role of aspect controlling the evapotranspiration rates. North-facing slopes typically receive more radiation, therefore, they are generally warmer and drier than south-facing slopes in the southern hemisphere.
On steep slopes, the uppermost sensors showed the lowest moisture content while the bottommost sensor readings were the highest during the monitored period (Figs. 2a, 2b). In contrast, the top layers of rolling and flat surfaces were the wettest until the significant rainfall events (Fig. 2c-f). During this time the lower soil sections reached saturation and exceeded the near-surface moisture content which might be influenced by the contribution of subsurface flows to the increase of the groundwater table. Soil texture and the presence of impervious layers could have a stronger affecting role on water content and storage than slope and aspect in these terrain positions. For instance, a subsoil hardpan, diverting the rainfall, could explain the fast water movements and high peaks at 400mm depth especially on flat areas.
On the steep slopes, with clay loam soil texture, we found rapid water transfer between the top and bottom sensors of the probes with maximum 1–2 hours delay in the sensor to rain response which is most likely caused by bypass flows. The soil water decreased and flattened out rapidly after the first rainfall ceased, suggesting that removal of water due to gravity has slowed down in 12–14 hours and the water level approached the upper limit of field capacity. However, soil moisture decrease by gravitational water removal was slower (>24 hours) after the second major precipitation event on rolling and flat areas due to the higher initial VWC and the larger amount of precipitation (Figs. 2a, 2b).
Summary and conclusions
During this initial phase of the study, a WSN system was deployed for unsupervised, near real-time, in-field soil moisture data collection displayed via a web interface. The system was installed and monitored from the 25th of August 2016. The initial study found that geomorphometry, integrating primary and secondary landscape parameters, are powerful tools for designing and deploying WSNs on large hill country farms. Initial indications are that high-resolution time series of multi-level capacitance-based soil moisture measurements collected by a WSN are valuable for investigating root zone water movements at various parts of a hill country farm. Topography and slope positions exerted significant influences and soil moisture values are more homogenous as the mean soil water content increases. An inverse relationship between mean VWC and slope degree was also observed suggesting that sites on steep slopes receive less water and become drier, most likely resulting in a lower pasture production rates. The probes installed on small plains provided contradicting vertical order in water levels which need to be investigated in the future along the detailed examination of the effect of soil properties over topographical control. Site-specific calibration along with soil sampling will be carried out in the next stage of the study to acquire soil physical information affecting water movements in the rooting zone. Furthermore, monthly pasture growth data are being collected which will be included in the variance analysis. It should be noted that the amount of precipitation is not evenly distributed within the property extent and it needs to be taken into account to achieve a better understanding of the water infiltration rates on farm.
Acknowledgements
The scholarship funding has been provided by Ravensdown and Ministry of Primary Industries (MPI) via the Primary Growth Partnership (PGP – Pioneering to Precision) research project. Moreover, we wish to thank the New Zealand Centre for Precision Agriculture (NZCPA), Agri Optics New Zealand Ltd and TAG I.T Technologies Ltd for providing their collaboration, labour, equipment and technical support during the wireless sensor network deployment stage.