Implications
This paper investigates on large databases from experimental trials the relationships between the milk fat globule (MFG) features (diameter, membrane surface and yield) and milk fat composition. Among 1417 milk samples and a high diversity in terms of MFG size and milk composition, this paper shows that MFGs features are related to fat content, fat : protein ratio, polyunsaturated fatty acids (PUFAs) percentage and calcium contents. It also shows a maximum diameter for native MFGs, related to residual milk in the mammary gland.
Introduction
In dairy cows, milk fat is secreted in the form of spherical entities named MFGs. A MFG corresponds to a core of triglycerides surrounded by a complex MFG membrane (MFGM) originating from both the apical plasma membrane of the lactocyte and the more internal cellular elements (reticulum membrane and cytosolic proteins). In native milk, the number of MFG is around 15×109 MFG/ml and their diameter varies from 0.2 up to 15 µm (Mulder and Walstra, Reference Mulder and Walstra1974). MFGM represents 2% to 6% of the total MFG weight and is about 10 nm thick. It is composed of water (around 12% w/w), phospho- and sphingo-lipids (around 28% w/w), proteins (around 40% w/w) and glycerides (around 20% w/w). This is related to the complex mechanism of milk fat secretion. The percentages of long, unsaturated and odd FAs are higher in the MFGM, in comparison with the MFG core (Evers, Reference Evers2004; Lopez, Reference Lopez2011).
Many studies have shown that the MFG size and MFGM features (structure and composition) can influence milk fat functionalities such as its technological properties (butter yields, index of firmness, fat content of the cheese…), sensory qualities (texture, flavor, moisture, color) and nutritional quality (lipid, FA and protein compositions) (Goudédranche et al., Reference Goudédranche, Fauquant and Maubois2000; O’Mahomy et al., Reference O’Mahomy, Auty and McSweeney2005; Spitsberg, Reference Spitsberg2005; Lopez, Reference Lopez2011; Logan et al., Reference Logan, Leis, Day, Kilhman-Oiseth, Puvanenthiran and Augustin2015). On the other hand, some studies suggest that producing milk naturally modified in terms of MFG size could be possible using factors at the farm scale. By decreasing MFG size, a part of these factors could be used to increase the MFGM concentration in milk fat, and thus its nutritional quality (Logan et al., Reference Logan, Auldist, Greenwood and Day2014). The relevant factors reported in the literature are the diet composition (forage composition, lipid supplementation), the breed or the individual variability. For instance, the average MFG diameter is 0.3 µm lower in Holstein cows (3.3 µm) in comparison with Normandy cows (3.6 µm) (Couvreur and Hurtaud, Reference Couvreur, Hurtaud, Marnet, Faverdin and Peyraud2007; Logan et al., Reference Logan, Auldist, Greenwood and Day2014); in comparison with a maize silage-based diet, it decreases down to 0.3 to 0.4 µm when cows are fed on pasture (3.4 v. 3.1 µm, respectively) or on a supplemented maize silage diet with linseed oil (4.2 v. 3.8 µm, respectively) (Couvreur et al., Reference Couvreur and Hurtaud2006 and Reference Couvreur, Hurtaud, Lopez, Delaby and Peyraud2007; Hurtaud et al., Reference Hurtaud, Faucon, Couvreur and Peyraud2010; Lopez et al., Reference Lopez, Briard-Bion and Ménard2014) and down to −0.2 µm with high-concentrate low-forage diets (Argov-Argaman et al., Reference Argov-Argaman, Mida, Cohen, Visker and Hetting2014). It is modulated by the lactation stage (Mesilati-Stahy and Argov-Argaman, Reference Mesilati-Stahy, Mida and Argov-Argaman2014; Altenhofer et al., Reference Altenhofer, Holzmüller, Wolfertstetter, Wolfschoon-Ribeiro, Kulozik, Pfaffl and Viturro2015). On the other hand, the MFG diameter varies from 2.5 up to 5 µm between cows in the same herd (Couvreur et al., Reference Couvreur, Hurtaud, Lopez, Delaby and Peyraud2007). Those differences in MFG diameters are very well related to the milk fat content and to the unsaturated FAs contents (Rahmatyar and Wiking, Reference Rahmatyar and Wiking2012).
Many studies have been performed to understand the biological processes and mechanisms involved in the MFG formation and secretion in order to explain the effects of farm management factors on MFG size. They have unfortunately not been fully elucidated yet. Triglycerides are synthesized in the reticulum endoplasmic membrane and then released into the cytoplasm in the form of a triglyceride core coated by a monolayer of phospholipids derived from the reticulum membrane, the so-called cytoplasmic lipid droplets (CLD). The droplets grow during their migration to the apical pole of the cell due to the continuation of the synthesis of lipids (Ollivier-Bousquet, Reference Ollivier-Bousquet2002; Heid and Keenan, Reference Heid and Keenan2005; McManaman et al., Reference McManaman, Russell, Schaack, Orlicky and Robenek2007). The secretion would correspond to the membrane enwrapping the CLD and its secretion in association with the exocytosis of the golgi-derived secretory vesicles containing caseins micelles (Wu et al., Reference Wu, Howell, Neville, Yates and McManaman2000; Keenan and Mather, Reference Keenan and Mather2006; Robenek et al., Reference Robenek, Hofnagel, Buers, Lorkowski, Schnoor, Robenek, Heid, Troyer and Severs2006; McManaman et al., Reference McManaman, Russell, Schaack, Orlicky and Robenek2007; Truchet et al., Reference Truchet, Chat and Ollivier-Bousquet2014). According to Heid and Keenan (Reference Heid and Keenan2005), these mechanisms should be regulated but the regulation processes remain hypothetic. Most of the hypotheses are based on small and individual data set (Logan et al., Reference Logan, Auldist, Greenwood and Day2014). Our objectives were to use a large data set to: (i) test if relationships between MFG diameter and milk composition (fat content) shown on small data set are confirmed on larger data set, (ii) identify and compare groups of milks differing in MFG characteristics (diameter and calculated MFGM content and yield) to formulate hypothesis explaining MFG differences between milks. The data set corresponds to the compilation of old data from trials conducted between 2003 and 2011. A large part of the results concerning MFG size from those trials has not been published yet. We created data sets dealing with (i) the effects of the animal (breed, stage of lactation) and its diet, (ii) the milking frequency and (iii) the milking kinetic (cisternal/residual milks). We used all of them to reach our first objective because fat content is highly variable in those trials (from 2% to 15%, thanks to milking frequency and kinetics trials). We only used the ‘diet and animal data set’ to reach our second objective.
Material and methods
Database building
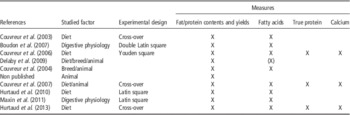
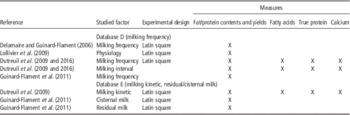
A database was built from experiments in the available data sets developed in the trials performed between 2003 and 2011 in two INRA experimental farms (Tables 1 and 2). The trials dealt with the effects of various factors (diet composition, milking frequency, breed, stage of lactation, parity, residual/cisternal milk) on milk composition (fat, protein, FA) and MFG characteristics (diameter, MFGM surface and yield). The data sets were included in the database when at least milk composition (fat and protein content) and MFG characteristics were reported. This database comprised a total of 21 trials (Table 1). In the database, a row corresponds to an individual milk sample representative of a 1-day milking. For each sample, the information collected was:
-
∙ Dairy cow characteristics: breed, stage of lactation, parity.
-
∙ Experimental conditions: trial, period, feeding treatment (diet, nutrient infusions…).
-
∙ Milking interval: 8, 11, 12, 13, 16, 24, 36 h.
-
∙ Milking characteristics: complete milk, cisternal milk, residual milk.
-
∙ Milk yield (kg/day), fat and protein yields (g/day), fat, protein and lactose contents (g/kg); determined by infrared analysis (Milkoscan; Foss Electric, Hillerød, Denmark).
-
∙ Milk FA composition (% w/w total FA) analyzed by gas chromatography using a GIRA 1600 chromatograph (GIRA, Morlaas, France) (Couvreur et al., Reference Couvreur, Hurtaud, Lopez, Delaby and Peyraud2007).
-
∙ CP composition (g/kg): total nitrogen content, non-protein nitrogen content, non-casein nitrogen content, urea, caseins.
-
∙ Total and colloidal Ca contents (mg/kg) determined by atomic absorption spectrophotometry.
-
∙ MFG characteristics: mean diameter (µm) which was the d 1,0 (Σ (Ni×di)/Σ Ni where Ni=number of MFG with diameter di) measured using a Coulter Multisizer II (Coulter Electronics Limited, Luton, UK). The MFGM surface in milk fat (m2/g) was calculated as follows: S=6×ρ/d 3,2; where ρ is the milk fat volume fraction and d 3,2 the sauter diameter or surface moment mean diameter. Considering the average MFGM thickness (10 nm) and density, MFGM content in milk (mg/kg) and fat (mg/100 g), and MFGM yield (g/day) were calculated.
Description of the experiments used to create the databases A, B and C (diet, animal characteristics, milk composition and milk fat globule characteristics)

The list of references used for the databases A, B and C is given in Supplementary Material S1.
Description of the experiments used to create the database D ‘milking frequency, milk composition and milk fat globule characteristics’ and the database E ‘milking kinetic, residual/cisternal milk, milk composition and milk fat globule characteristics’

The list of references used for the databases D and E is given in Supplementary Material S2.
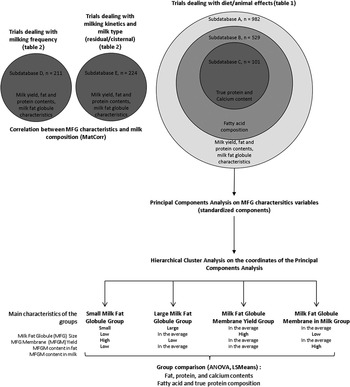
We split our database into several sub-databases (Figure 1):
-
∙ Sub-databases A, B and C grouping the trials dealing with diet (forage type and conservation, lipid supplementation, nutrient ruminal infusion), animal characteristics (breed, stage of lactation, parity, individual variability). These three sub-databases differed in the milk parameters: for the sub-database A=only milk composition and MFG characteristics (n=982); for the sub-database B=parameters from sub-database A plus milk FA composition (n=529); for sub-database C=parameters from sub-databases A and B plus true protein composition and Ca contents (n=101).
-
∙ A sub-database D grouping the trials dealing with milking frequency, milk composition and MFG characteristics (n=211).
-
∙ A sub-database E grouping the trials dealing with milking kinetic, milk type (residual/cisternal), milk composition and MFG characteristics (n=224).
Representation of the strategy developed in the study. Subdatabases A, B and C, composed of data from diet/animal trials, have been used to create four clusters of milk differing on milk fat globule (MFG) characteristics (at the bottom of the figure). These clusters have been compared on milk composition. Subdatabases D and E, composed of data from milking trials, have been used to study the relationships between MFG diameter and milk composition.

Statistical analyses
To partly overcome the limit linked to the presence of atypical data in our database, we opted to exclude the statistical outliers. Data below ‘Q1−1.5× (Q3−Q1)’ or above ‘Q3+1.5×(Q3−Q1)’, where Q1 is the first quartile and Q3 the third quartile, were considered outliers. The outliers data were determined by analyzing the data trial by trial and 1.2% of the samples were excluded in the data set.
Correlation between milk fat globule size and milk fat content (sub-databases A, D and E)
We determined for each data set the coefficients of correlation between MFG characteristics and milk composition variables using the Matcor procedure in the R software.
Clustering of milks in relation to milk fat globule characteristics (sub-database A)
Our objective was to determine if different milk samples selected on MFG characteristics had significant differences in terms of milk composition (fat, protein, FA, Ca). The objective was to create groups of milks based on MFG characteristics and to compare milk composition between these groups. To create the groups, we wanted to have the greatest heterogeneity in our data set. For that reason, we decided not to perform a correction of the effects of the diet/milking frequency/animal characteristics.
First, a principal component analysis (PCA) has been performed on the 982 milks of the sub-database A. The PCA is an important tool to standardize the variables and transform a number of partly correlated variables into a smaller number of uncorrelated variables called principal components. The coordinates of the 982 milks on the principal components were then used to run a hierarchical cluster analysis (HCA) in order to create independent groups of milks.
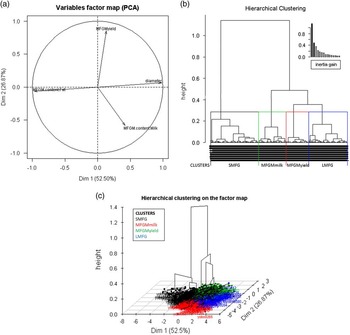
The PCA was implemented on the variables characterizing MFG using ade4 package (acp.dudi procedure) in the R software. The four active variables describing MFG characteristics used in the PCA are MFG diameter, MFGM content in milk and fat, and MFGM yield. The MFGM surface being redundant with other variables, it was excluded from the PCA. The PCA distinguished three components. The percentage of variance for the two first components was 79%, which is high and can be explained by the few number of variables used in the PCA (Figure 2). The first component opposed milk samples composed of small MFG and high MFGM content in fat to milk samples composed of large MFG and low MFGM content in fat (percentage of variance=52%, eigenvalue=2.10). The second component opposed milk samples with high MFGM yield to milk samples with low MFGM yield (percentage of variance=27%, eigenvalue=1.08). Finally, the third component opposed milk samples with a high MFGM content in milk to milk samples with a low MFGM content in milk (percentage of variance=20%, eigenvalue=0.81).
Discrimination of the four clusters of milk according to the hierarchical cluster analysis tree diagram. (a) Factor map representing the four variables used on components 1 and 2. (b) Dendrogram of the hierarchical cluster analysis performed with the coordinates on the three components. (c) Representation of the hierarchical clusters analysis and discriminated clusters on the factor map. PCA=principal component analysis; LMFG=large milk fat globule.

Afterwards, the coordinates on the three PCA components were used to perform a HCA (ade4 package, cah procedure based on ward method, R software) where linkage between groups was chosen as the amalgamation rule. The linkage distance was calculated as the squared Euclidean distance between milk samples. The program identified the cluster which has the minor within-group variance and the greater variance between groups. A milk sample can only belong to one group. The classes of milks obtained were reported in the sub-databases A, B and C.
Group comparison on milk fat globule characteristics and milk composition (sub-databases A, B and C)
Among the classes of milk, the MFG characteristics and the milk composition differences (fat/protein, FA composition, true protein composition, Ca) were evaluated in each database (A, B and C). An ANOVA and mean multiple comparisons with one factor were carried out using the GLM procedure from SAS. Multiple comparisons of the adjusted means (LSMEANS) were done using the PDIFF option of the GLM procedure.
Results
Relationships between milk fat globule diameter and milk composition in the sub-databases A, D and E
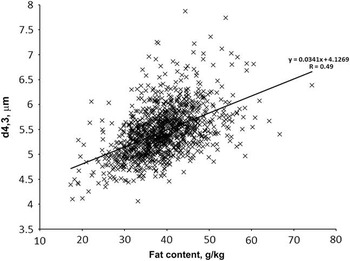
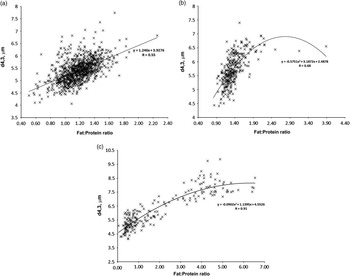
In milks coming from ‘diet and animal trials’, MFG diameter was positively and linearly correlated with milk fat content (Figure 3, R=0.49, n=982) and with fat : protein ratio (Figure 4a, R=0.55, n=982). In milks coming from ‘milking frequency trials’, this positive correlation was curvilinear (Figure 4b, R=0.68, n=211). And in milks coming from ‘residual/cisternal milk trials’, this positive correlation was very high and curvilinear (Figure 4c, R=0.91, n=224).
Relationship between milk fat globule (MFG) diameter (d 4,3) and milk fat content in individual milk samples from database A.

(a) Relationship between milk fat globule (MFG) diameter (d 4,3) and milk fat : protein ratio in individual milk samples from database A (trials presented in Table 1). (b) Relationship between MFG diameter (d 4,3) and milk fat : protein ratio in individual milk samples from database D (trials presented in Table 2). (c) Relationship between MFG diameter (d 4,3) and milk fat : protein ratio in individual milk samples from database E (trials presented in Table 2).

Milk fat globules groups identified (sub-database A)
The HCA performed with the sub-database A created four groups of milk (Figure 2 and Table 3). The main differences between groups were as follow:
-
∙ A group of milk composed by small MFG, with a low MFGM daily yield, a high MFGM content in fat and a low MFGM content in milk (SMFG group, n=343).
-
∙ A group of milk composed by large MFG, with a MFGM daily yield close to the average population, a low MFGM content in fat and a MFGM content in milk close to the average population (LMFG group, n=278).
-
∙ A group of milk composed by MFG with a diameter close to the average population, a high MFGM daily yield, and MFGM contents in fat and milk close to the average population (MFGM yield group, n=161).
-
∙ A group of milk composed by MFG with a diameter close to the average population, a low MFGM daily yield, a MFGM content in fat close to the average population and a high MFGM content in milk (MFGM milk group, n=200).
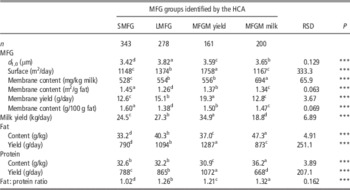
Milk fat globule (MFG) characteristics, milk yield and composition between MFG groups identified in the hierarchical cluster analysis performed with the sub-database A ‘diet and animal characteristics’ (n=982)

HCA=hierarchical cluster analysis; SMFG=group composed by milk samples with small MFG; LMFG=group composed by milk samples with large MFG; MFGM yield=group composed by milk samples with a high MFGM yield; MFGM milk=group composed by milk samples with a high MFGM content; d 1,0=mean MFG diameter.
a,b,c,dDifferences between groups at P<0.05.
***P<0.001.
Milk yield and composition differences between milk fat globule groups
The SMFG group was characterized, in comparison with the others, by a milk yield close to the average population, and low milk fat content, fat yield and fat : protein ratio (Table 3). The LMFG group was close to the average population for milk yield and composition parameters. The MFGM yield group was characterized by a fat content and a fat : protein ratio close to the average population, high milk, fat and protein yields and a low protein content. Finally, MFGM milk group was characterized by the lowest milk and protein yields and by the highest fat content, protein content and fat : protein ratio.
Milk fatty acids profile differences between milk fat globule groups
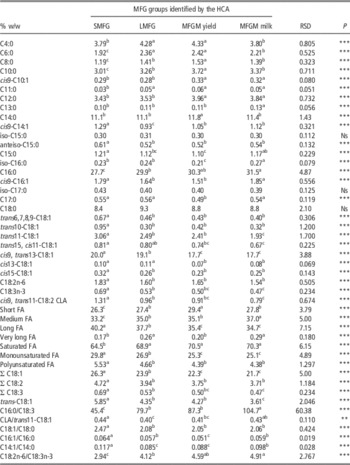
The SMFG group was characterized by the lowest proportion in de novo synthesized FA. On the one hand, we observed, in comparison with other groups, the lowest proportions in saturated fatty acid (SFA), short chain fatty acid (ShFA), medium chain fatty acid (MFA), C4:0, C10:0, C12:0 and C16:0, the highest proportions in monounsaturated fatty acid (MUFA), PUFA (within C18:3-n-3 and c9,t11-C18:2), trans-C18:1 (within t10-C18:1 and t11-C18:1), cis-C18:1 and the highest desaturase activity ratios (Table 4). By contrast, the MFGM yield group was characterized by the highest proportions in de novo synthesized FA, SFA, ShFA and MFA, the lowest proportions in MUFA and PUFA and the lowest desaturase activity ratios. The LMFG group was quite similar to the MFGM yield group. The main difference between these two groups concerned the proportion in cis9-C18:1 which was higher in the LMFG group. Finally, the MFGM milk group was characterized by low proportions in MUFA (mainly cis-C18:1 and trans-C18:1), in very ShFA (C4:0, C6:0) and higher proportions in C16:0.
Milk fatty acid (FA) profile between milk fat globule (MFG) groups identified in the hierarchical cluster analysis performed with the sub-database A ‘diet and animal characteristics’ (n=529)

HCA=hierarchical cluster analysis; SMFG=group composed by milk samples with small MFG; LMFG=group composed by milk samples with large MFG; MFGM yield=group composed by milk samples with a high MFGM yield; MFGM milk=group composed by milk samples with a high MFGM content.
a,b,cDifferences between groups at P<0.05.
**P<0.01, ***P<0.001.
True protein and calcium composition differences between the milk fat globule groups
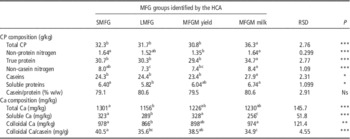
The SMFG group was characterized by the highest Ca contents (total, soluble and colloidal), low protein and casein contents and thus a high colloidal Ca : casein ratio (Table 5). In contrast, the LMFG and MFGM yield groups were characterized by low Ca contents (total, soluble and colloidal), low protein and casein contents and a low colloidal Ca : Casein ratio. Finally, the MFGM milk group was characterized by the highest protein and casein contents and a high colloidal Ca content. There were no difference between groups for the casein : protein ratio.
CP composition and calcium (Ca) content between milk fat globule (MFG) groups identified in the hierarchical cluster analysis performed with the sub-database A ‘diet and animal characteristics’ (n=101)

HCA=hierarchical cluster analysis; SMFG=group composed by milk samples with small MFG; LMFG=group composed by milk samples with large MFG; MFGM yield=group composed by milk samples with a high MFGM yield; MFGM milk=group composed by milk samples with a high MFGM content.
a,b,cDifferences between groups at P<0.05.
*P<0.05, **P<0.01, ***P<0.001.
Discussion
The mechanisms involved in the lipid droplet formation and migration in the cell and in the MFG secretion are not completely understood. The synthesis and secretion of the caseins (via the endoplasmic reticulum – golgi – secretory vesicle axis) and lipids (via the endoplasmic reticulum – CLD – MFG axis) involve joint and independent secretory pathways in lactocytes (Ollivier-Bousquet, Reference Ollivier-Bousquet2002).
In this study, we used individual milks from cows that differed in physiological/hormonal state (breed, stage of lactation, parity), but also in feeding situations (grazing, maize silage, lipid supplementation…). The goal of this analysis was to maintain the broadest diversity of milk samples in terms of milk composition (fat, protein, minerals) and MFG characteristics (measured diameter and calculated MFGM characteristics). By clustering a large population of milk samples according to MFG similarities (diameter, MFGM characteristics), and then comparing the MFG groups on milk composition, our work offers an original approach with very large data sets to study the relationships between MFG characteristics (mainly diameter), milk composition and milk products synthesis and secretion, in comparison with the studies of Couvreur et al. (Reference Couvreur, Hurtaud, Lopez, Delaby and Peyraud2007) and Logan et al. (Reference Logan, Auldist, Greenwood and Day2014). This work made possible to assess the robustness of relationships observed in other studies led on one diet or one breed.
The turnover of plasma membrane: a regulator of milk fat globule diameter?
We have shown a linear relationship between the MFG diameter and milk fat content, whatever the diet and the physiological status of the cow in milk samples representative of a 1-day milking. This relation is in agreement with Wiking et al. (Reference Wiking, Stagsted, Björck and Nielsen2004) and Argov-Argaman et al. (Reference Argov-Argaman, Mida, Cohen, Visker and Hetting2014) and is the major explanation of the MFG diameter variability: SMFG and MFGM yield groups are characterized by the smallest MFG and the lowest fat contents. In comparison with SMFG group, the LMFG group is characterized by larger MFG and a higher fat content. However fat contents significantly differed between MFGM milk and MFGM yield groups even if MFG diameters were close. This result, consistent with Logan et al. (Reference Logan, Auldist, Greenwood and Day2014) may suggest that other MFG diameter regulation mechanisms exist.
The relation observed between MFG diameter and milk fat content remains lower in comparison with other studies. This relation can be explained by the high diversity of milks in our work. For instance, within the Holstein breed (n=713), the relation is similar to other studies: R=0.73 v. R=0.73 in Wiking et al. (Reference Wiking, Stagsted, Björck and Nielsen2004). On the other side, in Normandy breed (n=250), the relation is poor (R=0.32). This result shows that fat content is not always the best factor explaining MFG diameter and that mechanisms explaining MFG size are probably different among breeds.
Different explanations for this link have been put forward. One may be found in the fat secretion processes. MFG secretion requires a high membrane turnover at the apical plasma membrane for the enwrapping of the CLD. Thus, for a fixed amount of fat secreted, the MFG diameter is mainly linked to the membrane turnover (Wiking et al., Reference Wiking, Stagsted, Björck and Nielsen2004; Couvreur and Hurtaud, Reference Couvreur, Hurtaud, Marnet, Faverdin and Peyraud2007; Lopez, Reference Lopez2011). Considering the apical membrane turnover linked to exocytosis secretion of proteins, this hypothesis is supported by the fact that protein and lipid secretion pathways are partially joined (Ollivier-Bousquet, Reference Ollivier-Bousquet2002). In line with this, we found a better relationship between the MFG diameter and the fat : protein ratio than between the MFG diameter and the fat content. Indeed, the fat : protein ratio is a good representation of the balance between protein secretion (and thus membrane turnover) and fat secretion (and thus the membrane use for lipid secretion). Thus, when this ratio is high, the protein secretion may be low in comparison with fat secretion. It may involve a lower membrane turnover which may mean less membrane to enwrap the CLD for milk fat secretion, more time spent by the CLD in the cytoplasm leading to bigger MFG.
We have also shown a curvilinear relation between fat content (or fat : protein ratio) and the MFG diameter in milk samples with very high fat contents (residual milks, up to 70 g/kg) (Figure 4c). Native residual milks are milks known for their extreme fat contents (high) and protein contents (low) (Elliott, Reference Elliott1961). Our results show there is a limit to MFG diameter which has not been shown yet. This may show a physiological threshold in terms of capacity of the membrane to surround very large MFG or a physical threshold linked to the alveoli or lactiferous duct diameters (Dutreuil et al., Reference Dutreuil, Guinard-Flament, Boutinaud and Hurtaud2016).
Differences in fatty acid profile suggest that the intracellular lipid droplets migration pathways may regulate milk fat globule diameter
The milk samples in the SMFG group are richer in unsaturated fatty acid (UFA). This result is in agreement with Timmen and Patton (Reference Timmen and Patton1988), Fauquant et al. (Reference Fauquant, Briard, Leconte and Michalski2005), Rahmatyar and Wiking (Reference Rahmatyar and Wiking2012) and Mesilati-Stahy and Argov-Argaman (Reference Mesilati-Stahy, Mida and Argov-Argaman2014) who have shown that the small MFG, in comparison with the large MFG from the same milk, have higher contents in PUFA, MUFA and lower contents in short SFA (de novo synthesized). This result could be partly linked to the feeding treatments reported in SMFG group (grazing, lipid supplementation mainly) as shown by Couvreur et al. (Reference Couvreur and Hurtaud2006) and Lopez et al. (Reference Lopez, Briard-Bion and Ménard2014) with a pasture-based diet or by Hurtaud et al. (Reference Hurtaud, Faucon, Couvreur and Peyraud2010) with a maize silage-based diet supplemented with extruded linseed. Moreover, FA profile differences between LMFG, MFGM milk and MFGM yield milk are weak. This result does not totally support the linear relationships between MFG diameter and C16:0, C18:0 and C18:1 contents shown by Wiking et al. (Reference Wiking, Stagsted, Björck and Nielsen2004), Gallier et al. (Reference Gallier, Gragson, Jimenez-Flores and Everett2010), Mesilati-Stahy et al. (Reference Mesilati-Stahy and Argov-Argaman2011) and Pisanu et al. (Reference Pisanu, Marogna, Pagnozzi, Piccinini, Leo, Tanca, Roggio, Roggio, Uzzau and Addis2013) in goats. This may be explained by the MFG diameter and MFGM differences between groups not strong enough to exhibit FA profile differences; or by interaction with other factors as, for instance the fat : protein ratio and the apical membrane turnover (see above). Moreover, the MFGM milk group is composed by milk samples mainly produced by local breed dairy cows (Froment du Léon) or dairy cows at the very end of their lactation (up to 300 days). We may speculate a breed-dependent variability in the relative differences in the MFG diameter as proposed by Pisanu et al. (Reference Pisanu, Marogna, Pagnozzi, Piccinini, Leo, Tanca, Roggio, Roggio, Uzzau and Addis2013) in goats and also a different compositional regulation for small and large MFG at different lactation stages (Mesilati-Stahy and Argov-Argaman, Reference Mesilati-Stahy, Mida and Argov-Argaman2014).
Two explanations are often developed to explain the FA profiles differences between small and large MFG. First, milk fat is richer in lipids from the MFGM when the MFG diameter is low (Michalski et al., Reference Michalski, Briard, Michel, Tasson and Poulain2005). The MFGM is known to be richer in long chain fatty acids (LFA) and PUFA than the MFG core (Fauquant et al., Reference Fauquant, Briard, Leconte and Michalski2005). For that reason, it could be expected a higher amount in PUFA and LFA in milk samples containing small MFG (SMFG group in our study). The second explanation is related to the CLD intracellular formation and migration pathways. Pauloin et al. (Reference Pauloin, Chat, Péchoux, Hue-Beauvais, Droineau, Galio, Devinoy and Chanat2010) have shown in mouse mammary epithelial cells that UFA modify CLD proliferation and size and protein synthesis. Timmen and Patton (Reference Timmen and Patton1988) have suggested that the CLD rich in UFA might reach the apical pole of the lactocyte faster than the CLD poor in UFA. In this case, the CLD growth during cell migration would be limited and result in the secretion of smaller MFG. Rahmatyar and Wiking (Reference Rahmatyar and Wiking2012) have proposed that the higher proportion of UFA in CLD might affect its melting point, its fluidity in the cell resulting in a fast covering process during secretion and little droplet fusion during migration.
Recently, studies by Argov-Argaman et al. (Reference Argov-Argaman, Mesilati-Stahy, Magen and Moallem2013 and 2014), Logan et al. (Reference Logan, Auldist, Greenwood and Day2014) and Cohen et al. (Reference Cohen, Shamay and Argov-Argaman2015) have suggested that the phospholipid (PL) to triacylglycerol (TAG) ratio in cytoplasm, linked to diacylglycerol acyltransferase 1 activity, influences MFG diameter. In the PL, phosphatidylethanolamine, when located in the membrane, would play a major role in the process of intracellular fusion of CLD and thereby in MFG diameter (Keenan and Huang, Reference Keenan and Huang1972; Mesilati-Stahy et al., Reference Mesilati-Stahy and Argov-Argaman2011; Argov-Argaman et al., Reference Argov-Argaman, Mesilati-Stahy, Magen and Moallem2013). Thus, when PL : TAG ratio is high, de novo FA content and synthesis are low. A high PL : TAG ratio may also suggest a high membrane turnover and by consequence smaller MFG secreted (Logan et al., Reference Logan, Auldist, Greenwood and Day2014). Cohen et al. (Reference Cohen, Shamay and Argov-Argaman2015) suggested that membrane composition of bovine mammary epithelial cells plays a role in controlling intracellular and secreted lipid droplets size, and that this process is not associated with cellular triglyceride content. In our results, the higher contents of UFA in SMFG milk samples might be linked to higher contents of PL and thereby smaller MFG, in accordance with Lopez et al. (Reference Lopez, Briard-Bion and Ménard2014) and Mesilati-Stahy and Argov-Argaman (Reference Mesilati-Stahy, Mida and Argov-Argaman2014). Nevertheless, in these studies, a decrease in MFG diameter (from −0.15 to 0.7 µm) is related to increases in PL contents between 0.1 and 0.18 mg/100 mg fat and UFA contents between 1.7 and 6.7 g/100 g FA. In our study, we observed a decrease in MFG diameter of 0.89 µm between SMFG and LFMG groups and an increase in UFA of 4 g/100 g FA. This result may suggest that the increase in UFA could only explain a part of the decrease of the MFG diameter related to an higher PL contents.
A study by Valivullah et al. (Reference Valivullah, Bevan, Peat and Keenan1988) in rats and cow mammary cells has suggested that the intracellular content of Ca might influence the CLD fusion process and the MFG diameter. The Ca contents and the colloidal Ca : casein ratio are higher in SMFG milk samples. If Ca contents in milk are related to Ca contents in the cell, our result might confirm the existence of this regulation mechanism of MFG size. Nevertheless, based on our knowledge, no study on the relation between Ca contents in milk and cell has been reported yet.
An implication of the cytoplasmic lipid droplets enwrapping process?
The significant differences observed between groups in true protein composition are strongly related to the differences observed in protein contents. There is no difference in casein : protein ratio between groups. We can hardly suggest explanations for these results. Most of the studies dealing with the effect of the composition of the milk proteins and MFG diameter looked at very specific proteins such as butyrophiline, xanthine oxidoreductase and adipophiline (also known as perilipin-2 or adipose differentiation-related protein) (McManaman et al., Reference McManaman, Russell, Schaack, Orlicky and Robenek2007; Jeong et al., Reference Jeong, Lisinski, Kadegowda, Shin, Wooding, Daniels, Schaack and Mather2013) or proteins involved in lipid synthesis (Cohen et al., Reference Cohen, Shamay and Argov-Argaman2015). These three proteins, by forming a bridge between the CLD membrane and the apical membrane, are involved in the membrane enwrapping process during MFG secretion by budding (Ollivier-Bousquet, Reference Ollivier-Bousquet2002; Jeong et al., Reference Jeong, Lisinski, Kadegowda, Shin, Wooding, Daniels, Schaack and Mather2013) as well as the phosphatidylethanolamine content in the membrane, as mentioned above (Keenan and Huang, Reference Keenan and Huang1972). Our results cannot support these explanations and further work is still needed.
Conclusion
Our work has confirmed in large databases, with a higher diversity of milks than in previous studies, that MFG is related to fat content and UFA percentage. It has highlighted a better relationship between MFG size and fat : protein ratio, in comparison with the well-known relationship between MFG size and fat content. This new relationship might be more appropriate to link MFG size and secretion of milk components. It has shown, in natural milks (residual), a limit to milk globule size. And finally, it has shown that CP composition is not a relevant factor to explain a part of MFG size variability. These relationships could be related to potential regulations of MFG synthesis and secretion, at least to the apical membrane turnover for the CLD enwrapping during MFG secretion by budding and to the proliferation and fusion of CLD during their migration from the basal to the apical region of the mammary epithelial cell. As a part of our data have been calculated (MFGM characteristics), and very small MFG are difficult to measure out, our results must be confirmed by studies dealing with the cellular processes of milk fat and protein secretion in relation to measurements of the MFGM characteristics (composition and contents in milk and milk fat). Those studies could be led in situations in which we observed poor relationships between fat content and MFG diameter (Normandy breed, very end of the lactation).
Acknowledgments
The authors warmly thank Julien Espie for his contribution to the data set building, Eric Chanat for his critical reading of the manuscript and the GALA association for its financial support.
Supplementary Material
For supplementary material/s referred to in this article, please visit http://dx.doi.org/10.1017/S1751731116001646