I. INTRODUCTION
Whether or not a material can exhibit magnetic order at a given temperature is generally dependent on its composition, which is fixed during the synthesis.Reference Cullity1 Quite recently, however, it has been demonstrated that the Curie temperature T C near the surface of dilute magnetic semiconductors, such as (In, Mn)As, can also be shifted by application of an electric field across an insulating gate oxide, similar to the field-induced electrical switching in field-effect transistors.Reference Ohno, Chiba, Matsukura, Omiya, Abe, Dietl, Ohno and Ohtani2 In other words, the spontaneous magnetic order can be switched on or off by the application of an electric field. The underlying effect is a change in the exchange coupling between the dopants that carry the magnetism, which results from the field-induced change in the space-charge density at the surface of the semiconductor. Electric field control of ferromagnetism in semiconductors was initially demonstrated for ordering temperatures around 20 K, and efforts to increase T C—was partly motivated by the strive to explore the possible use of these materials for controlled spin injection at room temperature in spintronics—have so far let to ordering temperatures of up to 1 K.
As some transition metals and their alloys possess considerably higher ordering temperatures and magnetization than magnetic semiconductors, it would be exciting to achieve reversible control of ferromagnetic order in metals as well. However, the notion of a field-effect type experiment in a metal is unconventional, since the efficient electronic screening in metals restricts space charge layers to a practically thin atomic layer at the metal surface, versus hundreds or thousands of lattice constants in semiconductors.Reference Gleiter3 Owing to their small volume, space-charge layers in metals might be expected to have only negligible influence on the materials properties; field-effect experiments with metals would then be of little practical interest. Yet, it has been pointed out recentlyReference Gleiter3,Reference Weissmüller, Viswanath, Kramer, Zimmer, Würschum and Gleiter4 that the situation may change when the number of surfaces is maximized by reduction of the scale of the microstructure to the nanometer-regime. Thus, it was demonstrated that the controlled variation of the surface charge in nanoporous PtReference Weissmüller, Viswanath, Kramer, Zimmer, Würschum and Gleiter4 and AuReference Biener, Wittstock, Zepeda-Ruiz, Biener, Zielasek, Kramer, Viswanath, Weissmüller, Bäumer and Hamza5 allows us to modify the bonding in the metal surface reversibly, thereby inducing a reversible macroscopic strain (elastic) comparable in magnitude to the maximum strain which can be achieved with commercial piezoceramics. The measurement even provided broad perspective to tune surface stress,Reference Haiss6 relaxation,Reference Nichols, Nouar, Lucas, Haiss and Hofer7 and optical response of carbon nanotubesReference Kavan, Rapta, Dunsch, Bronikowski, Willis and Smalley8 by electrochemical charging. Here, we present experimental results which show that a similar set up allows the magnetic order of a transition metal alloy to be reversibly manipulated.
According to Hunds rules, full bands do not exhibit a magnetic moment; this is apparent when the band occupancy is varied by alloying, as exemplified in the empirical relation known as the Bethe–Slater curve.Reference Cullity1 For instance, the magnetic moment of Ni decreases continuously, and it finally vanishes when the empty states in the d-band are gradually filled up by alloying with Cu.Reference Bozorth9 Besides the existence of a magnetic moment, ferromagnetic ordering depends on the alignment of neighboring spins by the exchange interaction. According to the Stoner equation, appreciable values of the exchange integral require large values of the electronic density of states at the Fermi level. It is this relation between magnetism and band occupancy, which suggests that the magnetism of transition metals can be manipulated by tuning the electron density in superficial space charge layers.Reference Gleiter3
Until now, aprotic (organic) electrolytes are common for electrochemical charging near the Helmholtz double layer, minimizing adsorption/desorption phenomena at the metal surface.Reference Baughman, Cui, Zakhidov, Iqbal, Barisci, Spinks, Wallace, Mazzoldi, Rossi, Rinzler, Jaschinski, Roth and Kertesz10 This brings into observation charge-dependent variation of stress,Reference Haiss6 strain,Reference Biener, Wittstock, Zepeda-Ruiz, Biener, Zielasek, Kramer, Viswanath, Weissmüller, Bäumer and Hamza5 opticalReference Mishra, Bansal and Hahn11 or electrical resistanceReference Sagmeister, Brossmann, Landgraf and Würschum12 up to 1%, to the maximum change in the mass-magnetizationReference Lemier, Ghosh and Weissmueller13–Reference Mishra, Bansal, Ghafari, Kruk and Hahn16 of 3% in the transition metal alloys, indicating that electric-field-controlled magnetism in nanoporous matter is still limiting. To improve functionality leading to switchable ferromagnet, the present work may use an aqueous medium (inorganic) with high charge carrier density polarizing the metal surfaces. This however may not exclude surface specific adsorption with porous aggregates of chained nanoparticles immersed in 1-M KOH solution.Reference Grdeń, Czerwinski, Golimowski, Bulska, Krasnodebska-Ostrega, Marassi and Zamponi17–Reference Grdeń, Klimek and Czerwiński19 The present work would devise a set up, mounting an electrochemical cell inside an extraction magnetometer, as the intention is to see the charge response of magnetization in a nanoporous Pd–Ni alloy in situ.
II. EXPERIMENTAL INFORMATION
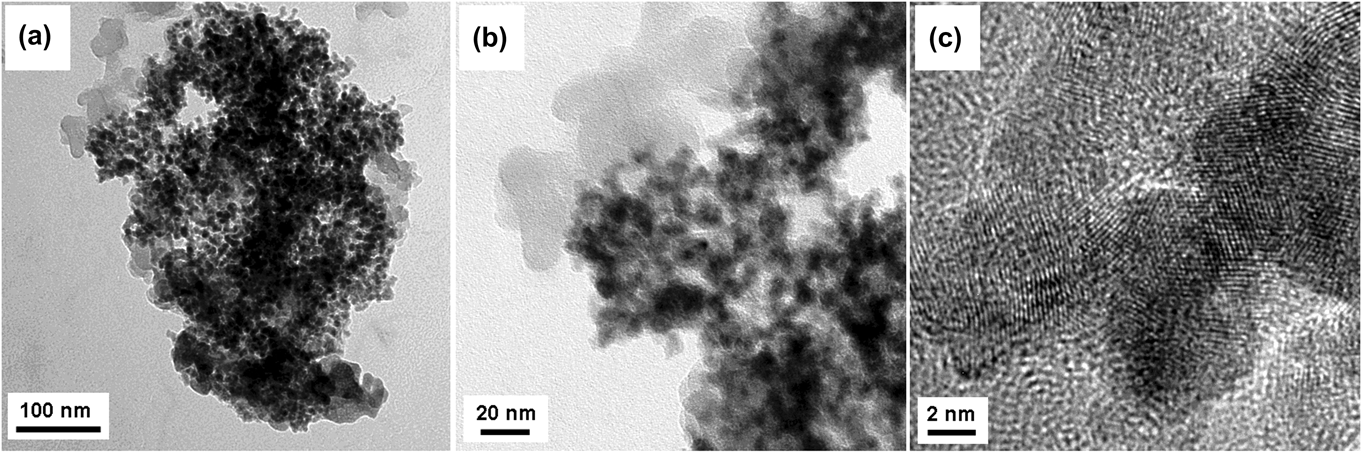
The Pd–Ni alloy particles used in the study were produced by the inert-gas condensation technique: metal vapor evaporated thermally from the molten Pd–Ni alloy in an ultrahigh vacuum system (10−8 mbar) backfilled with an inert-gas atmosphere forms a fume of nanoparticles suspended in the gas.Reference Gleiter20 The particles form loose agglomerates, see the transmission electron microscopy (TEM) image in Fig. 1(a), which were collected on a liquid nitrogen cooled surface. The loosely agglomerated nanoparticles were consolidated at a pressure of around 100 MPa, yielding 3 × 0.5 mm (diameter × thickness) porous disks of density ∼2.3 g/cm3, which corresponds to about 20% of the bulk density.
Bright-field TEM image of the sample, showing (a, b) agglomerated nanoparticles with (c) crystalline lattice fringes.

Composition analysis was done by the analysis of energy dispersive x-ray fluorescence (EDX). X-ray diffraction was performed in Bragg–Brentano geometry using Cu Kα radiation (λ = 1.54 Å) in a Philips Analytical X'Pert diffractometer (Almelo, Netherlands). A mean grain size was determined by analysis of the integral breadth of the Bragg reflections, after correcting for instrumental broadening and separating size- and strain-induced broadening by the method of Klug and Alexander,Reference Klug and Alexander21 assuming Cauchy size and Gaussian strain broadening. The diffraction maxima were fitted with Pearson VII function using the Profit software to obtain the integral width of the Bragg reflection. The lattice constant was calculated from the Bragg's reflection using Nelson–Riley function, for a face centered cubic crystal. The microstructural characterization of the sample was done by TEM (Philips FEI Tecnai F20ST field-emission gun-TEM, Eindhoven, Netherlands) operated at 200 kV. For this, agglomerated nanoparticles [Fig. 1(a)] were dispersed by ultrasonic vibration in ethanol medium which on evaporation, the dry powder, were sprinkled on a fine copper grid for the TEM study. Magnetic characterization of the samples was carried out using quantum design physical property measurement system (PPMS) and VSM for AC and DC measurements, respectively. Electrochemical charging was carried out in a potentiostat (PGSTAT10, Eco Chemie, Utrecht, Netherlands), using the sample as a working electrode in 1-M KOH solution at a potential sweep rate of 0.25 mV/s.
For in situ operation of charging inside an extraction magnetometer (PPMS), a custom-built miniaturized glass cell was fabricated, as shown schematically in Fig. 2. The concentric arrangement has the sample as the working electrode, porous carbon cloth (Kynol) as the counter cum reference electrode as both are immersed in 1-M KOH solution, yet separated by a section of a clear transparent drinking straw and Teflon membrane. The outer wall of the cell is thin-walled fused silica, with an outer diameter of 6 mm, the bottom being sealed by Teflon plugs to avoid evaporation of the electrolyte. Thin gold wires (diameter 0.127 mm) serve as interconnects with a potentiostat, which is operated in 2-electrode mode at controlled potential during the in situ experiment. The glass tube was mounted to the sample holder via a drinking straw coupling between these two. After magnetometer sample-space housing, the cell was exposed to the flow of boil-off He from the cryostat, preventing the contamination of the cell.
The schematic arrangement of the electrochemical glass cell, showing arrangement of the potentiostat and magnetometer for the in situ measurement of the mass-magnetization during charging.
III. RESULTS
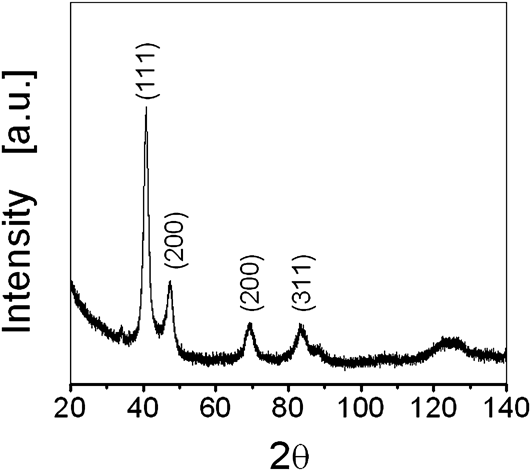
The sample used in the current study had the composition Pd67Ni33 with maximum variation of 2%, as determined by EDX attached to a scanning electron microscope (SEM, LEO 1530). Figure 3 shows the characteristic x-ray diffraction pattern and the highest intensity peak, corresponding to (111) reflection of an fcc structure with a lattice parameter, a = 3.79 Å. The value lies between those of pure Pd (3.88 Å) and Ni (3.52 Å), confirming formation of an alloy.Reference Campesi, Cuevas, Leroy, Hirscher, Gadiou, Vix-Guterl and Latroche22 The average particle size is estimated to be  ${\left\langle D \right\rangle _{\rm{A}}}$ = 6 ± 2 nm, which is in agreement with TEM analysis of the sample in Fig. 1(b). Again, high-resolution image of the microstructure evolution in Fig. 1(c) reveals that the samples prepared by thermal evaporation in inert gas condensation technique are crystalline, as lattice fringes corresponding to crystalline planes are clearer and no trace of oxide layer (amorphous) can be seen.
The powder x-ray diffraction pattern of the sample, showing crystalline peaks corresponding to the fcc lattice of the Pd–Ni alloy sample.
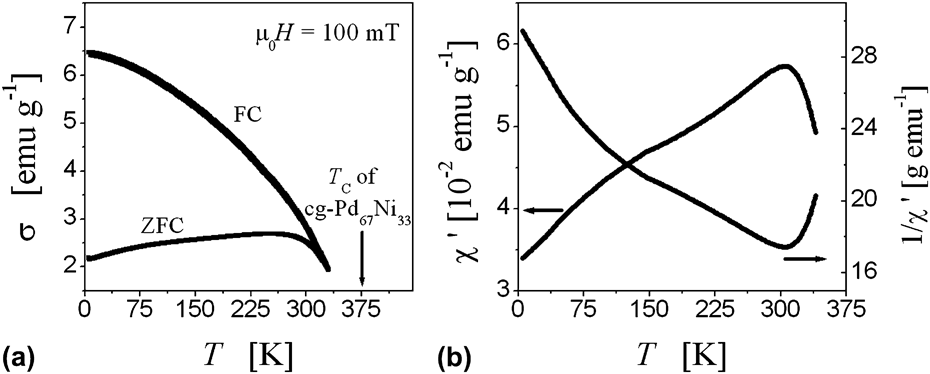
Figure 4(a) exhibits temperature-driven mass-specific magnetization, σ(T) at the applied magnetic field µ0H = 100 mT under field (FC) and zero-field (ZFC) condition of cooling. By extrapolation of the σ(T) curves, a magnetic ordering temperature between 350 and 400 K may be estimated. This agrees with the published dataReference Ferrando, Segnan and Schindler23 for coarse-grained counterpart, which is about 375 K for Pd67Ni33. The temperature scan plotting of the AC susceptibility from 5 to 340 K shows that the susceptibility increases with temperature with a possible maximum in Fig. 4(b), though inverse of the AC susceptibility is curved within the accessible temperature range, suggesting that at all temperatures studied, the sample is ferro- as opposed to superparamagnetic nature of the particle due to multiply branched contiguous chains of nanoparticles interconnected by metallic grain boundaries.Reference Gleiter20 The measurement is further corroborated by magnetization isotherms in Fig. 5, displaying a small finite coercive field µ0H C = 17.3 mT at 300 K and also at 5 K to be soft ferromagnetic.
Temperature (T) dependent (a) FC–ZFC curves, and (b) AC-susceptibility (χ′) showing ferromagnetic nature of the sample as 1/χ′ versus T is not linear.
Magnetization isotherms of the sample at 5 and 300 K, showing that agglomerated nanoparticles are soft ferromagnetic in nature, as evident by a small finite coercive field at the inset zoom image.
The in situ measurements of the magnetization behavior were conducted at room temperature (T = 300 K) keeping the magnetic field constant. The higher temperature causes electrolyte evaporation, and at lower temperature, low charge accumulation on the metal surfaces is probable. Thus, maintaining an isothermal condition for electrochemical cell under DC magnetic field (µ0H = 10 mT), the applied voltage, E, was scanned from negative to positive potential range at a potential sweep rate of 0.25 mV/s. The slow scan rate is expected to reveal metal–electrolyte response in detail. For consistency, each measurement was extended up to five consecutive cycles, coupling magnetometry with cyclic voltammetry data of E versus I (current) for detailed analysis over a specific period of time. The net charge, ∆Q, accumulated on the sample surfaces, was estimated by integrating current over time varying the potential (E).
Figure 6 shows results of the in situ measurements as ∆E is varied from negative to positive potential regime, producing cyclic voltammograms. Simultaneously, the net charge ∆Q accumulated on the sample surface is also included in the study. Comparing Figs. 6(a)–6(c) for ΔE within 0.3 V, it is seen that relative variation of mass-magnetization σ with potential E transient (on top) is negligible, besides M versus ΔQ is linear as if ΔQ has negligible impact on magnetization. Further, to increase ΔE at larger “negative” E, Fig. 6(d) indeed exhibits tunable variation of magnetization (σ) in phase with the applied potential. The peak-to-peak amplitude of the change (Δσ/σ) is estimated to be 2.56%. The variation in Fig. 6(e) is such that electron insertion (at negative potentials) decreases the magnetization (M) substantially. It is despite the fact that M versus ΔQ deviated a bit from linearity—with two different slopes, suggesting that more than one reaction kinetics is involved. As an example, Fig. 6(e) indicates that the deviation (change in the slope) was particular near −0.4 V, marked as the onset of the noise formation in the cyclic voltammogram of Fig. 6(f) by gas bubble formation in response to the applied E; as measured ex situ. Admittedly, such a trend generating noise in the cyclic voltammogram remained insensitive to the magnetization data, until ΔE is further raised at larger negative E expecting even larger variation in σ.
Result of the in situ measurements, showing reversible variation (d, g, j) of mass magnetization σ with time, as applied voltage (E) is increased progressively at the larger negative, E. Also included, is the corresponding charge (ΔQ) dependence of the magnetization M (b, e, h, k), through cyclic voltametry study (c, f, i, l) of E versus I (current).
As E was increased negatively to −1.5 V, Fig. 6(g) measured Δσ/σ ≈ 19.9%. It signifies that the change may be large, though M versus ΔQ deviated sharply from linearity [Fig. 6(h)]. A possible reason is the irreversible charge transfer kinetics which is evident by the net loss of ΔQ in Fig. 6(i). Further, to increase E negatively, at −1.8 V, the relative variation in the magnetization Δσ/σ is to be the maximum at 24.6% in Fig. 6(j), but increased gas flow disrupted electrochemical measurements by electrolyte evaporation in Fig. 6(l). Thus, measurements were concluded for analysis without damaging the cell.
IV. DISCUSSIONS
The present work successfully demonstrates that the magnetic order in metals can be manipulated significantly by tuning the electrode potential substantially, which is in good agreement with the speculation in Ref. Reference Gleiter3. To understand the microscopic behavior of the mechanism, involving metal–electrolyte interaction, the discussion will continue.
The change of magnetization as observed in the present study is from the aggregate of nanoparticles compressed in the form of porous disk. Assuming that the sample consists of spherical particles with a grain size of about 8 nm and that the expected Thomas–Fermi screening lengthReference Gleiter3 for metals is around 1 Å, it turns out that roughly 7% of the total surface atoms in volume fraction would be affected overall.Reference Ghosh15 The resulting change in magnetization would be Δσ/σ ≈ 1–2% as reported earlier in Pd–Ni alloy and coupled with it a linear variation of M versus ΔQ.Reference Ghosh, Lemier and Weissmüller14–Reference Mishra, Bansal, Ghafari, Kruk and Hahn16 In contrast, the present experiment measured Δσ/σ ≈ 25%; the magnitude may be too large to speculate the contribution of surface alone rather than the bulk. The notion is to be validated by the net loss of charge (ΔQ) penetrating into the bulk. This brings into effect irreversible charge transfer kinetics by chemical reactivity under study.
Previously, experiments performed with Pd–Ni alloy as a working electrode in 1-M KOH solution (aqueous) confirmed hydrogen adsorption at the negative potential region where a large change in the magnetization pertaining to reversible behavior has been observed.Reference Grdeń, Czerwinski, Golimowski, Bulska, Krasnodebska-Ostrega, Marassi and Zamponi17,Reference Grdeń, Kusmierczyk and Czerwiński18 On the other hand, at the “positive” potential regime, OH− adsorption is known, leading to oxidation of the metal surface.Reference Grdeń, Klimek and Czerwiński19 Since Ni is less noble than Pd, the tendency to oxidize increases with Ni concentration in the alloy.Reference Grdeń, Klimek and Czerwiński19 To find conformity, the zoom image of Fig. 6(j) observed a small reduction in magnetization at positive E. It resembles splits in the magnetization curve as appeared during each charging cycle, reportedlyReference Grdeń, Klimek and Czerwiński19 due to the formation of NiO in Fig. 7. Since NiO is an antiferromagnetReference Kodama and Berkowitz24 with a high ordering temperature (strong antiferromagnetic coupling), the formation of a superficial oxide at positive E may reduce the magnetization considerably. On the other hand, the observed change in magnetization is mainly at negative E of the hydrogen adsorption regime for which discussion will continue.
An exemplary zoom image of Fig. 6(j), showing a downward split to indicate reduction in the magnetization σ at the positive, E.
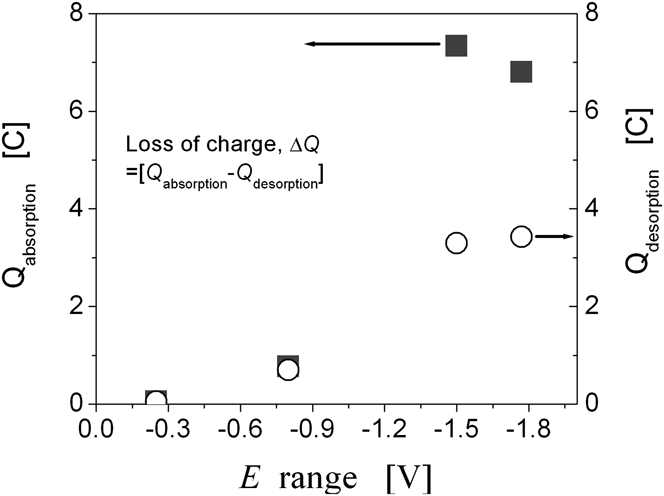
Incorporation of hydrogen in the Pd lattice is known to reduce the susceptibility, as empty states in the d-band can be filled by hydrogen donating its electrons.Reference Biggs25,Reference Svensson26 The present experiment may find an analogy, keeping in mind that solubility of hydrogen in Pd–Ni is limiting, so dissolution of hydrogen from the alloy is feasible.Reference Ke, Kramer and Løvvik27 As an example, Fig. 6(f) indicates that the plot of E versus ΔQ is closed within smaller ∆E, meaning an equilibrium condition may be established by hydrogen adsorption equaling the desorption rate. As ∆E is increased negatively, the adsorption rate is higher than desorption due to larger potential window and hence higher energy is involved, leading to a net loss of charge in Figs. 6(i) and 6(l). This agrees with the fact that certain fraction of hydrogen incorporation is possible by the fcc lattice of a Pd–Ni alloy due to interstitial sites available.Reference Raffy, Dumoulin and Burger28Figure 8 measured it quantitatively such that the net loss of the charge may be accounted for the overall absorption in each cycle, for which thermodynamic criterion needs to be invoked.
Electrochemical measurement showing net loss of charge ∆Q increases at the larger negative E, based on the integration of charge ∆Q at various ∆E, using the cyclic voltammetry data of Fig. 6.
Solubility of hydrogen in Pd is relatively higher than in Ni, which otherwise requires large pressure to form NiH.Reference Crespo, Ruda and Debiaggi29 A comparison based on Pd versus Pd–Ni alloy computedReference Ke, Kramer and Løvvik27 that absorption energy per H atom of pure Pd is −0.126 eV compared to −0.015 eV for Pd33Ni67, meaning lower stability of hydrogen in the Pd–Ni alloy until a larger ∆E is applied. Nevertheless, hydrogen incorporated so, may be located at the surface and subsurface layers of the nanoparticles, as octahedral voids of the fcc lattice are preferred over relatively smaller-sized tetrahedral.Reference Raffy, Dumoulin and Burger28–Reference Kurokova, Nakayama, Kobayashi, Suzuki, Takahashi, Takami, Kubo, Itoh, Selvam and Miyamoto30 This causes the lattice to expand by the change in the lattice parameter nearly about 1.8% in Pd33Ni67Reference Ke, Kramer and Løvvik27: multiplying which with the bulk modulus, K ≈ 180 Gpa, yielded strain-induced pressure (P = 3εK) to be 9.72 GPaReference Grdeń, Kusmierczyk and Czerwiński18,Reference Raffy, Dumoulin and Burger28
Pressure dependence of magnetism in Pd–Ni alloys is well known over decades attributed to hybridization effect between 1s electrons of hydrogen and 3d metals. This can affect magnetization.Reference Beille and Chouteau31–Reference Gelatt, Ehrenreich and Weiss33 In addition to that, if the lattice expanded by hydrostatic pressure, widening of the d-band is also possible.Reference Mathon34,Reference Das, Koelling and Mueller35 The Fermi level may go up, reducing the total number of the empty electronic density of the states in the d-band to reduce mass-magnetization as observed in the present study. Further commenting on the fact, a similar experiment by hydrogen gas charging/discharging found an enhancement of coercivity in a Pd–Ni alloy along certain directionality because the constraint is imposed by a thin film with the substrate in other directionality.Reference Raffy, Dumoulin and Burger28 In contrast, wetted nanoparticles of the porous aggregate in the present study are free to translate strain or strain-induced pressure in any direction, resulting in macroscopic variation of the mass-magnetization as a volumetric effect.
V. CONCLUSION
The present work demonstrates reversible variation of magnetization in nanoporous Pd67Ni33 alloy by continuous charging and discharging of the sample as working electrode in 1-M KOH solution. The electrolyte being aqueous, it is expected that electrodissociation of the water molecule is possible, coupling hydrogen at negative E for the large change in the magnetization. On the other hand, at positive E, the change is negligible by the antiferromagnetic oxide layer, which can passivate the metal surface. Thus, cycling applied voltage toward more negative E may bring into effect reversible variation of the mass-magnetization, maximally up to 24.6%. The aforesaid experiments concerned strain or strain-induced pressure as the key effect by hydrogenation. The concept related to magnetoelastic response in the nanoporous Pd–Ni alloy may be exploited as the future switchable ferromagnet at room temperature.
ACKNOWLEDGMENTS
The author is greatly indebted to Dr. Joerg Weissmueller and Dr. Christian Lemier for extended support to this work and Mr. Torsten Scherer for the EDX analysis of the samples. Financial support from the Center for Functional Nanostructures (CFN), Karlsruhe is also acknowledged.