

Recent studies have documented that the judicialization of politics is becoming increasingly common in many parts of the world. As a consequence, judges in many countries are becoming involved in the resolution of important policy conflicts, and studies often suggest that the judges on top courts are rational actors concerned with the policy consequences of their decisions (Tate Reference Tate1972; Tate and Sittiwong Reference Tate and Sittiwong1989; Tate and Vallinder Reference Tate and Vallinder1995; Ackerman Reference Ackerman1997; Epp Reference Epp1998; Robertson Reference Robertson1998; Ginsburg Reference Ginsburg2003; Ostberg and Wetstein Reference Ostberg and Wetstein2007). If judges are rational actors who care deeply about the policy consequences of their decisions, they may be expected to give serious consideration to the ways in which the timing of their retirement may advance their political goals. In addition to the presence of policy-oriented judges, strategic retirement requires a substantial degree of judicial independence, and that independence is typically found in countries that have experienced the judicialization of politics. Thus, throughout the common-law world, judges on the top appellate courts are guaranteed either lifetime tenure or secure tenure until they reach an age specified by statute (usually either 70 or 75). Yet, though judges may not be removed by those outside the courts for political reasons, they may time their own retirements to advance either their own partisan or policy preferences. In the analysis below, we investigate whether such strategic political concerns affect the retirement decisions of justices on the top courts of Canada and the United Kingdom.
A number of studies concerning courts in the United States have investigated patterns of retirement by federal judges to determine if those decisions reflected some form of strategic behavior (e.g., Barrow and Zuk Reference Barrow and Zuk1990; Hagle Reference Hagle1993; Spriggs and Wahlbeck Reference Spriggs and Wahlbeck1995; Brenner Reference Brenner1999; Nixon and Haskin Reference Nixon and Haskin2000; Ward Reference Ward2003; Hansford, Savchak, and Songer Reference Hansford, Savchak and Songer2010). While the findings are somewhat mixed, it appears that judges on policy-making courts in the United States sometimes engage in strategic decisions to time their departures so that like-minded and/or same-party replacements will be named. Unfortunately, there is almost no evidence whether judges outside the United States leave their courts for strategic political reasons. The study of the retirement decisions of judges on the top courts of Canada and the United Kingdom provides a useful first step for evaluating the extent to which the findings of strategic retirement in the United States are the norm for policy-oriented judges in other parts of the world because of the crucial similarities in important institutional characteristics of Canadian and UK courts compared to their US counterparts.
The timing of retirement to advance political goals may be assumed to be most likely in those countries in which the top courts play a significant role in policy making and in which there is evidence that the personal political preferences of the justices influence their decisions. In much of the common-law world (and in a number of countries evolving from other legal traditions), both of these conditions are met (see Tate Reference Tate1972; Galligan Reference Galligan1987; Jackson and Tate Reference Jackson and Tate1992; Tate and Vallinder Reference Tate and Vallinder1995; Epp Reference Epp1998; Hausegger and Haynie Reference Hausegger and Haynie2003; Haynie Reference Haynie2003). It is clear that both conditions are met in Canada and the United Kingdom (Barr Reference Baar, Waltman and Holland1988; Tate and Sittiwong Reference Tate and Sittiwong1989; Brodie Reference Brodie2002; Ostberg and Wetstein Reference Ostberg and Wetstein2007; Songer Reference Songer2008; Songer et al. Reference Songer, Johnson, Ostberg and Wetstein2012). Thus, Canada and the United Kingdom provide good case studies to assess whether the strategic timing of retirement is a consistent feature of courts with a substantial ideological dimension of decision making.
The presence of ideological decision making on appellate courts has sparked much of the interest in the possibility of strategically timed departures. This possibility becomes enhanced when judges preside over courts that possess four institutional features: control of the docket, a court of last resort with no further appeal available, judicial independence, and lack of ambition for higher office (Segal and Spaeth 2002). Both the Supreme Court of Canada and the law lords of the United Kingdom now share all four of these institutional features, making them strong potential candidates for ideological decision making and thus the incentive for judges to time their retirements strategically to advance their political interests. And in fact, extensive empirical evidence indicates that the political preferences of the justices exert a substantial influence on their voting behavior in the divided decisions of the top courts in both Canada and the United Kingdom (see Peck Reference Peck, Schubert and Danelski1969; Robertson Reference Robertson1982, Reference Robertson1998; Tate and Sittiwong Reference Tate and Sittiwong1989; Heard Reference Heard1991; Ostberg, Wetstein, and Ducat Reference Ostberg, Wetstein and Ducat2002; Ostberg and Wetstein Reference Ostberg and Wetstein2007; Songer and Johnson Reference Songer and Johnson2007; Songer Reference Songer2008; Songer et al. Reference Songer, Johnson, Ostberg and Wetstein2012).
In all three countries, differences in political preference and ideology fall roughly along party lines, with the Democratic Party (United States), Labour Party (United Kingdom), and Liberal Party (Canada) situated to the left of the Republican, Conservative, and Progressive Conservative Parties, respectively. Similarly, a number of studies of voting on the Supreme Court of Canada demonstrate that the party of the appointing prime minister both is correlated to a significant degree with other measures of judicial ideology and is one of the best predictors of ideological voting (Tate and Sittiwong Reference Tate and Sittiwong1989; Ostberg and Wetstein Reference Ostberg and Wetstein2007; Songer and Johnson Reference Songer and Johnson2007; Songer Reference Songer2008; Songer et al. Reference Songer, Johnson, Ostberg and Wetstein2012).
Two of the key institutional features that support ideological voting, judicial independence and lack of ambition for higher office, have been characteristic features of the top courts of Canada and the United Kingdom for at least a century. However, the other two institutional features developed later. Docket control was not enjoyed by the top court in the United Kingdom until 1934 and came to the Supreme Court of Canada in 1975. Additionally, the Supreme Court of Canada did not become a court of last resort until appeals to the Privy Council were abolished in 1949. Thus, examination of retirement decisions in the top courts in Canada and the United Kingdom can shed light on the extent to which the likelihood of strategic retirement is conditioned by the presence of all four institutional features that Segal and Spaeth assert are critical for ideological voting.
The top courts in the United Kingdom and Canada share other institutional features that make them an appropriate place to test the theories of strategic retirement developed in the United States. Commonalities between the US Supreme Court and these two international counterparts include generous pensions, substantial resources, and the absence of significant external threats to the independence of the courts. The United States, United Kingdom, and Canada all have judicial systems that share a common-law tradition traceable to the same origin (i.e., England). In each country, the decisions of the top court are reached through collegial discussion after receiving oral and written arguments from the lawyers representing both sides. Judicial decisions are almost always accompanied by written opinions that provide a legal explanation or rationale for the decision. These opinions then become binding precedents for the courts below. Judging on the top courts in all three countries is an inherently political process. Interviews with current and former law lords and members of the Canadian Supreme Court find a similar appreciation of the political significance of their work (Songer 2008). Under this perspective, it is reasonable to assume that judges would prefer that the policies they put in place while on the court will survive after their departure. Consequently, as in the United States, these judges may be expected to time their decision to retire from the bench on the basis of the likelihood of ensuring their replacement with a judge who holds similar political preferences (e.g., Barrow and Zuk 1990; Spriggs and Wahlbeck 1995).
Judges might also strategically time their departure from a court for partisan reasons. In all three countries, justices on the top court are selected by a partisan leader, the national chief executive. Moreover, in all three countries, much of politics is structured along partisan lines. For example, key positions in both the legislature and the executive branch of all three countries are filled primarily by members of the majority party. Thus, it is reasonable to expect that partisan executives will want to fill the courts with loyal members of their party as well. It is well established that in the United States, over 90% of federal court appointments at all levels go to members of the president’s party (Songer, Sheehan, and Haire Reference Songer, Sheehan and Haire2000; Segal and Spaeth Reference Segal and Spaeth2002). In both the United Kingdom and Canada the evidence is clear that party-based patronage was an important influence on judicial selection in at least the first half of the period examined in the analysis below (Bushnell Reference Bushnell1992; Kritzer Reference Kritzer, Jacob, Blankenburg, Kritzer, Provine and Sanders1996; Hausegger, Hennigar, and Riddell Reference Hausegger, Hennigar and Riddell2009). In support of this conclusion in the literature, our own analysis of the data collected for this project indicates that 44% of the justices in Canada and 29% of the justices in the United Kingdom held partisan positions at some point before their appointment to the courts.Footnote 1 And before World War II, prior partisan experience was a more common attribute of justices appointed in both countries (66% of the justices in Canada and 53% of the justices in the United Kingdom had prior partisan ties).Footnote 2 While we know of no studies from either the United States, the United Kingdom, or Canada that have directly assessed the extent to which justices on the top courts retain a subjective sense of partisan loyalty to the party that appointed them, it remains possible that justices might strategically time their retirements for partisan as well as policy reasons.
One noticeable difference between the United States on one hand and the United Kingdom and Canada on the other is that the judicial choices of the prime minister are not subject to ratification by the legislature; therefore, the prime ministers of Canada and the United Kingdom may be thought to have substantially more latitude to pick justices who share their political preferences and partisan identity. This greater freedom of prime ministers to pick their policy and partisan allies for the bench should lead to the expectation that the fewer constraints chief executives have on their ability to appoint justices to a top court, the more likely the justices will engage in strategic timing of their retirements. Examining retirement decisions in Canada and the United Kingdom provides a first chance to test this proposition.
In summary, while no two case studies can provide conclusive proof of general propositions, analysis of the retirement decisions of justices on the top courts of Canada and the United Kingdom should provide useful insights about the extent to which findings from the United States may be generalizable to other top courts that are significantly involved in policy making. In particular, because of the institutional similarities in the three top courts, understanding of the retirement decisions of the justices in Canada and the United Kingdom should shed light on the extent to which strategic timing of retirements is characteristic of courts in which judicial political attitudes have a substantial impact on the decisions of the justices. In addition, the change over time in which two of the institutional features thought to facilitate attitudinal voting came to characterize decision making in the top courts of Canada and the United Kingdom provides a natural experiment enabling a better assessment of the extent to which docket control and being a court of last resort contribute to strategic retirement decisions. The results of the analysis below will provide the basis for more confident propositions about the extent to which attitudinal decision making can be expected to lead to strategic retirements on other courts, at least in the common-law world, and whether specific institutional features like docket control are important facilitators of such strategic behavior.
Using the findings of previous studies conducted primarily on courts in the United States, we formulate models of judicial retirement for judges sitting on the courts of last resort in Canada and the United Kingdom, with particular concern for whether there is evidence that judges in these two common-law countries voluntarily retire for strategic political reasons.
Previous Studies of the Decision to Retire from the Bench
Theories of strategic behavior have not been the only focus of scholars interested in why judges voluntarily retire. Judicial scholars have long been interested in understanding the varied factors that might influence the retirement decisions of judges. As a result, a large body of literature has developed over time exploring the determinants of judicial retirement of federal judges with life tenure in the United States (e.g., Squire Reference Squire1988; Barrow and Zuk Reference Barrow and Zuk1990; Hagle Reference Hagle1993; Spriggs and Wahlbeck Reference Spriggs and Wahlbeck1995; Brenner Reference Brenner1999; Nixon and Haskin Reference Nixon and Haskin2000; Zorn and Van Winkle Reference Zorn and Van Winkle2000; Hall Reference Hall2001; Vining Reference Vining2009; Hansford et al. Reference Hansford, Savchak and Songer2010). While early studies of judicial retirement were more anecdotal, providing only descriptive information about the factors that may influence such decisions (e.g., Fairman Reference Fairman1938; Atkinson Reference Atkinson1976, Reference Atkinson1982), recent studies have provided more systematic evidence. The bulk of these studies, which have been conducted on the US Supreme Court, find retirement from the bench to be a result of strategic political concerns, institutional factors, and personal preferences (see, e.g., King Reference King1986; Squire Reference Squire1988; Hagle Reference Hagle1993; Zorn and Van Winkle Reference Zorn and Van Winkle2000). Politically, judges have been found to engage in strategic behavior by timing their retirement decisions on the basis of the likelihood of being replaced by a like-minded judge via the appointment process (e.g., Spriggs and Wahlbeck Reference Spriggs and Wahlbeck1995). However, more personal factors, including concerns related to old age, poor health, and financial considerations such as pension eligibility, also appear to influence retirement decisions (Squire Reference Squire1988). In addition to personal factors, a number of institutional characteristics have been found to influence justices’ retirement decisions, such as workload, work environment, and job satisfaction (e.g., Zorn and Van Winkle Reference Zorn and Van Winkle2000). The significant impact of systematic factors on Supreme Court retirements is further supported by a similar influence of such factors on retirement decisions of judges at the federal district court (Barrow and Zuk Reference Barrow and Zuk1990; Yoon Reference Yoon2006; Hansford et al. Reference Hansford, Savchak and Songer2010), federal court of appeals (Spriggs and Wahlbeck Reference Spriggs and Wahlbeck1995), as well as state supreme court (Hall Reference Hall2001) levels.
Outside the United States, the only notable study of retirement is Maitra and Smyth’s (2005) study of justices appointed to the High Court of Australia. Maitra and Smyth construct a hazard model to examine the determinants of retirement for justices appointed to the High Court in Australia between 1904 and 2001. They find that pension eligibility, whether the judge was an active participant in the Court’s work, and the partisan affiliation of the appointing government are significant predictors of when judges choose to depart from the bench. While this research provides us with important insights into the factors that influence the retirement decisions of judges in the United States and Australia, there are no comparable studies of retirement by appellate judges for most other common-law countries.
We contribute to this debate by extending theories of strategic judicial retirement developed in the United States to determine whether analogous patterns of retirement exist in the top appellate courts of Canada and the United Kingdom. While exploring for such strategic behavior, we control for the relative importance of personal (e.g., age and declining health) and institutional (e.g., increasing workloads) factors found significant in previous research on the decision of a judge to retire from judicial service. Using survival analysis to examine the career patterns of all judges appointed to the Supreme Court of Canada (1875–2012), as well as the Judicial Committee of the House of Lords of the United Kingdom (1875–2009), we find that these judges are influenced by more personal factors such as infirmity and length of judicial service in times of retirement than by any strategic motivation.Footnote 3
Data and Methods
Our data on Canadian justices are based on the universe of justices who have served on the Supreme Court from the time the Court was created in 1875 through 2009. Most of the information is available from the biographies of the justices maintained on the official website of the Court. Data on the writing of the justices and their rate of dissent come from the authors’ analyses of the universe of judicial decisions from 1949 to 2009. The data for 1970–2003 are maintained in the High Courts Judicial Database (HCJD).Footnote 4 Data for 2004–9 were coded by the authors, following the coding rules of the HCJD. The remainder of the data were coded by Susan Johnson of the University of North Carolina at Greensboro. Much of the data on the UK judges were obtained from the British Judges Biographical Data, 1870–1996, compiled under the direction of C. Neal Tate. These data were supplemented by data on more recent justices from the website of the Supreme Court of the United Kingdom and Internet searches conducted by the authors. Data on the writing of the justices and their rate of dissent come from the HCJD, supplemented by the authors’ coding of decisions from 1949–69 and 2004–8 by the authors and by Susanne Schorpp of Georgia State University.Footnote 5
To analyze the influences related to departure, we employ a series of duration models for each country, where the dependent variable is the likelihood of a departure in a particular year.Footnote 6 First, we examine baseline models for a period of over 130 years (1875–2009 in Canada and 1876–2009 in the United Kingdom). We then conduct more detailed analyses for each country that take advantage of additional decisional data on cases decided in each court for a more recent time frame (1949–2008). Individual justices are examined annually from the time of their initial appointment, T 0, to the time of their departure, T t . In order to determine the proper functional form of the duration model, we initially examined several Kaplan-Meier graphs.Footnote 7 These indicate that a Weibull regression is appropriate in order to account for a distinct trend in the hazard rate related to time of departure. As individuals stay on the court for longer periods of time, the likelihood of a departure in a particular year increases. Since Cox proportional hazards models are agnostic toward time and exponential models assume that the hazard rate is constant, the Weibull regression is more appropriate for our data structure. Consequently, all independent variables are computed for each judge-year.Footnote 8
Our key hypothesis posits that justices retire as a result of particular strategic calculations based on contemporary political dynamics. Strategic political retirement might be due to either ideology or patronage concerns. To evaluate this hypothesis, we include two independent variables plus a series of interaction terms. We follow the lead of the most prominent studies of strategic retirement from the US Supreme Court (Squire 1988; Hagle 1993; Zorn and Van Winkle 2000) that use congruence in the party of the chief executive who originally appointed the justice and the party of the chief justice in office at the time of retirement as an indicator of retirements consistent with a strategic perspective. Same Party is a dichotomous variable coded 1 when the party of the current prime minister in office is the same as the party of the prime minister who appointed a particular justice.
Since the literature reviewed above indicates that the party of the appointing prime minister provides a rough indicator of policy preferences, the Same Party variable taps both the possibility of strategic departures to advance common policy agendas and the desire to reward one’s party on patronage grounds. Thus, strategic judges will be expected to retire from the bench when the current prime minister is of the same party as their own appointing executive.Footnote 9 The dummy variable Change of Political Power is coded 1 for each judge-year in which a parliamentary election was held that resulted in the selection of a prime minister of a party different from the party of the previous incumbent.
To control for whether judicial departures are related to personal characteristics, we employ several independent variables. The first, Age, is computed by simply subtracting the birth year of the justice from the current year. It is anticipated that the likelihood of voluntary retirement will increase with age. Poor Health is a dummy variable that is based on a rough proxy measure due to the difficulties in obtaining accurate health information for each justice. If the justice dies within 2 years of his or her departure from the court, we code this variable 1 (0 otherwise).Footnote 10 Political Experience is a dummy variable (coded 1) that captures whether a justice held or ran for elected office, or was active in the formal organization of a political party, prior to appointment to the bench. Virtually all elected officials in both the United Kingdom and Canada are selected in partisan elections. The most common prior elected office for the justices was as a member of Parliament. Finally, Prior Judicial Experience measures the number of years that a judge served on any other court than the Supreme Court of Canada or the House of Lords prior to his appointment to the top court. As in the United States, most justices on the top courts of both Canada and the United Kingdom had previously served on the main intermediate appellate court.Footnote 11
To control for whether certain institutional features of the court influence judicial departures, we include three variables in our models. The first, Rights Agenda, is a dummy variable that captures the prominence of rights cases on the court’s docket. More specifically, in Canada this variable is coded 1 for all years following the adoption of the Charter of Rights and Freedoms in 1982. In the United Kingdom the variable is coded 1 for all years following the 1998 passage of the Human Rights Act. Our variable Docket Control is a dummy variable that is coded 1 for all years in which the court gains complete discretionary control of its docket—1975 in Canada and 1934 in England. Finally, the dummy variable Party Balance measures those years in which the number of judges appointed by the party of the prime minister of the party having the greatest number of its appointees on the court is no more than one greater than the party having the second-greatest number of judges on the court.
Empirical Results
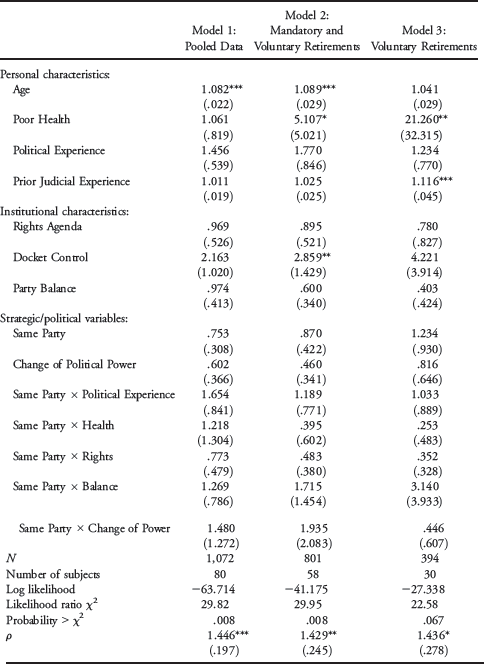
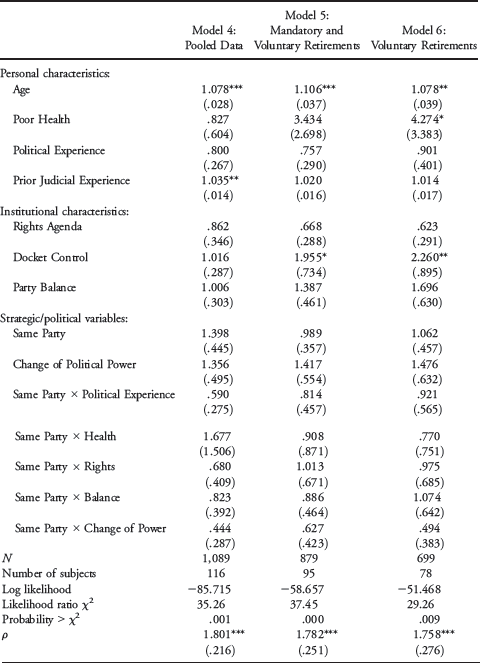
The results of our Weibull regression models are displayed in tables 1 and 2. Before we examine specific findings, it is important to determine whether our choice of the Weibull distribution is in fact appropriate.Footnote
12
Examining the rho (
 ) coefficient in the last row of each column provides empirical support. The statistically significant
 reveals that the hazard rate does not remain constant (as assumed by an exponential distribution). Additionally, since
 is greater than 1.00, this indicates that the hazard rate continuously increases.Footnote
13
Consequently, as observations remain in the data set longer, the likelihood of experiencing a departure in a particular year increases.
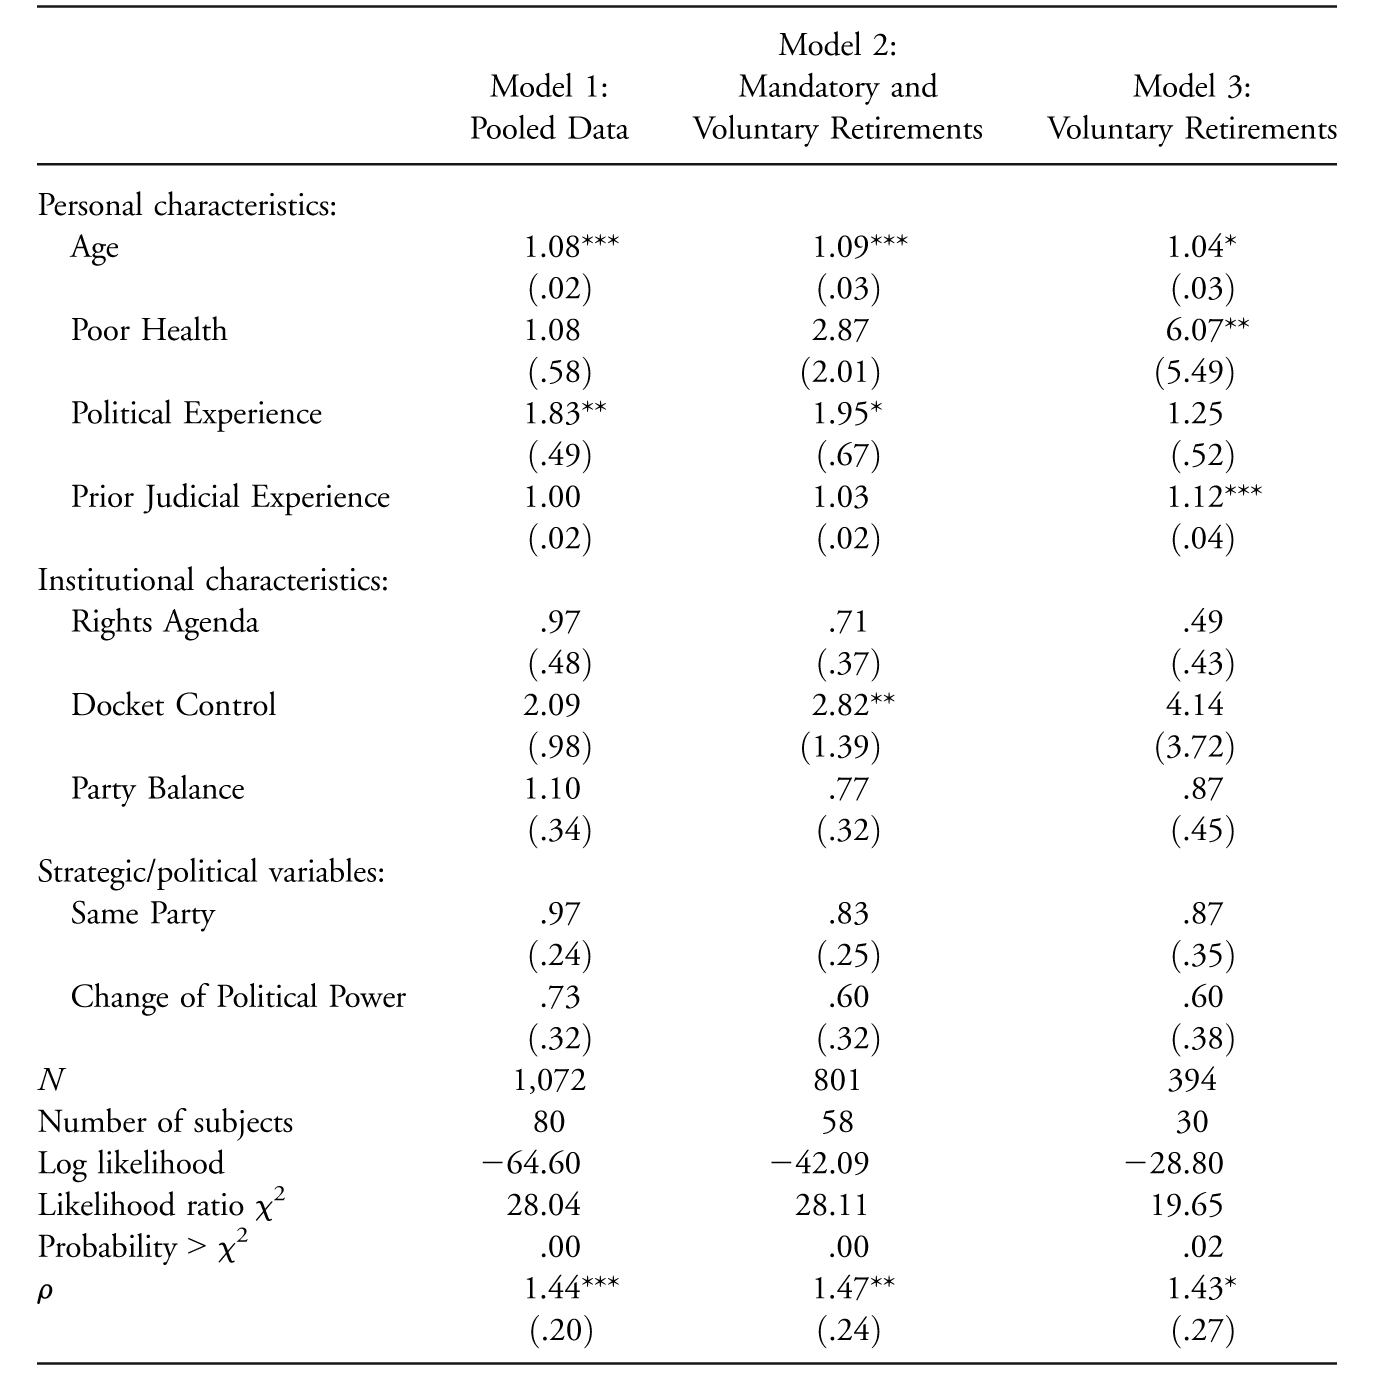
Note—The cells represent the hazard ratios of the results from a Weibull regression examining the number of years until departure from the Supreme Court of Canada, with the standard errors in parentheses.
* p < .10.
** p < .05.
*** p < .01.
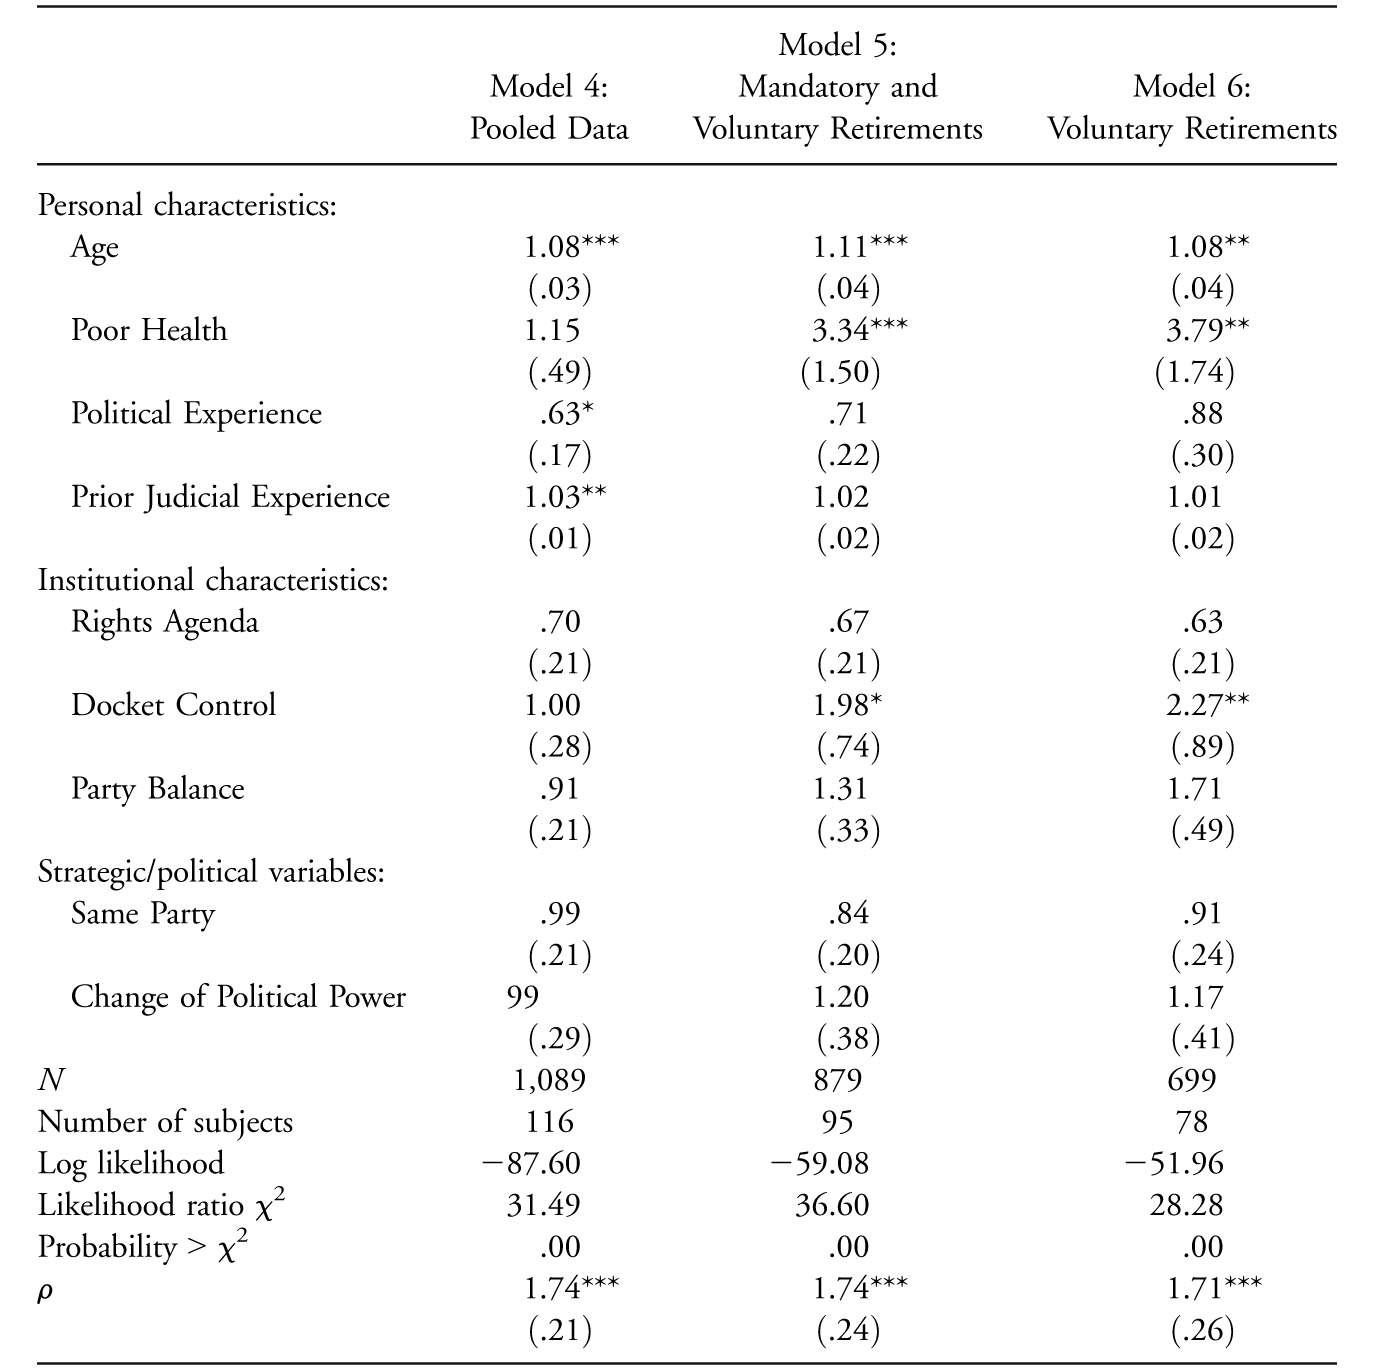
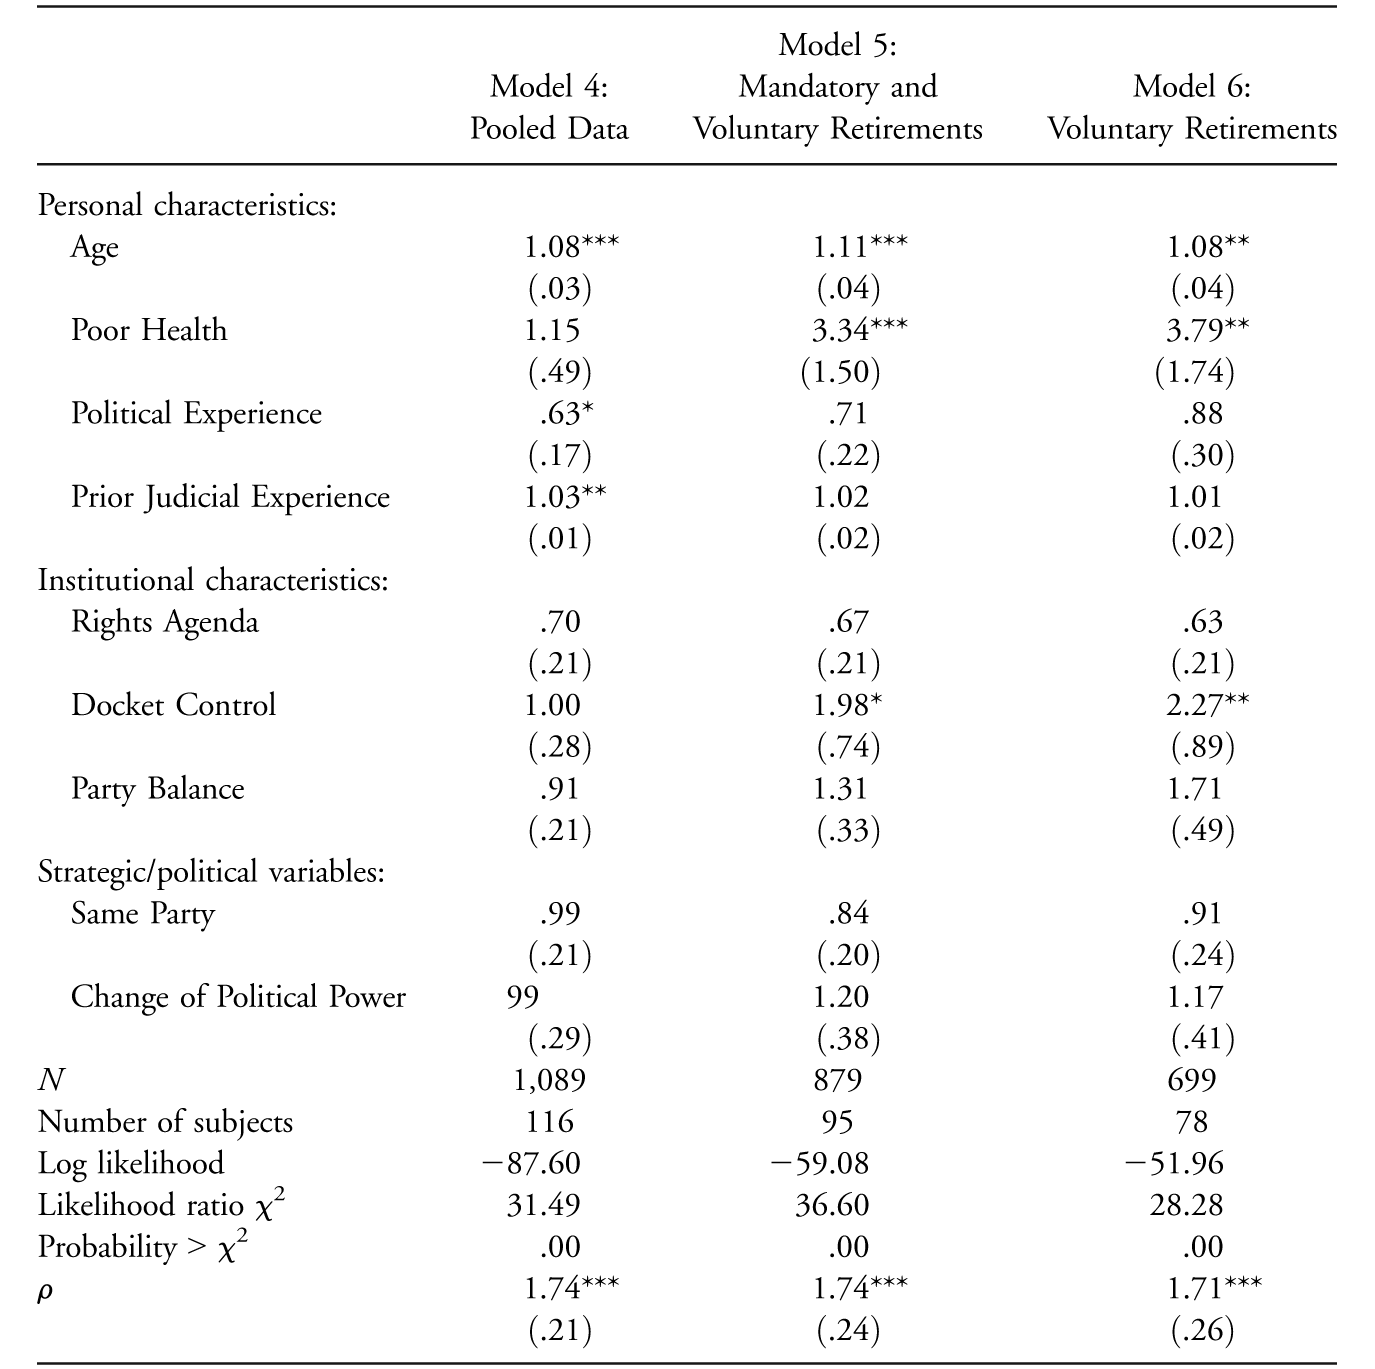
Note—The cells represent the hazard ratios of the results from a Weibull regression examining the number of years until departure from the English House of Lords, with the standard errors in parentheses.
* p < .10.
** p < .05.
*** p < .01.
Table 1 provides results of three duration models examining departures on the Supreme Court of Canada for 1875–2009. Table 2 provides the analogous results for the United Kingdom for 1876–2009. The first model in each of the tables (i.e., models 1 and 4) includes the pooled data set of all individual justices over that time span. We caution against reaching any strong conclusions based on these models because the pooled data include individuals who remained on the bench until death. This is problematic when trying to determine the conditions under which individuals depart from the court; therefore, in model 2 (Canada) and model 5 (United Kingdom), we exclude those justices who died in office. Stated another way, we examine only justices who voluntarily left the bench or who met the mandatory retirement age requirements. Model 3 for Canada and model 6 for the United Kingdom further refine the data set by examining only those individuals who voluntarily retired from the court. That is, we eliminate individuals who either died in office or met the mandatory retirement requirement. If political influences affect a justice’s decision to leave the bench, we believe that these samples should provide the best evidence of this type of strategic behavior.
The Absence of Evidence of Strategic Behavior
Notably, none of the variables consistent with a strategic explanation of retirement (either a partisan or a policy-based strategic theory) reached conventional levels of statistical significance in any of the three models in either Canada or the United Kingdom. The key test of strategic behavior is whether justices are more likely to retire when the current prime minister is of the same party as the party of the prime minister who appointed the justice. Because the coefficients represent hazard rates, values over 1.000 indicate an increase in the likelihood of observing a departure in a given judge-year while values below 1.000 indicate a decrease. Looking first at the models in each country presenting the results of the analysis of the pooled data (model 1 and model 4), we see that the effects for Same Party prime minister are in the expected direction only in the United Kingdom, but neither coefficient reaches conventional levels of statistical significance. Similarly, in models 2 and 5, in which we examine only those justices who either voluntarily retired or served until they reached the mandatory retirement age, the variable for Same Party fails to reach statistical significance in both countries. Even when attention is limited to just those justices who voluntarily retire from the Court (model 3 and model 6)—the group most likely to display the effects of politically motivated strategic retirement—the results remain the same: there is no evidence that justices are more likely to retire when there is a prime minister of the party that appointed them than when the opposition controls the government.
The Conditional Effects of Same Party
We noted above two institutional characteristics that might enhance the feeling of judges that they were engaged in important work. The increase in the number of civil liberties cases on the court’s docket (following the adoption of the Charter of Rights in Canada or the Human Rights Act in the United Kingdom) might raise the salience of their decisions in the eyes of many judges. Similarly, sitting on a court that was closely divided politically might signal to judges that every vote counted and thus their own participation was more valuable. To strategically oriented judges, both of these factors might be expected to raise the stakes of timing their departure to ensure that a prime minister of their own party could select their replacement. Thus, we anticipate that if strategic theories of judicial departure have important explanatory power, there should be a strong conditional relationship between same-party departure and both the existence of a significant rights agenda and the presence of a closely divided court. That is, there should be a positive association between leaving the court during the administration of a same-party prime minister and the time period after the increase in the rights agenda. Similarly, there should also be a positive association between same-party departures and the presence of a court that was closely divided in the political affiliations of its judges.
Additionally, for judges with strategic orientations, there should be a conditional relationship between departures during the administration of a prime minister of the same party and the alternation of the parties in power in Parliament. Our calculations indicate that in 90% of the years for Canada and 95% of the years for the United Kingdom since 1880, membership on the court was bipartisan.Footnote 14 Therefore, in almost any given year it is possible that there is at least one judge of the party not currently controlling the government who would like to time his departure to allow a prime minister of his own party to pick his replacement but has decided to stay on the court for the present because the prime minister is currently of the other party. The longer such a strategic judge is faced with such a situation, the more likely he will be to retire as soon as his party gains control of Parliament (and thus selects the prime minister). This tendency to retire as soon as a new election brings one’s party to power should be enhanced by the uncertainty regarding the timing of elections. In the United States, after an election brings a president of a new party to power, even strategic judges of that party may delay their departure for 2 or 3 years because they are guaranteed that “their” president will still be in office at that later date. But in the United Kingdom or Canada, the possibility of a snap election or a vote of no confidence that could lead to their party suddenly losing power might encourage such judges to retire shortly after their party regains the prime minister’s office. Thus, for strategic judges the tendency to leave when the prime minister is of their party may be conditioned on the electoral cycle. We expect that these dynamics will produce a positive association between departure when a same-party prime minister is in office and the year following an election in which party control of Parliament changed.
However, none of these expectations were supported by the results in any of the six models presented in table 1 or table 2. All the interaction terms described above failed to reach conventional levels of statistical significance.Footnote 15 Taken together, the results from these models indicate that justices on the top courts in Canada and the United Kingdom do not base their departures from the bench on strategic calculations. Instead it appears that the likelihood that a justice will time his retirement to advance either policy or partisan interests is not conditional on the existence of factors that might be thought to make a politically timed departure more attractive to a justice.
The Influence of Personal Factors on Retirement
Given the failure to find evidence that judicial retirements are motivated by strategic political concerns, we next explore whether personal concerns—age, poor health, and length of service in particular—are associated with the timing of retirements. In particular, as justices become older or begin to experience health issues or have simply served on the bench for an extended period of time, are they more likely to depart?
Examining the six models presented in table 1 and table 2 demonstrates that Age has the most consistent effect among personal characteristics on the decision to retire. The hazard rate for Age reveals that older justices in both Canada and the United Kingdom are more likely to depart in a particular year than their younger colleagues.Footnote 16 Consequently, as the variable Age increases, the likelihood of a departure in a particular judge-year increases. The coefficient for Age is statistically significant for five of the six models; only when attention is limited to model 3 (voluntary retirements in Canada) does the Age variable fail to reach statistical significance.
In addition to Age, there is some evidence that suggests that poor health may contribute to the decisions of the justices to retire. For both Canada and the United Kingdom, among those who voluntarily retire, the hazard rate for Poor Health reveals that these judges are more likely to retire than those in good health.Footnote 17 However, Poor Health does not appear to be related to the decision to retire if one examines the larger sample of all justices serving during the century and a quarter period we examined.
Other personal characteristics do not appear to have consistent effects on the decision to retire. The variable for Political Experience does not reach statistical significance in any of the models for either Canada or the United Kingdom. The effect of Prior Judicial Experience is statistically significant for only one of the models in Canada and one in the United Kingdom.
The Effects of Institutional Characteristics on Judicial Retirement
Some of the literature on judicial retirement in the United States suggested that various institutional features of a judicial system might make continued service on a court more or less rewarding to the justices. Therefore, we added control variables to our models to assess the impact of the presence of an active rights agenda, docket control by the court, and the contemporary party balance on the court on the decision to retire. Examination of the results in table 1 and table 2 indicates that the variables for the Rights Agenda and Party Balance fail to reach statistical significance in any of the models for either Canada or the United Kingdom. The evidence for Docket Control is mixed. The variable is statistically significant for one of the models for Canada and two of the models for the United Kingdom. That is, there is some, but mixed, evidence that justices are more likely to depart in a particular year after the court gains discretionary control over its docket. Overall, however, there is little evidence that institutional characteristics exercise a major impact on when justices retire.
Retirements in Contemporary Times
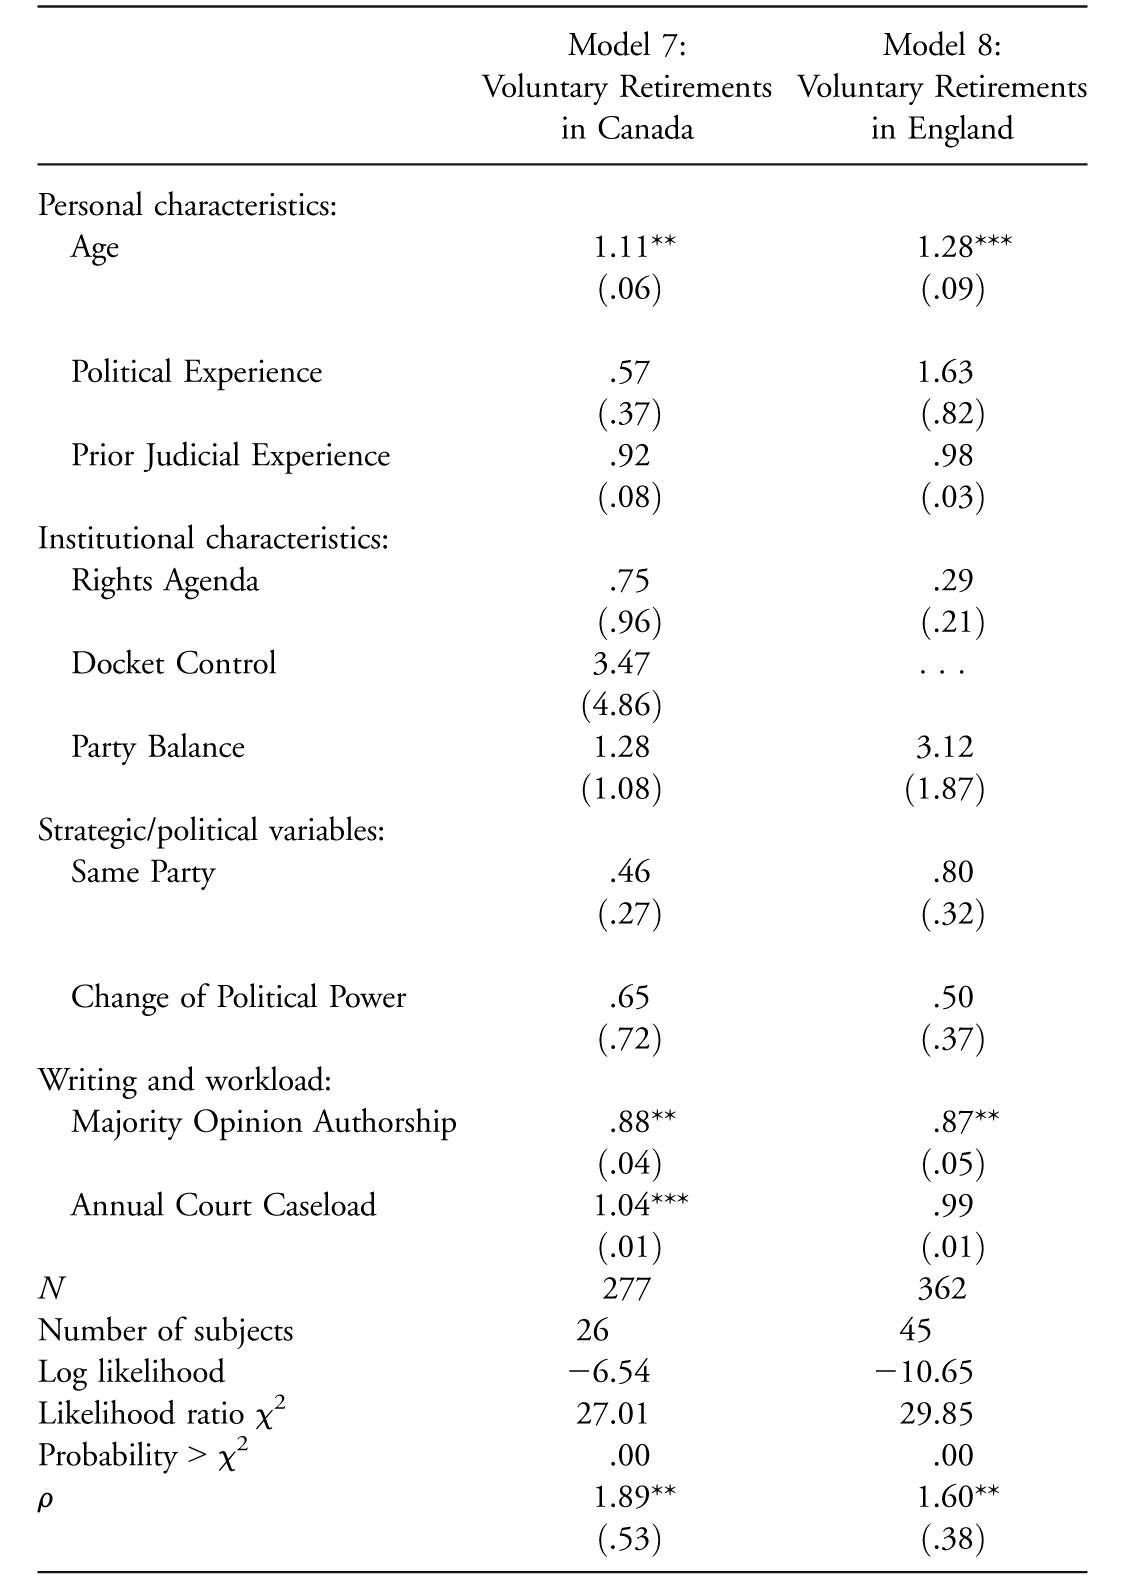
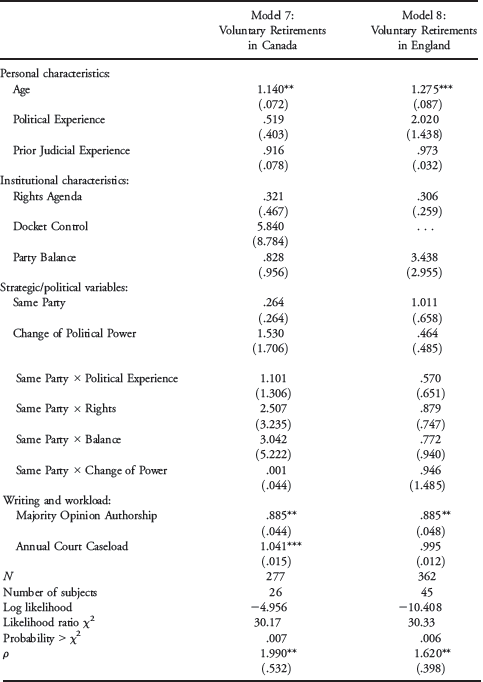
While the results in tables 1 and 2 demonstrate that the decision to leave the bench is motivated primarily by personal considerations with no apparent external political influences, we recognize that the more recent environment may provide justices with different considerations. Consequently, we analyzed the more contemporary eras for both Canada (1973–2011) and England (1947–2010). Additionally, this more contemporary focus allows us to exploit other measures included in the HCJD that reflect overall caseloads for both courts and the number of majority opinions written by individual judges. These results are reported in table 3. Each model examines only those individuals who voluntarily retire from the bench.
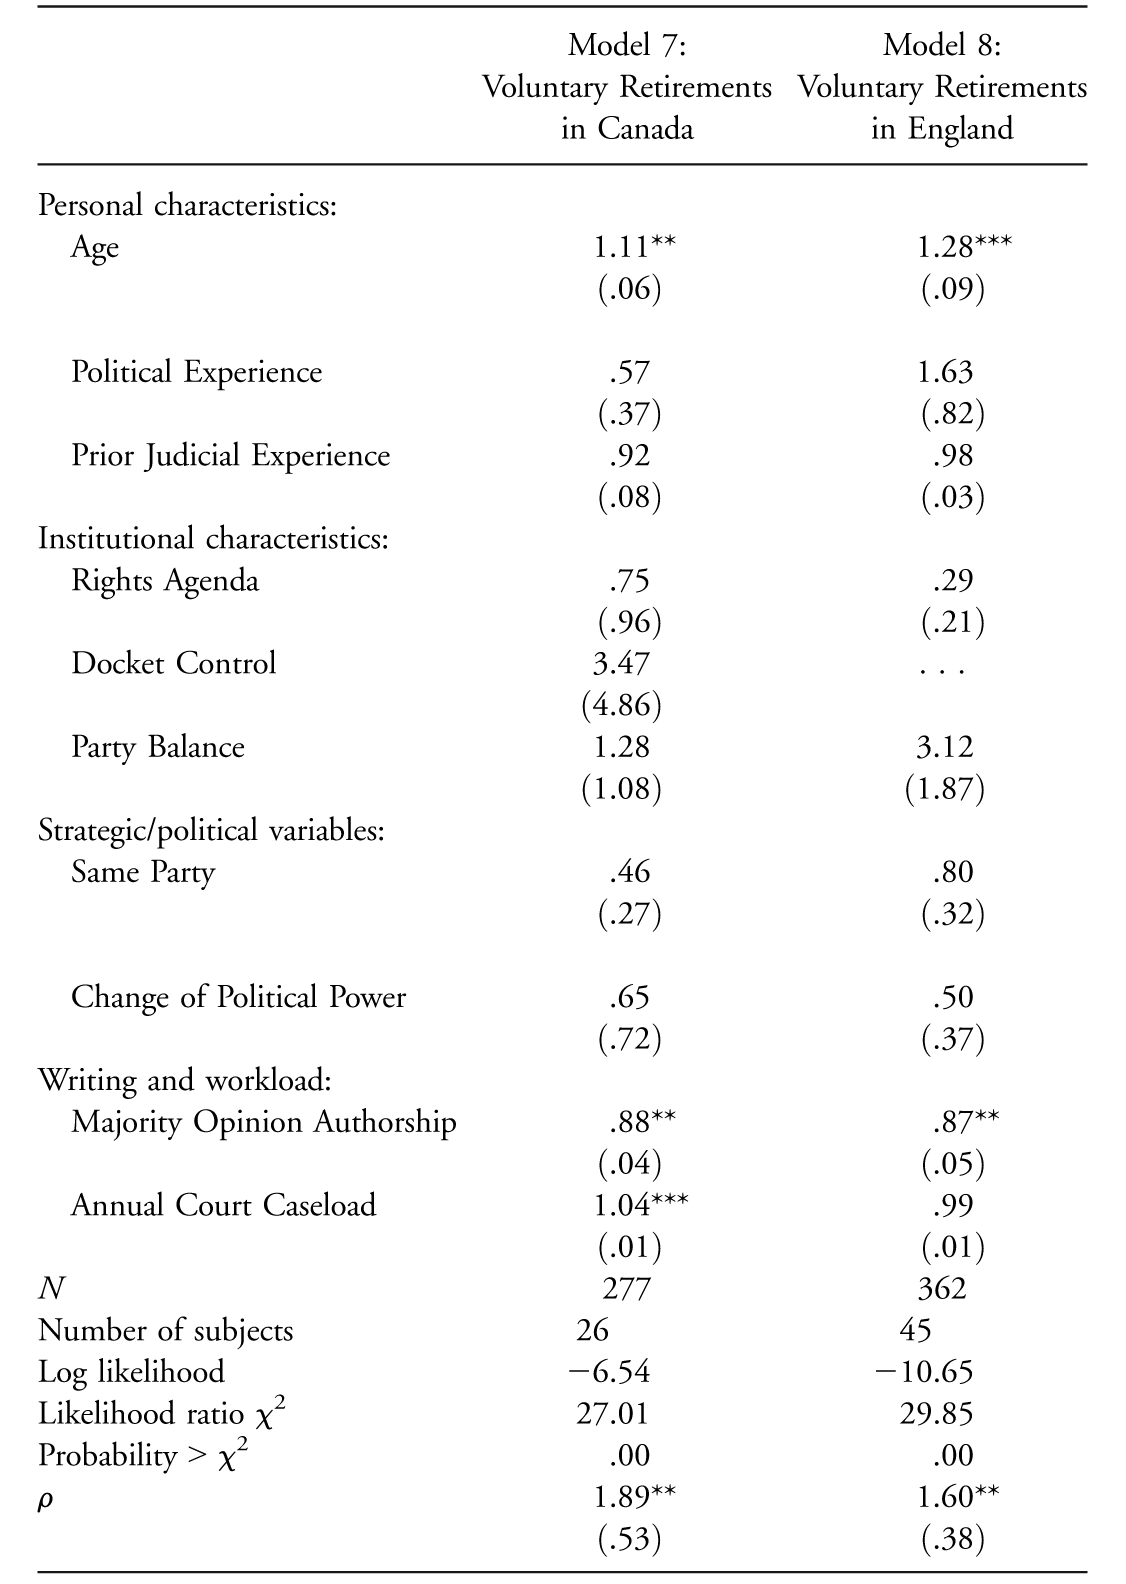
Note—The cells represent the hazard ratios of the results from a Weibull regression examining the number of years until departure, with the standard errors in parentheses. Data for Canada consist of the years 1973–2011, and data for England cover 1947–2010.
* p < .10.
** p < .05.
*** p < .01.
One critical feature of the job environment of appellate court judges is their workload and their ability to control that workload through institutional rules that determine the extent to which judges can control their own agenda. Personal workload might enter into a judge’s decision to retire, given that more work can result in an increased desire to discontinue service. In their study, Barrow and Zuk (1990) find that increases in caseloads are important predictors of turnover on lower federal courts in the United States. It is reasonable to assume that if a judge feels overburdened by large caseloads, he may begin to find his job to be too laborious and, thus, may choose to step down.
An additional indicator of job satisfaction may be the frequency with which a judge writes either the opinion of the court or a concurring opinion. Posner (1993) argues that the ability to affect the future direction of case law is an important component of a judge’s happiness. Judges who write frequently, who are actively and frequently engaged in shaping that case law, are more likely than other judges to have higher levels of job satisfaction and thus be less inclined to voluntarily leave the bench. The frequency of opinion writing both may reflect the degree to which the judge is psychologically engaged in the work of the court and may also serve as a rough proxy for health. As Banfield and Kerby (2012, 6) argue, “Judges who are content with their work and/or healthy are capable and willing to write more judgments than those judges who are not: judges who are happy at work and healthy are less likely to leave their jobs voluntarily.”Footnote 18
Model 7 examines individuals who voluntarily retire from the Supreme Court of Canada, while model 8 provides results for individuals who voluntarily retire from the English House of Lords. The results from this analysis of retirement decisions in the modern political period further reinforce our initial conclusions about the apparent absence of strategic motivations to depart the bench. For both the entire 130-year period studied and the modern period, there was no statistically significant tendency of justices on the top court of either Canada or the United Kingdom to time their retirements so that a prime minister of the party that initially appointed them could also appoint their replacement.Footnote 19
Analysis of the modern period on both courts reinforces the findings from the analysis of the entire period. Table 3 provides further evidence of the impact of personal rather than political influences on retirement decisions. In addition to the personal influences discovered earlier (most notably Age), it appears that caseload concerns affect the decision to depart (at least in Canada), with greater caseloads increasing the likelihood of departure in a particular year.Footnote 20 One additional factor that contributes to individuals remaining on the bench involves the extent to which they are provided with opportunities to influence judicial policy. We see that the variable Majority Opinion Authorship is significant but possesses a hazard ratio less than 1.000 in both Canada and the United Kingdom. This indicates that justices who write more majority opinions are significantly less likely to depart in a particular year. We speculate that these opportunities to affect judicial policy provide justices with additional intrinsic value and importance, which in turn lengthens their tenure on the court.
Conclusions
If judges on top appellate courts are rational actors who care deeply about the policy consequences of their decisions, they may be expected to give serious consideration to the ways that the timing of their retirement may advance their political goals. The increasing judicialization of politics throughout the common-law world and in much of the civil-law world in Europe and Latin America thus raises the question of whether such strategic thinking on judicial retirement might be in the process of becoming the norm or whether it is limited to judicial systems with certain institutional characteristics or particularly politicized selection systems. As noted above, past studies suggest that such strategic approaches to retirement appear to be a consequence of attitudinal voting on appellate courts in the United States. But the near-absence of empirical studies of retirement outside the United States leaves open the question of whether US retirement practices are an anomaly.
To gain a better perspective on these questions, we examined patterns of retirement by judges on the top appellate courts in Canada and the United Kingdom. These two courts provide a good first step in the assessment of how generalizable patterns of retirement in the United States are because, like the courts in the United States and in most of the common-law world, they are important policy makers. In addition, they share institutional features that US scholars have hypothesized are important for politicized decision making by judges, including a high level of judicial independence, substantial docket control, being a court of last resort, a substantial involvement in rights policy, and the absence of ambition for higher office. And studies in both countries leave little doubt that who sits on those courts matters. The political attitudes and preferences of the law lords and the justices on the Supreme Court of Canada have a profound impact on at least some of the politically important decisions of those courts. Recognition of the importance of who sits on the courts of final appeal has generated intense debate in both Canada and the United Kingdom in recent years about the appropriate process for selection of new justices. But little attention has been given to why the justices leave their courts. Since it is generally assumed that prime ministers will not be able to place their own choices on the bench until a vacancy occurs, understanding the reasons for vacancies becomes an important part of understanding the forces that shape the composition of the courts.
However, our analyses found no evidence that any political factors influenced the departures of justices in either the United Kingdom or Canada. Justices were not more likely to retire when their party controlled the prime minister’s office than they were when the opposition party would gain an appointment from their departure, even when a new appointment might tip the partisan balance on the court. This absence of any evidence consistent with a strategic explanation of retirement has been a stable feature of both Canadian and British judicial behavior for at least 130 years. While the findings for these two countries do not provide conclusive evidence of how widespread strategic retirement is throughout the world, this failure to find evidence of strategic retirement in either the United Kingdom or Canada raises substantial doubts that the US pattern is the norm, particularly given the institutional similarities between these courts and the US courts.
The consistency over time in the apparent domination of nonstrategic motives for retirement in both the United Kingdom and Canada also raises doubt about the extent to which institutional features thought to be important actually contribute to strategic retirement decisions. In particular, Canada underwent several substantial institutional changes over the 130 years studied without these institutional changes affecting the propensity of the justices to time their retirements strategically. While the Supreme Court of Canada has always enjoyed considerable judicial independence, it did not become a court of last resort until appeals to the Privy Council were abolished in 1949, it did not gain substantial docket control until 1975, and it did not become a major player in rights policy until after the adoption of the Charter of Rights in 1982. Yet, strategic approaches to retirement did not characterize the actions of the justices either before or after any of these three major institutional changes. The top court in the United Kingdom has undergone fewer significant institutional changes, but as in Canada, the attainment of substantial docket control (in 1934) had no significant impact on the likelihood of strategic retirement.
Instead of finding strategic retirements, our analyses indicate that justices in Canada and the United Kingdom tend to either stay on the court as long as possible (i.e., until they die or reach mandatory retirement age) or retire for personal reasons. The substantial number of justices in both countries who remain on the court until they die or reach mandatory retirement age suggests that, as a whole, job satisfaction is high among the justices. Moreover, there was some indication that it is factors that increase personal satisfaction (e.g., good health and having a chance to write for the court’s majority) that contribute the most to the reluctance to give up a judgeship voluntarily.
It is not immediately apparent why personal rather than strategic motivations appear to have more influence on retirements in Canada and the United Kingdom than in the United States. One speculation was raised by the majority of the judges interviewed in both Canada and the United Kingdom. The judges suggested that in their country, a culture existed in which the selection of judges is less overtly political than it is in the United States. If this view of the selection process is correct, it may make judges in both Canada and the United Kingdom less susceptible than those in the United States to political stimuli when making the decision to retire. Instead, these judges may be more influenced by personal considerations when choosing to exit from the bench. Unfortunately, the less open process of selection in the United Kingdom and Canada makes these observations difficult to empirically assess.
Additionally, limits on tenure in Canada and the United Kingdom might reduce the tendency of the justices to retire for strategic reasons. Though justices of the US Supreme Court are provided with lifetime tenure, judges in the United Kingdom face mandatory retirement at age 70. In Canada, justices must retire at age 75. Given that US Supreme Court justices are not subject to mandatory retirement upon reaching a specific age, these judges have been known to remain on the Court for a substantial amount of time (Epstein, Knight, and Martin 2003; Peretti 2007). Although the average tenure of a Supreme Court justice from 1789 through 1970 was about 14.9 years, for those justices who have retired since 1970, the average tenure has increased to 26.1 years or more (see Calabresi and Lindgren 2006). In contrast, our analysis of retirement data collected for this project reveals that the median tenure for justices in the United Kingdom is only 8 years and in Canada is 12 years. This average number of years on the Court has remained essentially constant throughout the history of the courts since 1875. The mandatory retirement ages in both Canada and the United Kingdom result in the justices having shorter careers on the Court and may reduce both the opportunity and the incentive for the justices to retire early for strategic reasons.
Appendix
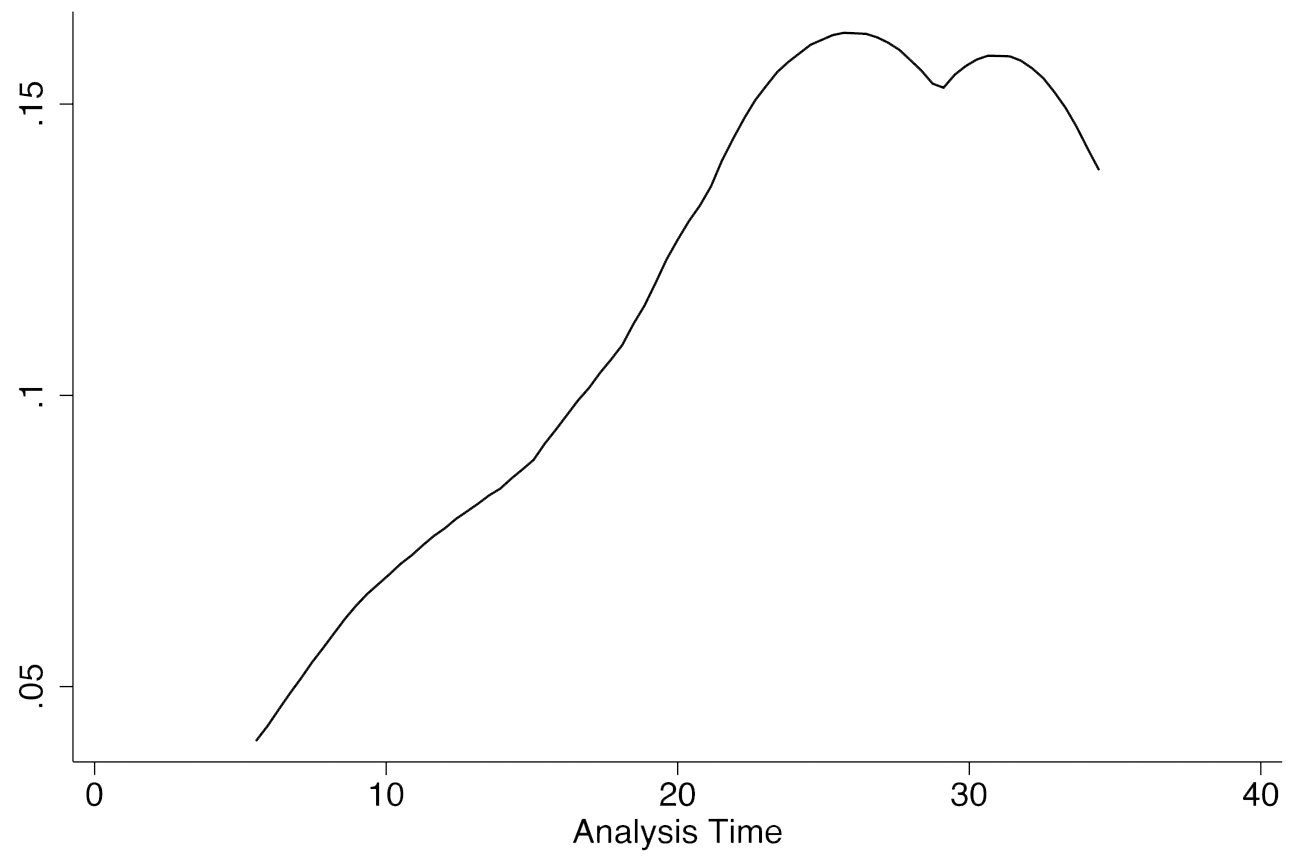
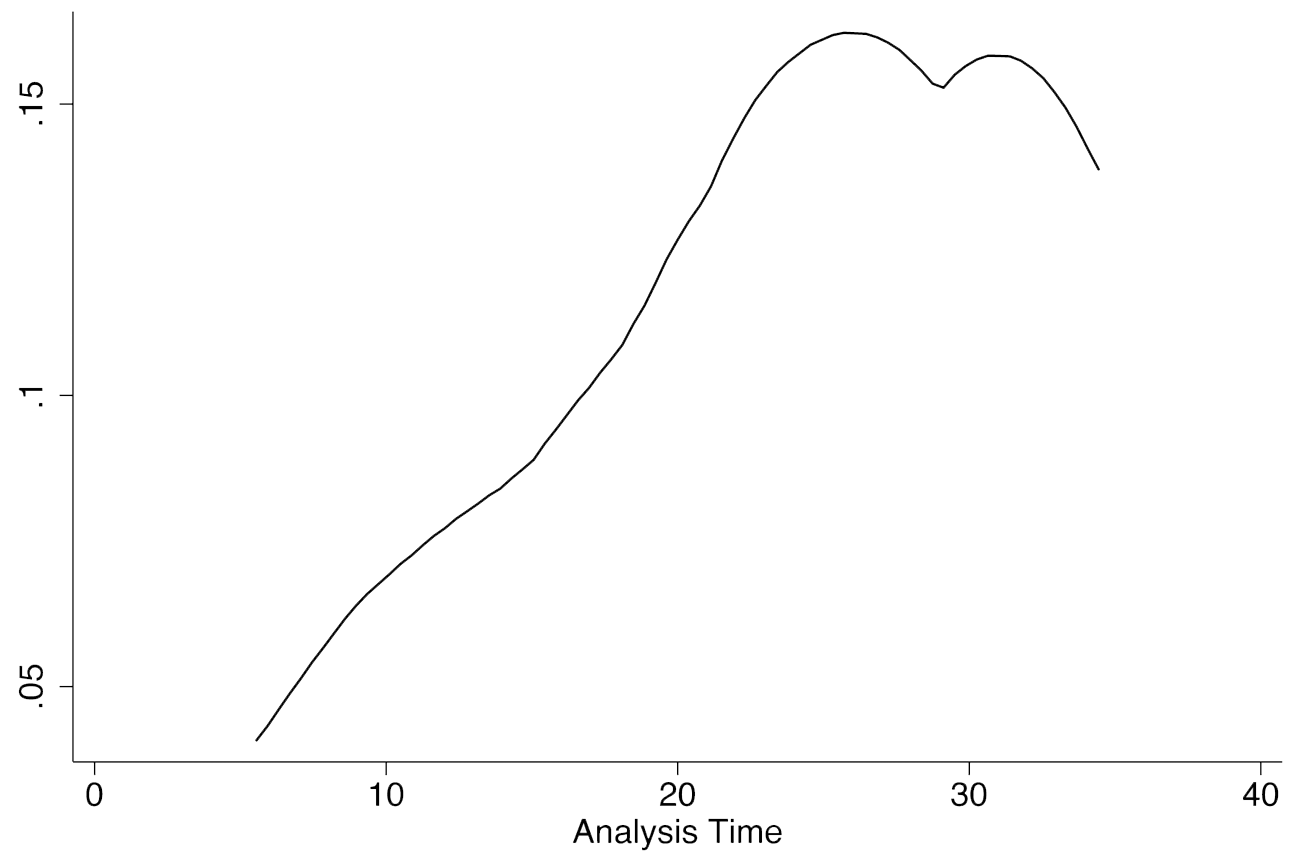
Kaplan-Meier graph of baseline hazard estimate. This graph represents an estimate of the baseline hazard rate (i.e., the likelihood that an individual judge retires at time t) without accounting for the influence of any independent variables. Examining this graph reveals that the likelihood of departure increases over time. Consequently, this observation supports the choice of a Weibull regression rather than a Cox or exponential model to examine the determinants of judicial retirements.
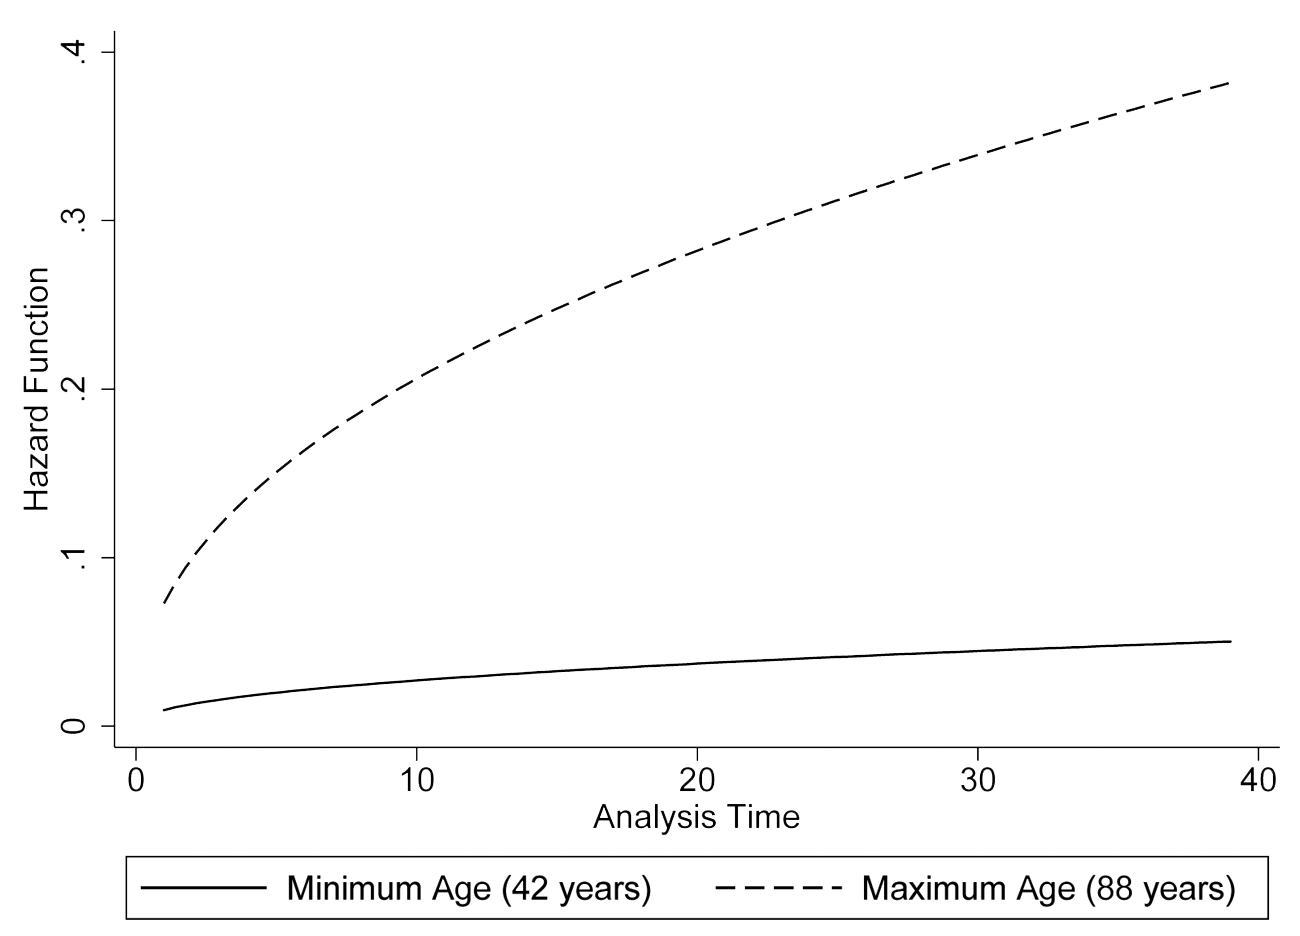
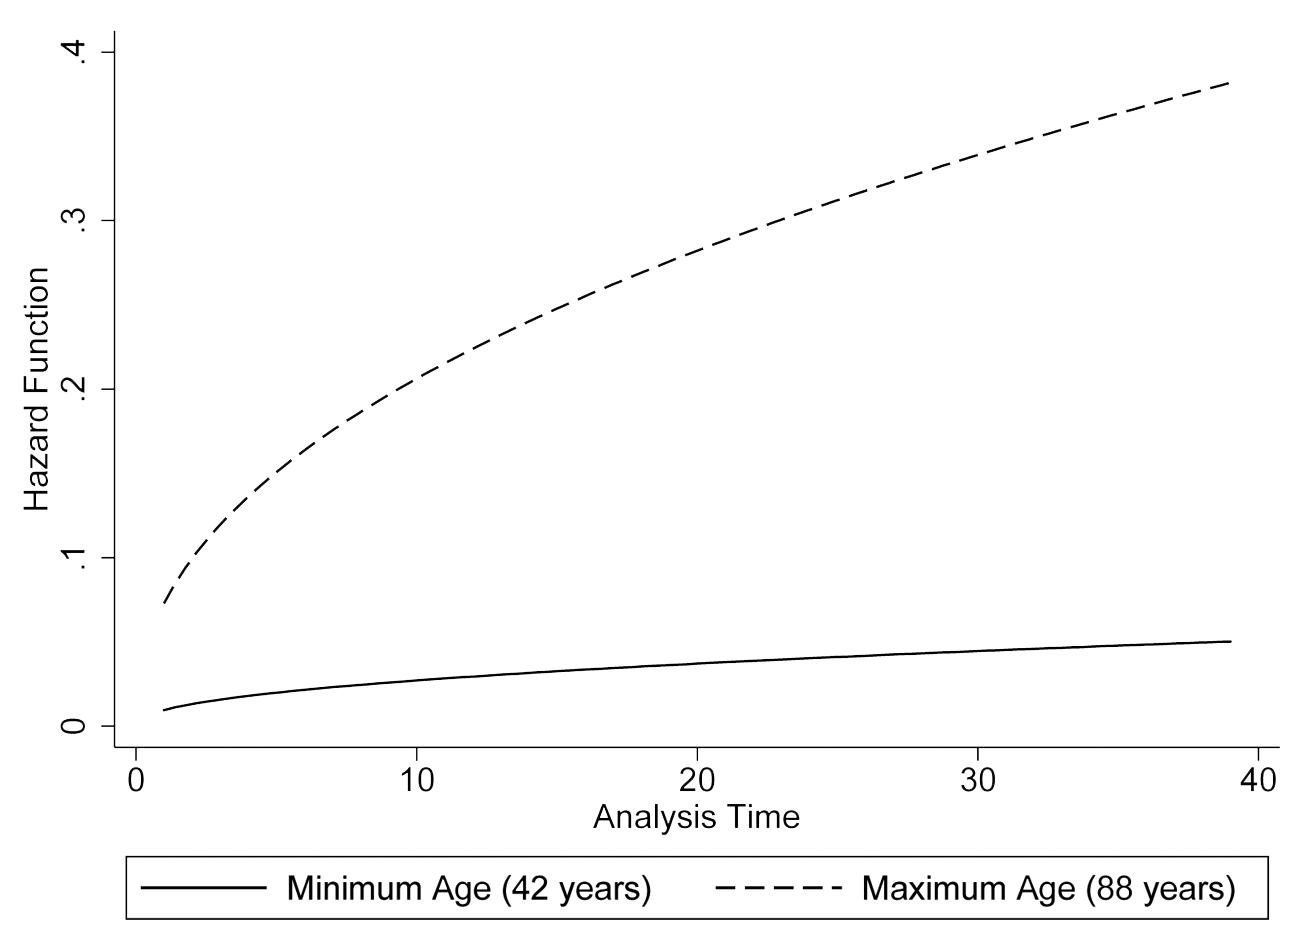
Graph of changes in the hazard rate due to age. This graph represents the substantive changes to the hazard rate (i.e., the likelihood that an individual retires at time t) related to the age of the judge. The solid line represents the minimum age in the data (42 years), and the dashed line represents the maximum age (88 years). Examining this graph reveals that older judges are substantially more likely to retire than younger judges, even accounting for the amount of time on the bench (the x-axis).
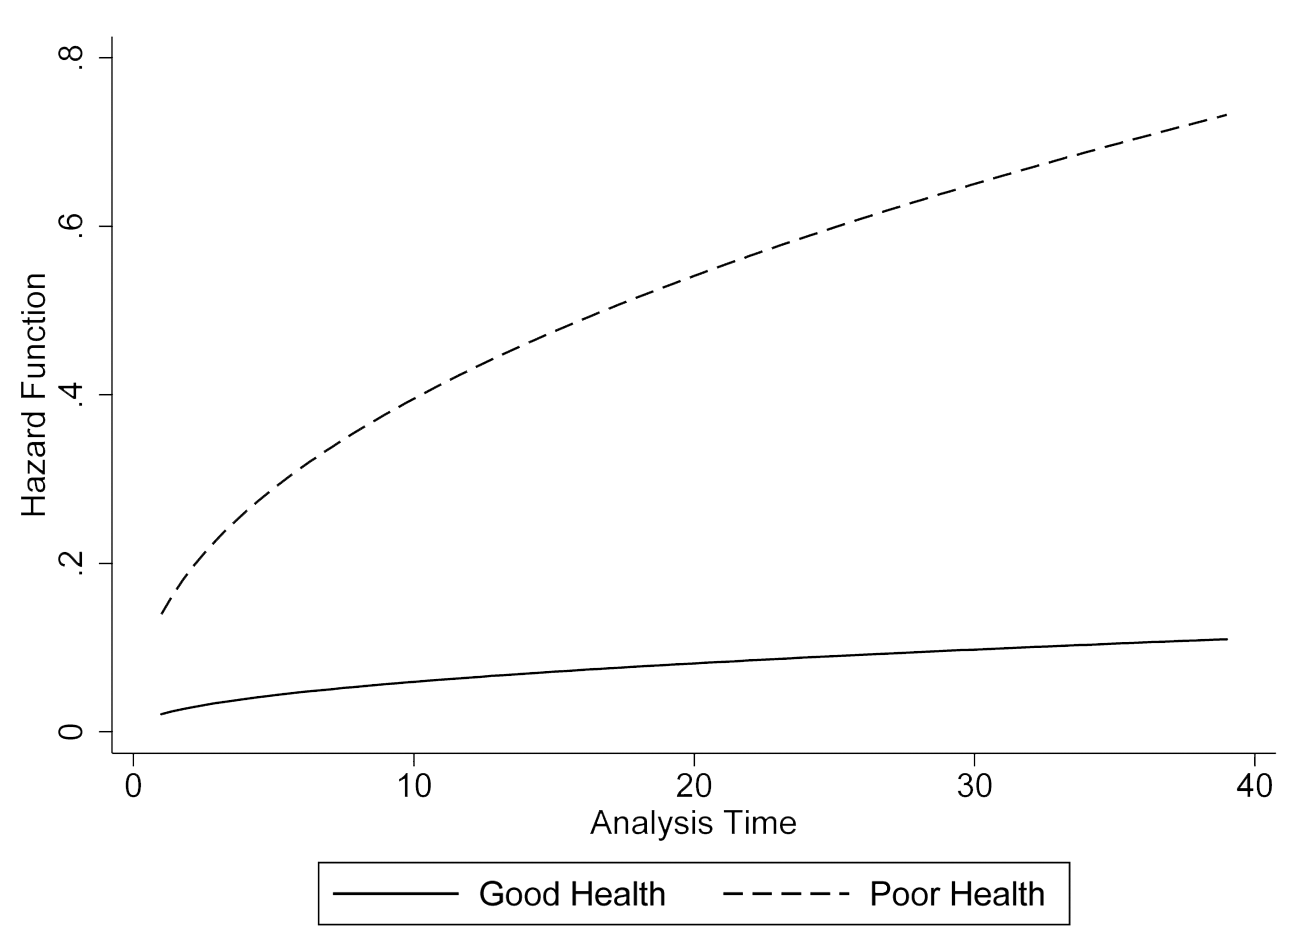
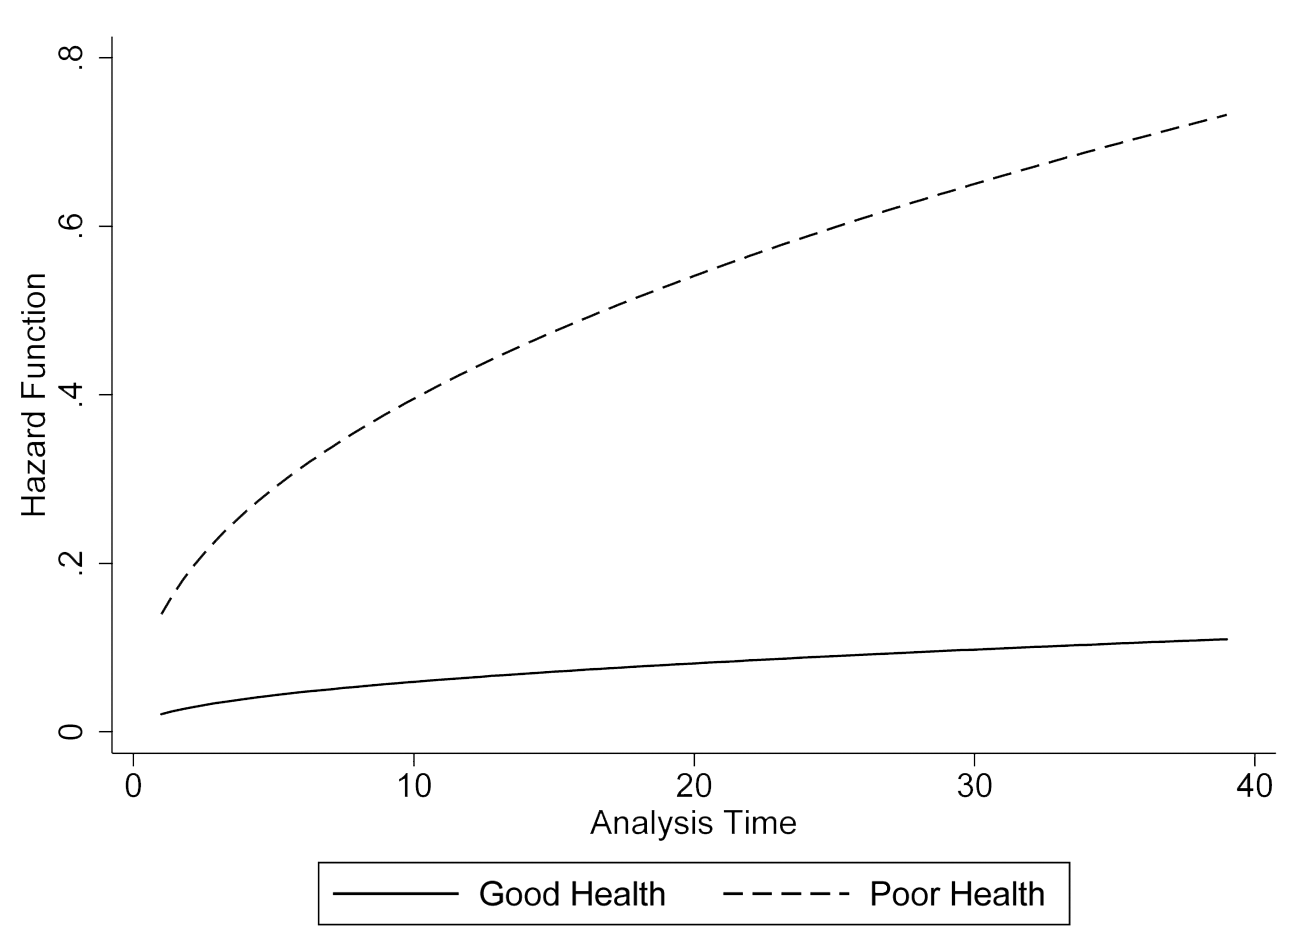
Graph of changes in the hazard rate due to poor health. This graph represents the substantive changes to the hazard rate (i.e., the likelihood that an individual retires at time t) related to the health of the judge. The solid line represents judges in good health (i.e., where the dummy variable Poor Health = 0), and the dashed line represents judges in poor health (i.e., where Poor Health = 1). Examining this graph reveals that judges in poor health are substantially more likely to retire than healthy judges, even accounting for the amount of time on the bench (the x-axis).
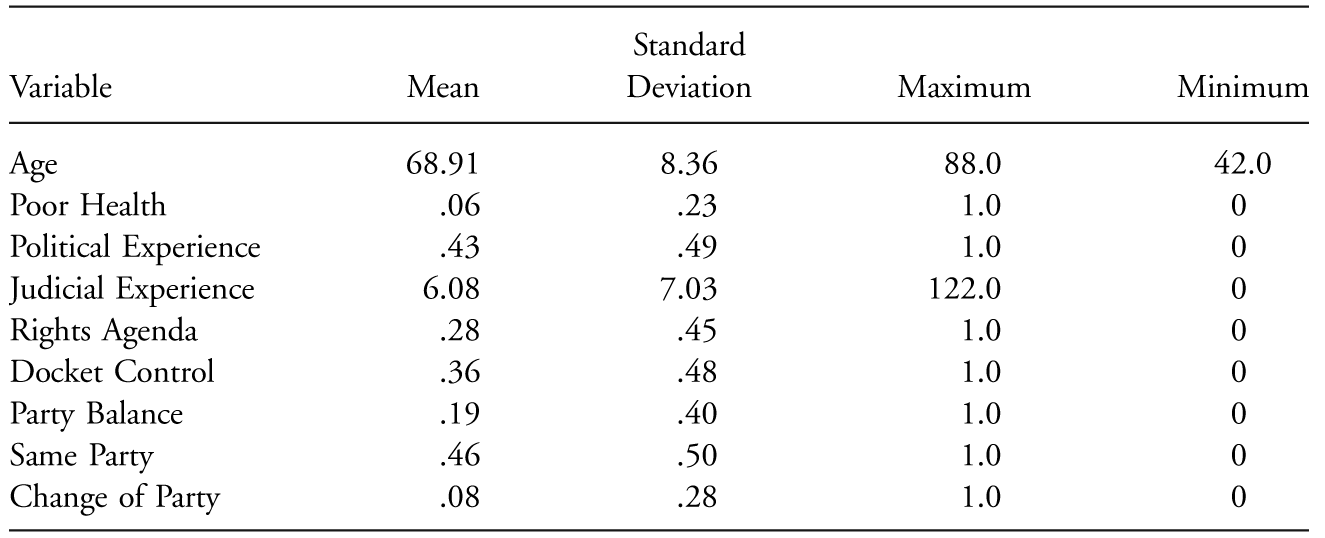
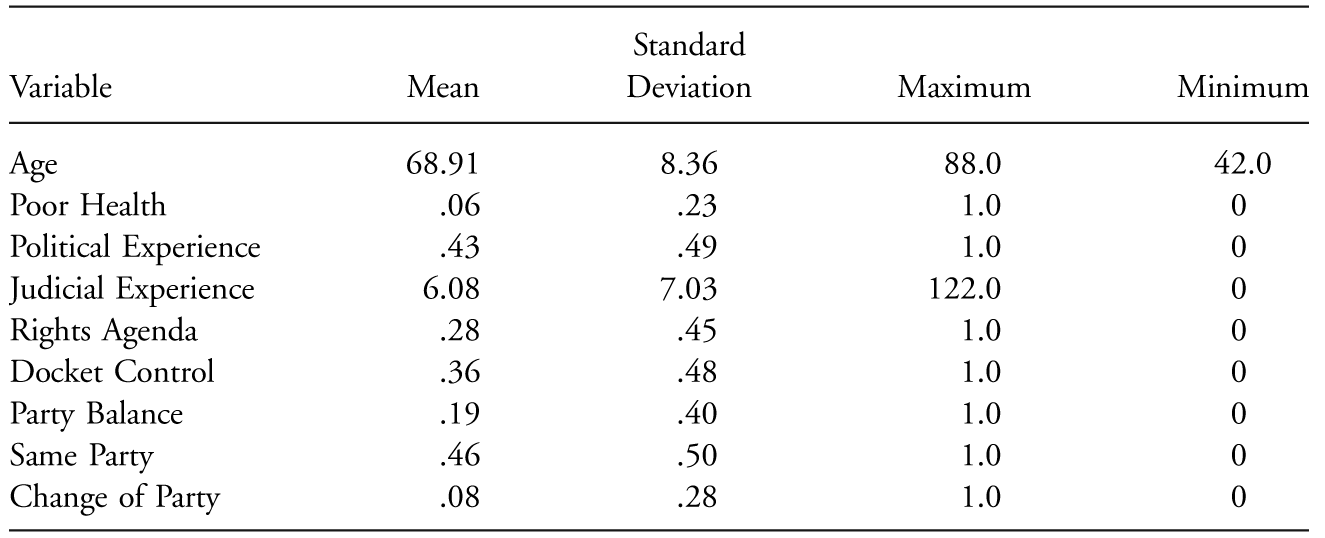
Note—These descriptive characteristics focus on data related to the Supreme Court of Canada from 1875–2009.
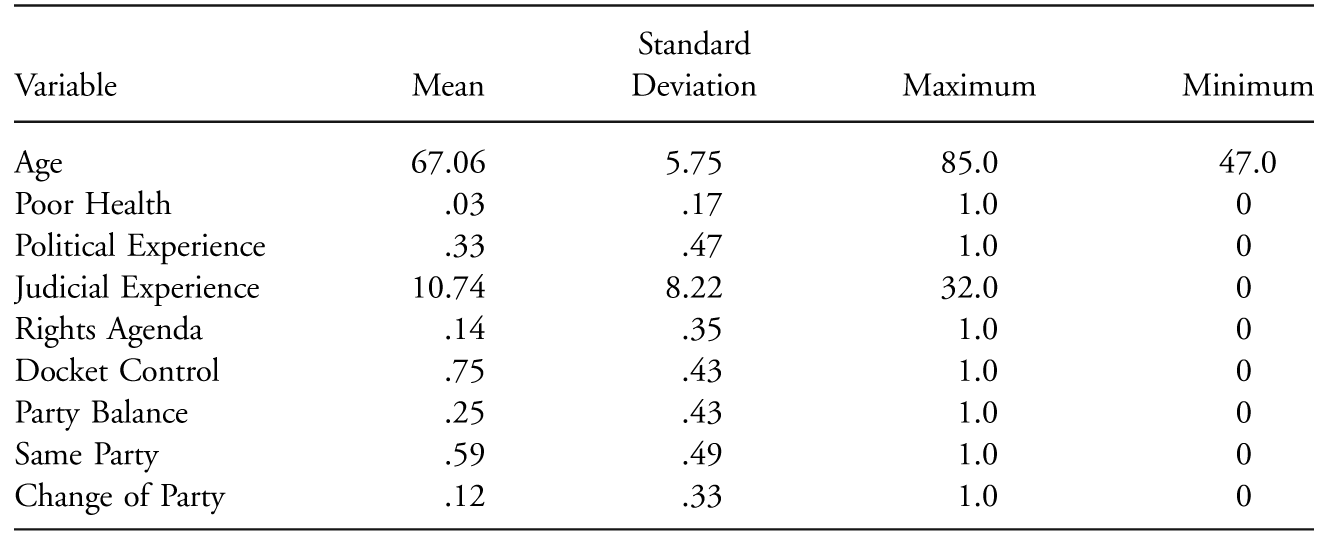
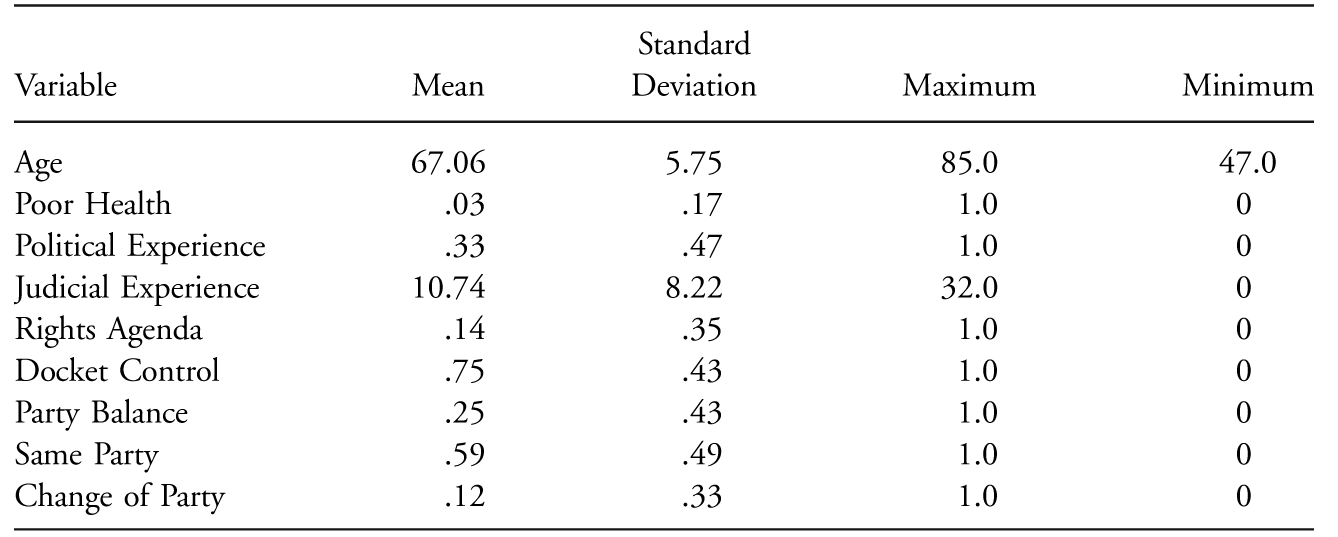
Note—These descriptive characteristics focus on data related to the English House of Lords from 1876–2009.
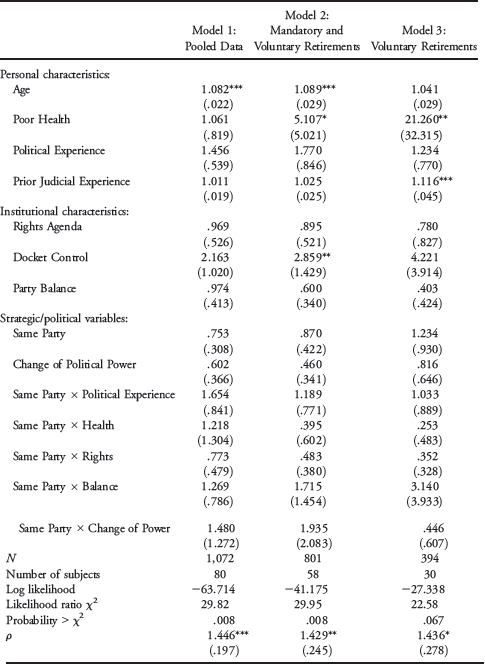
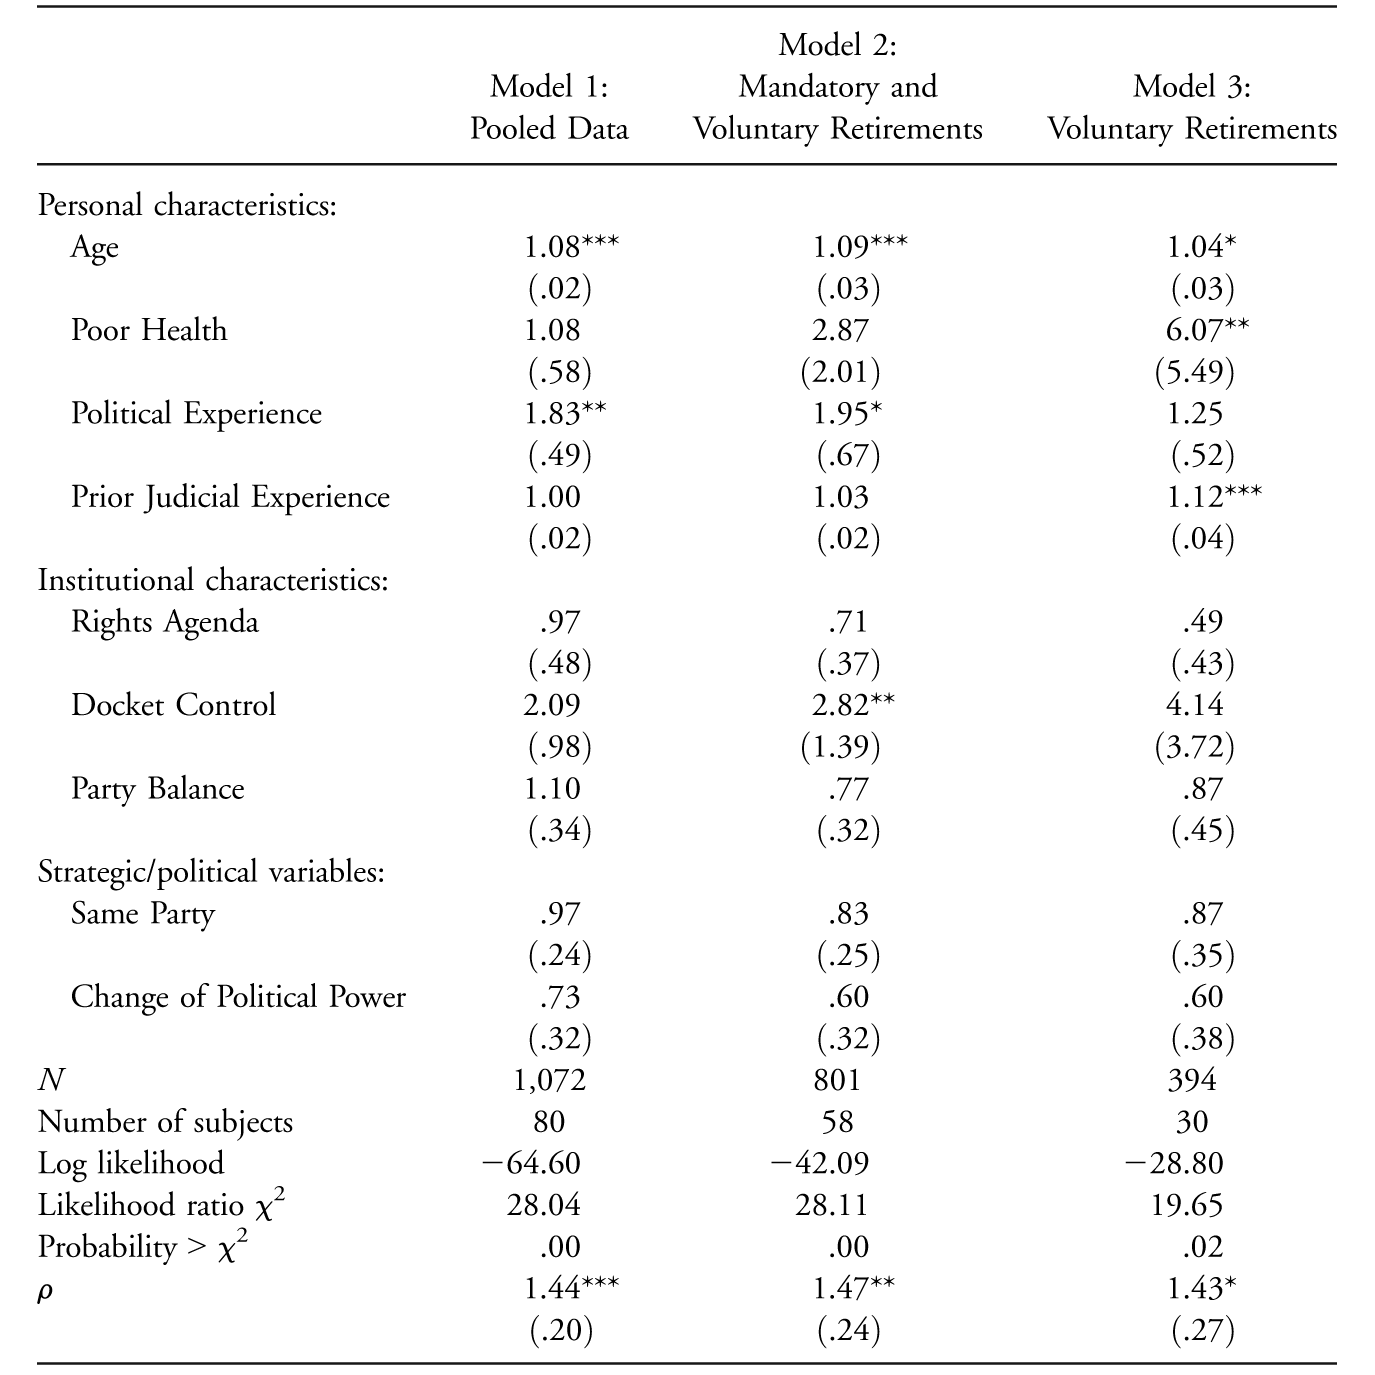
Note—The cells represent the hazard ratios of the results from a Weibull regression examining the number of years until departure from the Supreme Court of Canada, with the standard errors in parentheses.
* p < .10.
** p < .05.
*** p < .01.
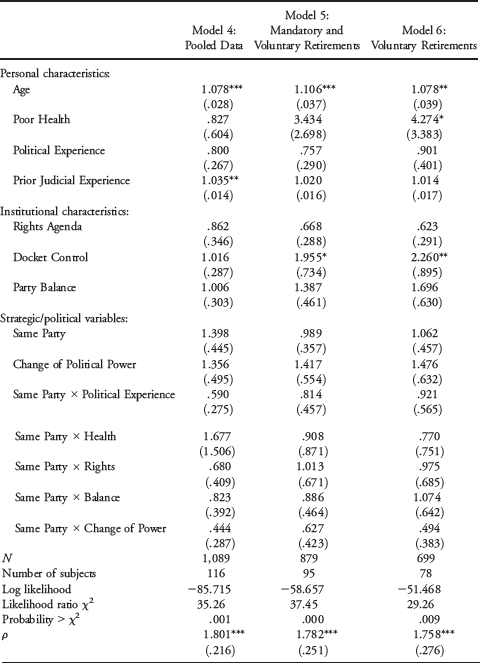
Note—The cells represent the hazard ratios of the results from a Weibull regression examining the number of years until departure from the English House of Lords, with the standard errors in parentheses.
* p < .10.
** p < .05.
*** p < .01.
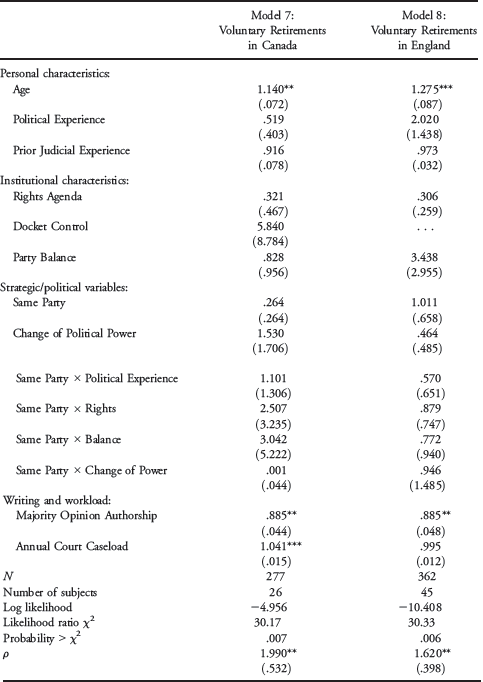
Note—The cells represent the hazard ratios of the results from a Weibull regression examining the number of years until departure, with the standard errors in parentheses. Data for Canada consist of the years 1973–2011, and data for England cover 1947–2010.
* p < .10.
** p < .05.
*** p < .01.