


Introduction
The divergent behavior of the North and South Klawatti glaciers has significant implications for case studies of glacier response to climate change and to regional studies of glacier behavior. Once we understand the response of glaciers to influences other than climate change, perhaps we can determine how glaciers respond to changes in climate.
The two glaciers are adjacent along the crest of the North Cascade Mountains in Washington state, U.S.A., about 135km north-east of Seattle (Fig. 1). Two topographic maps were made for the glaciers by precise mapping techniques applied to aerial photographs taken in September of 1947 and 1961. Comparison indicated that North Klawatti Glacier had thinned by 8.3 m (averaged over the surface area) whereas South Klawatti Glacier thickened by an average of 5.8 m (Meier, Reference Meier1966). This contrary behavior is puzzling because the glaciers are similarly oriented, have similar altitude ranges (1600–2400 m for North Klawatti Glacier and 1700–2500 m for South Klawatti Glacier), and have similar areas (1.61 and 1.89 km2 respectively). In addition, because of their small size, the glaciers are affected by the same mesoscale climate. The local climate seems to be similar for both because their equilibrium lines are at the same altitude.
Examination of their topography revealed that their most distinguishing characteristic is the distribution of glacier area with altitude (Fig. 2). The mean altitude of North Klawatti Glacier is 2060 m, whereas that of South Klawatti Glacier is 2265 m. These differences in area distribution may account entirely for the large dissimilarities in mass change during the 1947–61 period. This paper explains the difference in mass accumulation between the Klawatti glaciers in terms of their different area distribution with altitude and presents a technique to estimate the balance–altitude function from time-spaced topographic maps of adjacent glaciers. Before it can be determined whether the area–altitude distributions are the cause of the different mass changes, the relation between balance and altitude must first be calculated.
Balance-Altitude Approximation
The distribution of a glacier’s mass balance with altitude is a crucial link in the glacier–climate relation. The dependence of balance on altitude is established by meteorological processes that control the volume and distribution of snow accumulation, and by incoming solar energy that causes melting of ice and snow. The balance–altitude relation and the area–altitude distribution of a glacier determine the annual loss or gain in mass and thus define the extent and geometry of the glacier.
The annual mass balance at any point on a glacier is the yearly difference between accumulation and ablation. The shape of the balance–altitude curve is dependent on how accumulation and ablation change as altitude changes. Most observed relations are quite erratic on a local scale, partly because of measurement errors, but primarily because of the spatially-variable accumulation or ablation patterns on small mountain glaciers (Kuhn, Reference Kuhn1981).
On the average, the balance–altitude function has a distinct shape for each mountain glacier. Generally, below the equilibrium line the balance–altitude function has a positive slope and often can be approximated by a straight line. This pattern results from the retreat of the snow line that exposes ice of lower albedo, which increases ablation (Armstrong, this volume). The relative magnitude of ablation at each location then is a function of the length of time the ice surface was exposed to the sun. The rate of retreat is controlled primarily by the thickness of the accumulated snow and the solar energy input in the summer. Above the equilibrium line the balance–altitude function probably is related to the winter accumulation gradient because, for most glaciers, the accumulation variation with altitude is greater than the variation in heat sources and albedo.
North (right) and South Klawatti glaciers, Washington State. The former terminus positions are shown. The 1988 terminus position for North Klawatti Glacier is approximately the same as in this photograph and South Klawatti Glacier terminus position is as shown. The photograph was taken on 14 August 1984.

For glaciers such as South Cascade Glacier, Washington, and Gulkana Glacier, Alaska, the balance–altitude function reaches a maximum at an altitude lower than the head of the glacier, then decreases slightly at higher altitudes (Reference Meier, Tangborn, Mayo and PostMeier and others, 1971). This decrease can be explained, at least partially, by accumulation processes. The upper part of a glacier often is more exposed, and the snow it receives may be partly removed by wind. Another possible cause for this increase in balance may be that greater amounts of solar radiation are received by the less shaded higher altitudes; thus ablation is slightly greater at higher altitudes on some glaciers. However, glaciers such as the Blue Glacier, Washington, and Saskatchewan Glacier, British Columbia, Canada, exhibit a fairly consistent balance gradient over their entire length (Reference Meier, Tangborn, Mayo and PostMeier and others, 1971). For Blue Glacier, Armstrong (Reference Armstrong1990, this volume) asserts that the linear balance gradient in the accumulation zone is a result of a large winter precipitation gradient.
The balance–altitude function may be approximated by simple mathematical curve. Finsterwalder (Reference Finsterwalder1954) suggested that a quadratic form well approximates the balance versus altitude function, and Lliboutry (Reference Lliboutry1955) suggested a linear form. Based on measurements of the balance–altitude relation (Reference Meier, Tangborn, Mayo and PostMeier and others, 1971), the quadratic form is the best initial approximation:

where b(z) is the mass balance as a function of altitude z; and p, q, an r are constant coefficients.
The climatic conditions seem similar for both glaciers on the basis of observations of their equilibrium-line altitudes (ELA). Therefore, we assume the same balance–altitude relation for each glacier. The average annual mass change for each glacier then can be calculated:

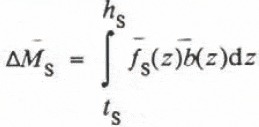
where ∆ M is the average annual mass change expressed as average surface altitude change in water equivalent, f is the time averaged area–altitude fraction and equal to:

where Ā is the time averaged area below altitude z, and A total is the total area of the glacier, b is the average annual balance for the time period between maps, h is the altitude of the glacier’s head and t is the altitude of the terminus. The subscripts n and s indicate North Klawatti and South Klawatti glaciers, respectively. Use of the average area–altitude distribution for the time period between maps removes the time dependence from Equations (2) and (3). The mass change and average area–altitude fractions are known from the two topographic maps; therefore, b(z) remains to be calculated.
The estimated mean balance–altitude curve for 1947–61. The area fractions for each 50-m altitude interval, used in the determination of the mean balance–altitude function, b(z), are shown for each glacier.

The coefficients of the balance function (Equation (1)) p, q, and r are unknown. The solution requires a third equation to close the problem. Fortunately, the mass change at the equilibrium line is known and provides the third equation:

where z 0 is the time average altitude of the equilibrium line. Equations (2), (3), and (4) were solved simultaneously for the coefficients p, q, and r, using the average annual mass change of


The resulting curve (Fig. 2) compares favorably to measured balance–altitude curves found in Meier and others (Reference Meier, Tangborn, Mayo and Post1971). The altitude of maximum balance, determined by d b /dz = 0, is equal to −q/2p (2350 m).
The mean ELA was determined by an analysis of aerial photographs, taken just before the start of the accumulation season, for 8 of the 14 years between maps. A mean altitude of 2040 m is considered a reliable value for both glaciers during 1947–61.
Activity Index
The slope of b (z) at the equilibrium line,

is the activity index (AI) (Meier, Reference Meier1961) or the energy of glacierization (Shumskiy, Reference Shumskiy1946). For the Klawatti glaciers the AI is 5 mm m−1. Blue Glacier, which is about 160 km south-west of the Klawatti glaciers, is in approximate equilibrium and has an activity index of 7 mm m−1 (Armstrong, 1990, this volume).
Steady-State Conditions
Examination of the effect of shifting the b(z) function to achieve a steady-state condition for these glaciers (mean annual balance equal to zero) is instructive. The balance-altitude curve can be shifted in altitude, b(z) = b 0(z + z i), and/or in balance, b(z) = b 0(z) + b i. Based on field data the balance shift seems to be a more physically real approximation (Reference Meier and TangbornMeier and Tangborn, 1965; Armstrong, this volume). If the b (z) curve, determined for the Klawatti glaciers, is shifted by the mean (1947–61) annual balance for each glacier, the integral of the balance–altitude and area–altitude distribution will equal zero, a steady-state condition (Fig. 3):

The 1947–61 average balance–altitude relation, b(z), and the steady-state b(z) curves for North and South Klawatti glaciers. The steady-state profiles are the result of shifting the 1947–61 mean, b(z), along the balance axis by the value of the mean annual balance for each glacier during this period.

Values of the Equilibrium-Line Altitude (ELA), Mean Annual Mass Balance (Δ/M), and Activity Index (AI) for each Glacier

where ∆ M i is the mean (1947–61) annual balance, and equals 0.37 m for South Klawatti Glacier and −0.53 m for North Klawatti Glacier. The steady-state ELA is calculated from

For North Klawatti Glacier, the steady-state ELA would be lower than its existing altitude (1952 m) by only 88 m and the ELA (2125 m) for South Klawatti Glacier would need to be raised only 85 m to maintain a steady-state profile. In addition, the AI for each glacier would have a new value corresponding to the change in slope of b(z) at the steady-state ELA. The steady-state AI for South Klawatti would be 4 mm m−1; an approximate 20% decrease in activity from the 1947–61 average. The steady-state AI for North Klawatti would be 7 mm m−1, corresponding to an approximate 40% increase (Table I).
Glacier Changes After 1961
No topographic map of the Klawatti glaciers has been made since 1961 so no quantitative comparison with the maps made during 1947–61 can be made. However, intermittent aerial photographs of the glaciers show terminus positions and equilibrium lines. In the late 1950s the termini of the two glaciers were joined. By 1965, the active termini were connected only by a thin, dead ice mass. From their maximum extent in 1961 to their 1988 positions, North Klawatti retreated about 450 m, and South Klawatti about 300 m.
The ELAs were estimated from approximately ten photographs taken in late September or October, near the end of the ablation season, in years since 1961. Although the estimates were approximate, the ELA seemed unchanged since that time. The ELA for both glaciers was located at about 2050 m, which is very similar to the estimate of 2040 m for 1947–61.
The retreat of South Klawatti Glacier after 1961 may seem to contradict what one would expect from its average positive mass balance during the 1947–61 period. Tangborn (Reference Tangborn1980) reconstructed the mass balance for the glacierized part of the Thunder Creek Basin, which includes the Klawatti glaciers. His estimates show that the basin glaciers, as a whole, generally gained mass from 1947 to 1955, and in 1957 started to lose mass. The recession of South Klawatti Glacier is the expression of this mass loss.
Given the new altitude of the termini, the estimated balance–altitude curve, and the same ELA, are the glaciers near equilibrium? Examination of the aerial photographs since 1961 did not show appreciable change in the position of the margins of the accumulation zone and upper ablation zone, which indicates that the same altitude–area distribution, after correcting for termini recession, could be used as a first estimate. Because the ELA has not significantly changed, the same mean balance–altitude function, b, also was used. Using Equations (2) and (3) to solve for the mass loss, ΔM, results in 0.08 m year−1 water equivalent for North Klawatti and 0.47 m year−1 water equivalent for South Klawatti Glacier. Given the large, but uncertain, error in these estimates, North Klawatti can be considered in equilibrium. The larger, positive mass balance for South Klawatti is, at first, puzzling.
The mass balance–altitude curve was calculated for a period when both glaciers were in extended positions. Since that time North Klawatti Glacier retreated up valley, whereas South Klawatti Glacier has retreated up the valley wall and now terminates in an ice fall. South Klawatti also undergoes additional mass loss due to ice calving, a process not active during the period for which the mass balance-altitude curve was developed; therefore, the mass balance is overestimated. Unfortunately, the calving rate cannot be estimated using available information and the status of the glacier relative to equilibrium cannot be ascertained.
Conclusions
A quadratic representation of the balance–altitude relation of a glacier seems to be a reasonable approximation. A single b(z) function can account for the very divergent behavior of the adjacent Klawatti glaciers of the North Cascades. The resulting activity index of 5 mm m−1 compares well to that of Blue Glacier with an index of 7 mm m−1. A shift of the balance–altitude curve along the balance axis to produce the balance–altitude curve of a steady-state glacier indicates that a change in the equilibrium-line altitude of about 90 m would be sufficient to produce equilibrium conditions for both glaciers. On the basis of the balance–altitude curve and a correction to the area–altitude distribution of ice that were based on photographic estimates of terminus position. North Klawatti Glacier appears to be near equilibrium as of 1988. Because South Klawatti Glacier terminates in an icefall its mass-balance status is uncertain.
Acknowledgement
The authors thank D. Trabant of the U.S. Geological Survey, Fairbanks, Alaska, whose review resulted in a significant improvement in the clarity of this paper.



