Implications
Grazed grass is the cheapest feed available; its inclusion in the diet of the early lactation cow has previously been shown to increase farm profitability. However, grass growth in spring is extremely variable and periods of deficit can be encountered, particularly during the first two grazing rotations (which corresponds to the first 10 weeks of lactation of spring-calving dairy cows). This experiment has shown that a post-grazing sward height of 3.5 cm should be targeted to ensure that there is no reduction in early lactation milk production.
Introduction
Dairy production systems that efficiently convert pasture into milk, through maximising grass utilisation, are most profitable, as grazed grass can supply nutrients to dairy cows at a lower cost than alternative feeds in cool temperate regions (Finneran et al., Reference Finneran, Crosson, O’Kiely, Shalloo, Forristal and Wallace2012). The greatest opportunities to increase the contribution of grazed grass to the dairy cow diet exist in early spring and late autumn; however, spring grass growth can be extremely variable resulting in deficits in grass supply (McCarthy et al., Reference McCarthy, Pierce, Delaby, Brennan, Fleming and Horan2012).
A number of strategies exist to overcome the reduced availability of grass in spring, such as delaying calving date to coincide with the onset of grass growth (Dillon et al., Reference Dillon, Crosse, Stakelum and Flynn1995). However, in order to target a 300-day grazing season (O’Donovan et al., Reference O’Donovan, Lewis and O’Kiely2011), cows must graze into late autumn, a period when climatic conditions are more variable and sward quality is lower than in spring (McCarthy et al., Reference McCarthy, Delaby, Pierce, Journot and Horan2010). Perhaps a more feasible approach is to impose a lower post-grazing sward height (PGSH) in spring until grass growth and availability increase. Current Irish recommendations for spring-calving cows are to graze pastures directly post-calving (Kennedy et al., Reference Kennedy, O’Donovan, Murphy, Delaby and O’Mara2005) to a PGSH of 3.5 cm (Ganche et al., Reference Ganche, Delaby, O’Donovan, Boland, Galvin and Kennedy2013b). Furthermore, dairy cow dry matter intake (DMI) is at its lowest following parturition (Ingvartsen and Andersen, Reference Ingvartsen and Andersen2000), it then increases by ~1 kg/week up to week 8, when intake plateaus (Lewis et al., Reference Lewis, O’Donovan, Kennedy, O’Neill and Shalloo2011). The natural physiological state of the cow during this period may facilitate lower quantities of herbage being offered. The ability of the early lactation dairy cow to reduce milk yield in accordance with reduced energy intake is apparent (Ganche et al., Reference Ganche, Delaby, O’Donovan, Boland, Galvin and Kennedy2013b). However, as a deficit in grass supply can also occur in late spring because of the prevailing climatic conditions, it is necessary to investigate the effects of restricting DMI several weeks into lactation. Burke et al. (Reference Burke, Williams, Hofmann, Kay, Phyn and Meier2010) found that a severe restriction of DMI for 14 days at the onset of the breeding season reduces milk yield and protein concentration, and has a negative effect on subsequent milk production and protein concentration.
Maintaining a constant PGSH (Ganche et al., Reference Ganche, Delaby, O’Donovan, Boland, Galvin and Kennedy2013b) rather than imposing a restrictive daily herbage allowance (DHA), which allows PGSH to fluctuate (Friggens et al., Reference Friggens, Emmans, Kyriazakis, Oldham and Lewis1998; Wales et al., Reference Wales, Doyle and Dellow1998; McEvoy et al., Reference McEvoy, Kennedy, Murphy, Boland, Delaby and O’Donovan2008), ensures that sward utilisation is maximised (Ganche et al., Reference Ganche, Delaby, O’Donovan, Boland, Galvin and Kennedy2013b). However, Lee et al. (Reference Lee, Donaghy and Roche2008) reported decreased grass production with extreme defoliation heights of 2 cm. Pasture quality in subsequent rotations (Holmes et al., Reference Holmes, Hoogendoorn, Ryan and Chu1992) can also be improved with lower PGSH.
The main objectives of the present study were (1) to establish the consequence of timing and duration of two PGSH on the immediate, subsequent and total lactation milk production performance, DMI, BW and body condition score (BCS) of spring-calving dairy cows, and (2) to investigate the effects of severe (2.7 cm) and moderate (3.5 cm) PGSH imposed during early spring on the sward characteristics during the grazing season.
Material and methods
The experiment was conducted at the Teagasc Animal & Grassland Research and Innovation Centre, Moorepark, Fermoy, Co. Cork, Ireland (50° 16’N; 8°25’W). The soil type was a free-draining acid brown earth of sandy loam-to-loam texture. The area used for the experiment was a predominately perennial ryegrass (Lolium perenne L.) permanent grassland site; swards were on average 5-years old. The dominant cultivars originally sown in the experimental area were late-heading diploid cultivars – Twystar, Gilford, Aston Energy and Tyrella. Swards were sown as mixtures containing three to four of these cultivars. Clover was incorporated in ~4.66 ha (22%) of the area at sowing; the cultivars sown were Chieftain and Crusader.
Experimental design and animals
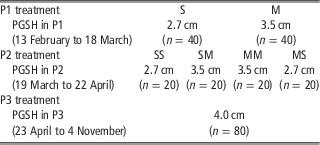
The experiment was a randomised block design with a 2×2 factorial arrangement of treatments. The experiment was separated into three periods. In Period 1 (P1), cows were randomly assigned, pre-calving, to one of the two (n=40) PGSH treatments severe (S; 2.7 cm) and moderate (M; 3.5 cm) from 13 February to 18 March 2012 (5 weeks). Following P1, animals were re-randomised within P1 treatments to graze to either 2.7 or 3.5 cm. Half of the cows from each P1 treatment remained assigned to their original (P1) PGSH treatment, whereas the other half of the cows changed to the opposing treatment – S (2.7 cm) and M (3.5 cm). Period 2 (P2) was conducted from 19 March to 22 April (5 weeks; weeks 6 to 10 of the experiment). This resulted in a total of four treatments at the end of the 10-week period: (i) cows that grazed to 2.7 cm during P1 and P2 (SS); (ii) cows that grazed to 2.7 cm during P1 and 3.5 cm during P2 (SM); (iii) cows that grazed to 3.5 cm during P1 and P2 (MM); and (iv) cows that grazed to 3.5 cm during P1 and 2.7 cm during P2 (MS; Table 1).
Description of the experimental treatments and cow numbers

PGSH=post-grazing sward height.
Following P2, cows grazed across all of the experimental area, the mean DHA and target post-grazing height (4 cm) were the same for all the treatments for the remainder of lactation (P3; 23 April to 4 November) to enable the investigation of the carryover effects of early lactation treatments on milk yield and composition, BW and BCS.
Animals
A total of 80 Holstein–Friesian (HF; n=48) and Norwegian Red×Jersey×HF (n=32) dairy cows were selected from the Moorepark general spring-calving herd. In all 32 cows were primiparous, whereas the remaining 48 cows were multiparous (22 cows in their second lactation and 26 cows in their third or greater lactation). All animals were balanced on the following basis: breed; calving date (6 February; s.d. 1.2 days); lactation number (2.04; s.d. 0.103); dam’s first lactation milk yield and composition (first 36 weeks) for the primiparous cows and previous lactation milk yield and composition for the multiparous cows (4792; s.d. 44.1 kg/cow); milk fat (4.46; s.d. 0.047%), protein (3.61; s.d. 0.014%) and lactose (4.66; s.d. 0.020%) concentrations; BW (466; s.d. 3.8 kg); and BCS (2.95, s.d. 0.015).
Pasture and herd management
The total experimental grazing area (21 ha) was divided into two blocks of equal size on the basis of soil fertility, grass cultivar and sward age. Within each block, paddocks were randomly assigned to one of the two early lactation treatments (P1; 2.7 or 3.5 cm). There were 12 paddocks (which ranged in size from 1 to 4 ha) in each block; all the paddocks were divided with a permanent electric fence. There were multiple access points and water troughs within each paddock, which facilitated grazing daily areas and ensured that cows did not have access to areas grazed during the previous days. The same rotation length was imposed for all the treatments during the experiment.
Following P1, the paddocks were re-randomised within their P1 treatment, half of the paddocks changed treatment similar to the cow treatments. A stocking rate (SR) of 3.31 cows/ha per treatment was imposed in early lactation (P1 and P2). In all three paddocks were selected from the total grazing area and were used as ‘base paddocks’ to carry out additional sward measurements throughout the experiment. Base paddocks were grazed during every rotation – that is, they were not harvested for silage or mechanically topped throughout the year; consequently, these paddocks were used to measure cumulative grass dry matter (DM) production and grass growth under grazing. Daily herbage allocations were divided into two equal portions and cows were offered fresh grass following each milking in P1 and P2 and on a 24-h basis during P3. The treatment areas (10.5 ha/treatment) for each of the experimental herds were managed independently throughout P1 and P2.
DHA was measured above 2.7 cm in P1 and P2 and above 3.5 cm in P3, as these were the lowest targeted PGSH in each of the respective periods. In order to achieve the desired PGSH, DHA fluctuated throughout the experiment because of differences in daily herbage mass (HM) and cow demand. If the residual height deviated from the desired target PGSH, cows remained in their previous day’s grazing area for a maximum of 3 h by which time the target PGSH was achieved. Throughout the experiment, when grass supply was unable to fully meet animal feed demand for one of the treatments, animals from all treatments were supplemented with equal amounts of concentrate. The concentrate contained 25.0% wheat, 15.0% soya hulls, 10.0% extracted rapeseed, 10.0% extracted sunflower seed, 10.0% palm kernel expeller, 6.0% milk solids, 5.0% maize gluten feed, 5.0% citrus pulp, 5.0% soyabean meal, 4.0% oat feed, 0.5% palm oil, 4.0% Cal-Mag and 0.5% protected trace elements on a DM basis (Glanbia, Clonroche Co. Wexford, Ireland). Each treatment grazing area received an equal amount of fertiliser (nitrogen, 250 kg N/ha; phosphorus 16 kg P/ha and potassium 35 kg K/ha). Surface damage was minimised by removing animals from the pasture during periods of excessive rainfall. During these climatic conditions, animals grazed for a minimum of 3 h after each milking (Kennedy et al., Reference Kennedy, McEvoy, Murphy and O’Donovan2009). No additional feed was offered when they returned indoors.
Sward measurements and herbage composition
HM determination
HM for each treatment paddock was calculated (above 2.7 cm in P1 and P2, and above 3.5 cm in P3) by mowing two strips with a motorised harvester (Etesia UK Ltd, Warwick, UK) twice weekly as described by Delaby and Peyraud (Reference Delaby and Peyraud1998). Before and after mowing, grass height measurements were recorded using a folding pasture plate metre with a steel plate (diameter 355 mm and 3.2 kg/m²; Jenquip, Fielding, New Zealand). All mown herbage from each strip was collected, weighed and sub-sampled. An herbage sample of 100 g fresh weight was dried for 16 h at 90°C for DM determination.
HM above ground level was measured within the strip cut for HM determination, by harvesting, to ground level, the herbage that remained following HM determination using a 0.5×0.2 m quadrat and a scissors. All the collected samples were washed to remove any soil contamination and dried for 16 h at 90°C in a forced-draught oven to determine DM. HM measurement above ground level was undertaken in all base paddocks during the grazing season and also during the DMI measurement periods. In P3, post-grazing HM was determined twice weekly by cutting one 20-m long strip to 3.5 cm with the Agria machine (Etesia) in the area where cows had grazed the previous day. The methodology used to calculate post-grazing DM yield is identical to that described above for pre-grazing HM.
Pre- and post-grazing sward heights
Pre- and post-grazing compressed sward heights were measured daily throughout the experimental period by recording ~40 heights/treatment across the two diagonals of each paddock prior and subsequent to grazing using a folding pasture plate meter (as described previously).
HM utilisation
Herbage utilisation was calculated as described by Delaby and Peyraud (Reference Delaby and Peyraud1998), using the pre-grazing HM relative to the post-grazing HM.
Herbage utilisation (%)=(pre-grazing HM−post-grazing HM)/pre-grazing HM
Herbage production and grass growth
For each treatment, herbage DM production between rotations (i.e. each time a paddock is grazed sequentially it is called a rotation) n-1 and n were calculated as described by Delaby and Peyraud (Reference Delaby and Peyraud1998), using the weekly pre-grazing and post-grazing HM corrected to 2.7 (in P1 and P2) or 3.5 cm (in P3) as follows: pre-grazing HM (rotation n) – post-grazing HM (rotation n-1). Paddock cumulative herbage production was calculated by summing herbage production from each rotation and by including silage harvest DM yields. Daily grass growth (kg DM/ha per day) was calculated by dividing the grass production figure by the number of days re-growth.
Sward profile
The morphological composition of the sward was determined at the start of each grazing rotation from the base paddocks of each treatment; 20 handfuls of herbage (~150 g) were cut to the ground level with a pair of scissors before grazing, and vertical distribution was maintained. The sample was later cut into two portions, above and below 2.7 (in P1 and P2) or 3.5 cm (in P3). Each individual layer was then separated into leaf, stem (including true stem, pseudostem and flower head if present), dead material and non-perennial ryegrass material (clover, weeds, etc.). Subsequently, each layer was dried for 16 h at 90°C for DM determination. This allowed the leaf, stem, dead proportions and yields to be calculated.
Chemical analysis
Herbage samples were manually collected on a weekly basis using Gardena hand shears (Accu 90; Gardena International GmbH, Ulm, Germany) following close observation of each treatments’ defoliation height to collect a representative sample of the herbage grazed. Herbage samples were frozen at −20°C after collection. They were subsequently bowl chopped, freeze-dried and milled through a 1-mm screen and stored for chemical analysis. Samples were analysed for DM, ash (AOAC, 1995; method 942.05), ADF and NDF (determined using the procedures of AOAC, 1995; method 973.18; using sodium sulphate for the NDF; ANKOM™ Technology, Macedon, NY, USA), CP (Leco FP-428; Leco Australia Pty Ltd) and organic matter digestibility (OMD; using the method described by Morgan et al. Reference Morgan, Stakelum and Dwyer1989; Fibertec™ Systems, Foss, Ballymount, Dublin, Ireland). The concentrate offered was analysed for DM content, nitrogen, crude fibre and ash concentrations using near infrared reflectance spectroscopy (model 6500; Foss-NIR System DK, Hillerød, Denmark).
Animal measurements
Milk production
Milking took place at 0700 and 1600 h daily. Individual milk yields (kg) were recorded daily at each milking (Dairymaster; Causeway, Co. Kerry, Ireland). Milk fat, protein and lactose concentrations were calculated weekly from one successive evening and morning milking sample for each animal. The concentrations of these constituents in the milk were determined by using Milkoscan 203 (Foss Electric DK, Hillerød, Denmark). Total lactation milk solids yield was calculated using the following equation to calculate weekly values and then summing all the weekly values together: ((cumulative weekly milk yield÷7)×milk fat concentration determined as described above)+((cumulative weekly milk yield÷7)×milk protein concentration determined as described above). Total lactation milk yield was calculated by summing the total production of each week of lactation together.
BW and BCS
BW and BCS were recorded weekly throughout the experimental period. An electronic portable weighing scale with the Winweigh software package (Tru-test Limited, Auckland, New Zealand) was used to record BW. Body condition was scored by one experienced independent observer on a scale from 1 to 5 (where 1=emaciated, 5=extremely fat) with 0.25 increments (Lowman et al., Reference Lowman, Scott and Somerville1976).
Intake estimation
Individual grass dry matter intake (GDMI) was estimated four times during the experiment (week 5 of P1, week 5 of P2, weeks 5 and 15 of P3) using the n-alkane technique (Dillon and Stakelum, Reference Dillon and Stakelum1989). All cows were dosed twice daily for 12 days before both the morning and evening milking with a paper pellet (Carl Roth, GmbH, Karlsruhe, Germany) containing 500 mg of dotriacontane (C32-alkane). From day 7 to 12 of dosing, the majority of faeces samples were collected opportunistically from each cow twice daily in the paddock or the collecting yard before the morning and evening milking and stored at −20°C. When cows were not observed defecating (typically <10% of the herd), faeces samples were collected by rectal stimulation after milking. The faeces samples were then thawed and bulked (12 g of each collected sample) by cow and dried for 48 h in an oven at 60°C. Samples were then milled through a 1-mm screen and stored for chemical analysis. During the period of faeces collection, the diet of the animals was also sampled daily. Herbage representative of that being grazed by animals was manually collected with a Gardena hand shears (as described previously). Herbage samples were frozen at −20°C following collection. The ratio of herbage C33 to dosed C32 was used to estimate intake. The n-alkane concentrations of the faeces and herbage were determined as described in the study by Dillon (Reference Dillon1993).
Energy balance (EB)
The net energy value required for maintenance, growth and milk production (expressed as Unité Fourragère Lait – UFL; one UFL is defined as the energy contained in 1 kg of air dry standard barley) was calculated for each individual cow at each measurement period according to the equations described by Faverdin et al. (Reference Faverdin, Baratte, Delagarde and Peyraud2011). A UFL requirement for growth was included in the calculation for cows <40-months old. The UFL of the feed was calculated using the OMD values of the herbage offered (Beaumont et al., Reference Beaumont, Dulphy, Sauvant, Meschy, Aufrere and Peyraud2007). EB was estimated as the difference between energy intake and energy required.
Statistical analyses
All statistical analyses were carried out using SAS 9.3 (SAS Institute, 2006). Milk production, GDMI and sward parameters were analysed as three individual periods P1, P2 and P3.
Herbage data from P1 and P2 were analysed by ANOVA. The model included terms for treatment (PGSH 1 to 2), week and their interaction, as well as residual error terms. In P2, the interaction between P1 and P2 was tested.
The analysis of P3 aimed to investigate the carryover effects of P1 and P2 treatments on P3 sward characteristics. The following model was used:
 $$\eqalignno{ {\rm Y}_{{ijkl}} = \mu {\plus}{\rm P12}_{i} {\plus}{\rm P3}_{{ij}} {\plus}{\rm W}_{{ijk}} {\plus}\left( {{\rm P12}_{i} {\times}{\rm P3}_{{ij}} } \right) \cr \quad{\plus}\left( {{\rm P3}_{{ij}} {\times}{\rm W}_{{ijk}} } \right){\plus}{\rm e}_{{ijkl}} $$
where μ is the mean; P12 the P1 and P2 grazing treatment (i=1 to 4), P3 the P3 grazing treatment (j=1 to 4); W l the week (k=1 to 27); P12×P3=the interaction between P1 and P2 treatment and P3 treatment, P3×W the interaction between P3 and week, and e ijkl the residual error term.
The animal data (n=80) were analysed using a repeated measures model in PROC MIXED (SAS Institute, 2006) with experimental week included as a repeated effect. Cow was included as a random effect, whereas parity, treatment and week were included as fixed effects. All interactions between parity, PGSH and week were also included.
For the analysis of P1 variables, the pre-experimental milk yield, milk composition, BW and BCS and days in milk (DIM) were used as covariates. Because of the differences in parity, pre-experimental values were centred within parity before being included in the model; the deviations from the parity mean were used as covariates. The inclusion of individual animal covariates in the model aimed to reduce the residual error term, therefore explaining the greater variations within parity. Daily milk yield, milk constituent yield, milk composition, DMI, BW and BCS were analysed for each period with the following models:
 $$\eqalignno{ {\rm Period \ 1}:{\rm Y}_{{ij}} = \mu {\plus}{\rm L}_{i} {\plus}{\rm P1}_{j} {\plus}\left( {{\rm L}_{i} {\times}{\rm P1}_{j} } \right){\plus}{\rm b}_{{\rm 1}} {\times}{\rm b}_{{ij}} \cr {\plus}{\rm b}_{{\rm 2}} {\rm DIM}_{{ij}} {\plus}{\rm e}_{{ij}} $$
For the analysis of P2 and P3 animal variables, the average milk yield, milk composition, BW and BCS of the last 2 weeks of P1 and P2, respectively, were used as covariates. The covariates were first centred within parity and P1 treatment. A compound symmetry covariance structure was used for the analysis.
 $$\eqalignno{ {\rm Period \ 2}:{\rm Y}_{{ijk}} = \mu {\plus}{\rm L}_{i} {\plus}{\rm P1}_{j} {\plus}{\rm P2}_{k} {\plus}\left( {{\rm P1}_{j} {\times}{\rm P2}_{k} } \right) \cr {\plus}\left( {{\rm L}_{i} {\times}{\rm P2}_{k} } \right) {\plus}{\rm b}_{{\rm 1}} {\times}{\rm b}_{{ijk}} {\plus}{\rm b}_{{\rm 2}} {\rm DIM}_{{ijk}} {\plus}{\rm e}_{{ijk}} $$
 $$\hskip0pc\eqalignno {{\rm Carryover\ period }\ \left( {{\rm P3}} \right): {\rm Y}_{{ijkl}} = \mu {\plus}{\rm L}_{i} {\plus}{\rm P12}_{ij} {\plus}{\rm P3}_{ijk} \cr {\plus}\left( {{\rm L}_{{\rm i}} {\times}{\rm P12}_{ij} } \right){\plus}\left( {{\rm L}_{i} {\times}{\rm P3}_{ijk} } \right) {\plus}\left( {{\rm P12}_{{ij}} {\times}{\rm P3}_{{ijk}} } \right) \cr {\plus}\left( {{\rm L}_{i} {\times}{\rm P12}_{{ij}} {\times}{\rm P3}_{{ijk}} } \right) {\plus}{\rm b}_{{\rm 1}} {\times}{\rm b}_{{\rm 2}_{ijkl}} {\plus}{\rm b}_{{\rm 2}} {\rm DIM}_{{ijkl}} {\plus}{\rm e}_{{ijkl}} $$
where Y ijkl is the analysed variable, μ the mean; L i the lactation number (i=1 to 2), P1 the P1 grazing treatment (i=1 to 2); P2 the P2 grazing treatment (j=1 to 2); P12 the P1 and P2 grazing treatments (j=1 to 4); P3 the P3 grazing PGSH treatment (k=1 to 4); L×P1, L×P2 and L×P3 the interactions between lactation number and P1, P2 or P3 treatment, respectively; P1×P2 the interaction between P1 treatment and P2 treatment; b1×b1ijk and b1×b2ijkl the respective pre-experimental milk output or BW/BCS variables in P1 and P2, respectively; b2DIM ijkl the days in milk (up to 22 April), e the residual error term.
Results
Weather and grass growth
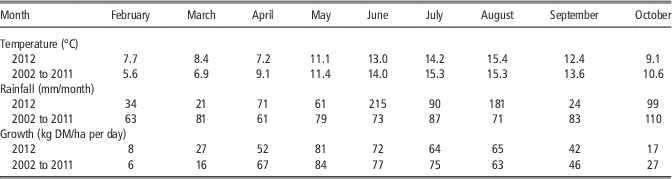
February (−29 mm; 0.54/month) and March (−60 mm; 0.26/month) recorded reduced rainfall when compared with the 10-year average for these months, whereas the months of April, June and August were wetter than the 10-year average (Table 2). Mean air temperatures were on average +1.8°C above the 10-year average (6.3°C) from February to March, and 1.0°C below the 10-year average (12.8°C) between April and October. Grass growth for February and March was above (+2 and +11 kg DM/ha per day, respectively) the average grass growth recorded over the previous 10 years in Teagasc Moorepark (6 and 16 kg DM/ha per day, respectively). All other months except August were below the 10-year average (Table 2).
Grass growth and main climatic data during the total experimental period (13 February to 30 October) compared with the previous 10 years

DM=dry matter.
Pasture measurements and grazing management
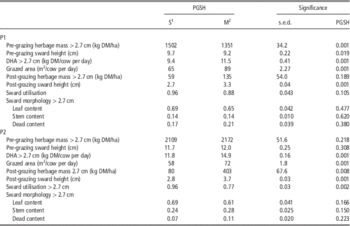
During P1, pre-grazing sward height was +0.5 cm (P<0.05) for the S treatment compared with the M treatment (Table 3). Mean DHA (>2.7 cm; P<0.001) was 2.1 kg DM/cow per day greater for the M than the S cows. Mean concentrate supplementation for both treatments was 3.1 kg DM/cow per day during P1. Cows were supplemented with 4 kg DM/cow per day for the first 16 days of P1 and 3 kg DM/cow per day for the remaining 19 days of P1. The S animals required 27% less area per day (P<0.001) than the M treatment (89 m2/cow per day), and mean PGSH achieved (P<0.001) were 2.7 and 3.3 cm, respectively. Pasture above 2.7 cm utilised by the cow decreased by 8% when PGSH increased from S to M. No differences were observed between treatment swards in terms of leaf, stem and dead proportions above or below 2.7 cm during P1.
Effect of a severe (S) and moderate (M) post-grazing sward height (PGSH) on pre- and post-grazing pasture characteristics during P1 (13 February to 19 March) and P2 (20 March to 22 April)

DHA=daily herbage allowance.
1 S=2.7 cm.
2 M=3.5 cm.
During P2, there was no difference in pre-grazing HM (2141 kg DM/ha) and pre-grazing sward height (11.9 cm; Table 3) between treatments. Mean DHA was 3.1 kg/cow per day greater (P<0.001) for the M than the S cows (11.8 kg/cow per day). Mean concentrate supplementation during P2 was 1.2 kg DM/cow per day for all animals. Cows were supplemented with 3 kg DM/cow per day for the first 9 days of P2, reduced to 1 kg DM/cow per day from day 10 until day 24, after which concentrate was removed from the diet completely. The S treatment required 14 m2/cow per day less (P<0.001) when compared with the M treatment (72 m2/cow per day).
The mean PGSH achieved (P<0.001) during P2 were 2.8 and 3.7 cm for the S and M treatments, respectively. Post-grazing HM was 323 kg DM/ha higher in the M than S swards (80 kg DM/ha; P<0.01). Pasture utilised by the cow decreased by 19% when PGSH increased from S to M treatments. Leaf content (>2.7 cm) was numerically but not significantly higher (+0.08) for swards grazed to 2.7 cm in P2 than 3.5 cm swards (0.61), whereas the M swards had a numerically greater (P=0.15; +0.04) proportion of stem when compared with S swards (0.24). No differences were observed between treatments in terms of leaf, stem and dead proportions below 2.7 cm during P2.
The length of the first grazing rotation was set at 35 days; all treatments finished the first grazing rotation on 18th March; the second rotation was ongoing until the end of P2. During the first 10 weeks of the experiment treatment, M required 24% more area than the S treatment to achieve their target PGSH. Daily grass growth rate and cumulative grass DM/ha production did not differ between treatments during either P1 or P2 (1.2 and 1.8 t DM/ha, respectively). At the end of P2, all swards had a similar total DM production (3 t DM/ha).
There was no carryover effect of P1 and P2 PGSH on P3 pre-grazing HM>3.5 cm (1664; standard error of the difference (s.e.d.) 86.3 kg DM/ha), pre-grazing sward height (11.1; s.e.d. 0.68 cm), post-grazing HM>3.5 cm (209; s.e.d. 15.4 kg DM/ha) and daily area allocation (99.5; s.e.d. 11.82 m2/cow per day). Daily grass growth rate (66.4; s.e.d. 1.08 kg DM/ha per day) and cumulative grass DM production (12.3; s.e.d. 0.22 t DM/ha) were also similar in P3. At the end of the grazing season, there was no effect of PGSH on cumulative grass DM production measured in the base paddocks (15.3; s.e.d. 0.24 t DM/ha). Swards grazed to 2.7 cm during P2 had a higher proportion of leaf (+0.05; s.e.d. 0.023; P<0.01) but a lower proportion of dead material (−0.04; s.e.d. 0.014) in P3 than swards grazed to 3.5 cm (0.65 and 0.12, respectively). There was no difference in stem between treatments (0.22; s.e.d. 0.019).
Grass chemical composition
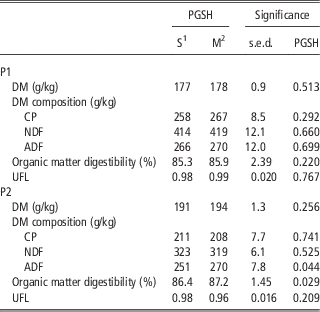
There were no differences in the chemical composition of the herbage in P1 (Table 4). During P2, the S swards had lower (P<0.05) ADF (−19 g/kg DM) and OMD (−0.08) when compared with M treatments (270 and 872 g/kg, respectively). There were no carryover effects of P1 and P2 PGSH treatments on P3 sward DM (158 g/kg), CP (226 g/kg), NDF (415 g/kg), ADF (335 g/kg), OMD (0.85) and UFL (0.87).
Effect of a severe (S) and moderate (M) post-grazing sward height (PGSH) on the chemical composition of herbage selected by animals during P1 (13 February to 19 March) and P2 (20 March to 22 April)

DM=dry matter; UFL=Unité Fourragère Lait.
1 S=2.7 cm.
2 M=3.5 cm.
Animal performance
Period 1
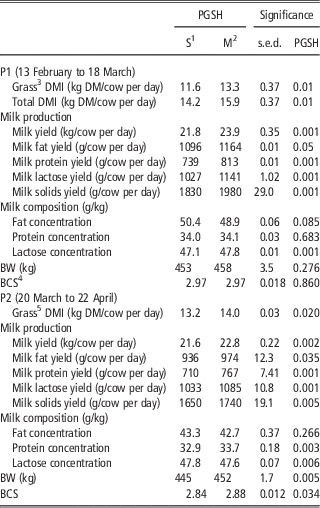
Cows grazing swards to 3.5 cm during P1 increased their milk yield (+2.1 kg/cow per day; P<0.001; Table 5) when compared with cows grazing to 2.7 cm (21.8 kg/cow per day). Milk fat concentration tended to be greater (+1.5 g/kg; P=0.085) for the M than the S cows (48.9 g/kg), and protein concentration was not affected by PGSH (34.1 g/kg). Animals in treatment M had greater milk lactose concentration (+0.7 g/kg; P<0.001) and increased yields of milk fat (+68 g/day; P<0.05), protein (+74 g/day; P<0.001), lactose (+114 g/day; P<0.001) and milk solids (+0.15 kg/cow per day; P<0.001) when compared with cows grazing to 2.7 cm (47.1 g/kg, 1096 g/cow per day, 739 g/day, 1027 g/cow per day and 1.83 kg/cow per day, respectively). There was no significant difference in BW or BCS between treatments in P1 (456 kg and 2.97, respectively).
Effect of a severe (S) and moderate (M) post-grazing sward height (PGSH) on spring-calving dairy cow milk yield, milk composition, BW and body condition score during P1 (13 February to 18 March) and P2 (20 March to 22 April)

DMI=dry matter intake; BCS=body condition score.
1 S=2.7 cm.
2 M=3.5 cm.
3 Measured using n-alkanes.
4 0 to 5 scale.
5 No concentrate was offered when DMI was estimated during P2.
Concentrate DMI during the first intake measurement period was 2.6 kg DM/cow per day. Total DMI, measured during week 5 of the experiment, was 1.7 kg DM/cow per day less (P<0.001) for the S animals than the M animals (15.9 kg DM/cow per day). The DHA offered during the intake measurement period was 10.5 and 13.0 kg DM/cow per day for the S and M treatments, respectively. When EB was calculated for P1 treatments, cows grazing to 3.5 cm attained an energy intake of 16.8 UFL, which was equal to their energy required, whereas the cows grazing to 2.7 cm were in moderate negative EB as their energy intake was 14.5 UFL and their energy required was 15.1 UFL.
Period 2
No interactions between P1 and P2 treatment were observed. Cows assigned to the M treatment in P2 had higher milk yield (1.2 kg/cow per day; P<0.01; Table 5) and protein concentration (+0.8 g/kg; P<0.01) than S cows (21.6 kg/cow per day and 32.9 g/kg, respectively). Grazing to 3.5 cm also increased milk fat (+38 g/cow per day; P<0.05), protein (+57 g/day; P<0.001), lactose (+52 g/day; P<0.001) and milk solids yields (+0.09 kg/cow per day; P<0.01) when compared with the S cows (936, 710, 1033 g/day and 1.65 kg/cow per day, respectively). Cows grazing to 3.5 cm had significantly higher average BW (+7 kg; P<0.01), BCS (+0.04; P<0.05) and GDMI (+0.8 kg DM/cow per day; P<0.05) when compared with the S treatment (445 kg, 2.84 and 13.2 kg DM/cow per day, respectively).
The S and M treatments were offered a DHA of 13.6 and 15.0 kg DM/cow per day, respectively, (P<0.01) during the intake measurement period and no concentrate. During the second intake measurement period, there was a similar difference (0.8 UFL) in energy intake between the S and M treatments. Both treatments were in negative EB (−1.5 and −0.7 UFL for S and M treatments, respectively; P<0.05).
Cumulative early lactation performance (P1 and P2)
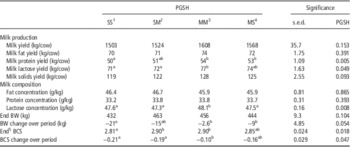
Maintaining PGSH at 3.5 cm for 10 weeks (MM) throughout P1 and P2 tended (P=0.15) to increase milk yield (+105 kg/cow; Table 6) and milk solids yield (+9 kg/cow) in comparison with 2.7 cm for 10 weeks (SS; 1503 kg/cow and 119 kg/cow, respectively). The SM and MS treatments, which had a PGSH change between P1 and P2, were similar to both the SS and MM treatments. The SS treatment cows had a lower milk protein yield (−4 kg/cow; P<0.01) when compared with MM and MS cows (54 kg), the SM cows were intermediate (51 kg). Milk lactose yield was lower (P<0.05) for the SS and SM cows (−5 kg) than the MM cows (77 kg), the MS cows were intermediate (74 kg). At the end of P2, the SS cows had a greater BW change over the 10-week period (−21 kg; P=0.05) than the MM and MS (−6 kg) cows, SM were intermediate. The MM animals also lost less BCS (−0.10) over the 10-week period compared with SS and SM, which lost a similar amount of condition (−0.20). The MS treatment was intermediate (−0.16).
Effect of post-grazing sward height (PGSH) on spring-calving dairy cow cumulative milk yield, milk composition, BW and body condition score in the first 70 days of lactation (13 February to 22 April)

BCS=body condition score.
a-bMeans within a row with different superscripts differ (P<0.05).
1 SS=2.7 to 2.7 cm.
2 SM=2.7 to 3.5 cm.
3 MM=3.5 to 3.5 cm.
4 MS=3.5 to 2.7 cm.
5 0 to 5 scale.
Total concentrate inclusion in the diet of each treatment group equated to 140 kg DM/cow at the end of the 10-week period.
Carryover effects of early lactation regime (P3)
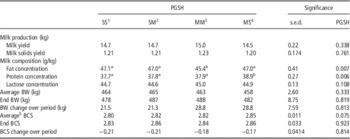
There was no effect of P1 and P2 treatments on subsequent milk yield or milk solids yields in P3. During P3, MM treatment had significantly lower (P<0.01; Table 7) fat concentration (−1.6 g/kg) than all the other treatments (47.0 g/kg). The MS treatment had a greater protein concentration (+1.1 g/kg; P<0.01) in comparison with all the other treatments (37.8 g/kg). P1 and P2 treatments had no effect on BW (484 kg) and BCS (2.85) at the end of lactation. There was no carryover effect of PGSH imposed in P1 and P2 on subsequent animal GDMI in weeks 15 and 20 of lactation (14.3 and 14.2 kg DM/cow per day, respectively.)
The carryover effect (23 April to 4 November) of post-grazing sward height (PGSH) imposed in P1 and P2 (13 February to 22 April) on spring-calving dairy cows milk yield, milk composition, BW and body condition score

BCS=body condition score.
a-bMeans within a row with different superscripts differ (P<0.05).
1 SS=2.7 to 2.7 cm.
2 SM=2.7 to 3.5 cm.
3 MM=3.5 to 3.5 cm.
4 MS=3.5 to 2.7 cm.
5 0 to 5 scale.
Complete lactation performance
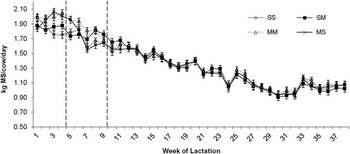
The experimental period was 266 days for all the treatments (end of the grazing season). There was no difference in the number of cows dried off before this time. No significant difference was observed in terms of total lactation milk yield (4429 kg/cow) and milk solids yield (360 kg/cow; Figure 1). There was no difference between treatments in average fat or lactose concentrations during the lactation (46.5 and 45.6 g/kg, respectively). Milk protein concentration tended to be lower in treatments SS and MM (−0.9 g/kg; P=0.07) than SM and MS cows (37.3 g/kg).
Effect of post-grazing height (PGSH) treatment during the first 10 weeks (P1+P2) of lactation on total lactation milk solids yield (the perforated vertical lines at weeks 5 and 10 represent the end of P1 and P2). PGSH: SS=2.7 cm in P1, 2.7 cm in P2; SM=2.7 cm in P1, 3.5 cm in P2; MM=3.5 cm in P1, 3.5 cm in P2; and MS=3.5 cm in P1, 2.7 cm in P2.

Discussion
The main objective of this experiment was to establish the effects of timing and duration of grazing severity during the first 10 weeks of lactation on the immediate, subsequent and total lactation production of dairy cows. The results of this study can be used to provide grass-based dairy farms with information on how to deal with fluctuations in grass supply during early spring.
McCarthy et al. (Reference McCarthy, Pierce, Delaby, Brennan, Fleming and Horan2012) previously reported variability of grass production, particularly during the spring period under Irish climatic conditions. The spring, during which the present experiment was conducted was no different, as grass growth in March was 41% higher and grass growth in April was 22% lower than the previous 10-year average. The treatments imposed in the present experiment reflect this variability in grass growth and also the effects of herd demand due to calving pattern. As the spring grazing season progresses, there is a higher demand for pasture because not only is the dairy cow stage of lactation increasing, leading to higher feed requirements (Kertz et al., Reference Kertz, Teutzel and Thomson1991), but also a greater number of cows are calved, which increases herd demand and consequently affects pasture availability (MacDonald et al., Reference MacDonald, Penno, Lancaster and Roche2008). Conversely, there can be a deficit of grass at turnout (Ganche et al., Reference Ganche, Delaby, O’Donovan, Boland, Galvin and Kennedy2013b) and increased grass growth as climatic conditions improve and are more conducive to high grass growth rates (Hurtado-Uria et al., Reference Hurtado-Uria, Hennessy, Shalloo, Schulte, Delaby and O’Connor2013). Therefore, it is highly plausible that cows may be offered a higher feed allowance during the first grazing rotation followed by a lower feed allowance in the second rotation and vice versa, depending on grass supply.
Effect of early spring grazing regime on sward characteristics
Successful pasture-based systems are dependent on maximising grass growth and utilisation (O’Donovan et al., Reference O’Donovan, Lewis and O’Kiely2011); therefore, any grazing system that is implemented must not lead to a reduction in grass growth. Grazing to a PGSH of 2.7 cm ensures extremely high levels of utilisation, as demonstrated in this experiment; however, previous literature reported reduced pasture growth as a result of high SR or grazing intensity (Lee et al., Reference Lee, Donaghy and Roche2008; Ganche et al., Reference Ganche, Delaby, O’Donovan, Boland, Galvin and Kennedy2013b). This may have been the anticipated result in this experiment, as grazing to a very low PGSH removes a large proportion of the sward leaf, which would impede the recovery of the sward leading to reduced growth rates (Tuñon, Reference Tuñon2013). However, there was no effect of treatment on sward DM production at any point during the experiment, which is perhaps attributable to the similarity in sward morphology, both above and below the grazing horizon, across treatments and the lack of difference in post-grazing HM >2.7 cm following P1. Furthermore, as swards were grazed at the target pre-grazing HM, there were similar proportions of leaf in both swards and it ensured that sufficient leaf remained post-grazing to intercept solar radiation, which is required for respiration and tissue growth (Grant et al., Reference Grant, Barthram and Torvell1981).
MacDonald et al. (Reference MacDonald, Penno, Lancaster and Roche2008) found an increase in pasture quality as swards were defoliated to a lower PGSH, this is in contrast with the present experiment, which found no difference in sward quality. In relative terms, a post-grazing height of 3.5 cm is low compared with previous literature (O’Donovan and Delaby, Reference O’Donovan and Delaby2005; Kennedy et al., Reference Kennedy, O’Donovan, O’Mara, Murphy and Delaby2007), which has reported that grazing deeper into the sward horizon increases sward quality. Thus, given that high sward quality would be expected when grazing below 4 cm, a 0.8 cm difference in PGSH, as achieved in this experiment, may not have been sufficient to detect any differences in sward quality.
Effect of PGSH on cow production during weeks 1 to 5 of lactation
As there were no differences in sward quality during P1, differences in animal production can be attributed to the treatments imposed. By limiting the DHA of the cows on the S treatment, very low PGSH were achieved. During P1, a 2.1 kg DM/cow per day difference in DHA between S and M treatments was reflected in a GDMI difference of 1.7 kg DM/cow per day. If the nutrient requirements of the cow cannot be satisfied from intake, there will be a reduction in milk production as Kertz et al. (Reference Kertz, Teutzel and Thomson1991) stated that energy intake is a major factor limiting milk production in early lactation. In this experiment, the cows assigned to the S treatment in P1 reduced their milk production by 9%, similar to that reported by Ganche et al. (Reference Ganche, Delaby, O’Donovan, Boland and Kennedy2013a; 10% reduction). Although the S animals had a higher DMI requirement than that achieved, they were impeded from grazing deeper into the sward because of its morphological structure. Similar to that reported by Pérez-Prieto et al., (Reference Pérez-Prieto, Peyraud and Delagarde2012), the sward in the present experiment comprised of 0.58 stem, 0.37 dead material and only 0.05 leaf below 2.7 cm. The high proportion of stem and dead material can act as a barrier, hindering dairy cows achieving higher DMI (Edwards et al., Reference Edwards, Parsons, Penning and Newman1995). The S cows were in moderate negative EB during P1 due to reduced energy intake. This deficit in energy intake was reflected in the high response (3.50 kg milk/cm increase in PGSH) to any additional herbage offered to the M cows, through an increase in PGSH. This response is higher than that reported by Ganche et al. (Reference Ganche, Delaby, O’Donovan, Boland and Kennedy2013a; 2.88 kg of milk per extra centimeter in PGSH) and McEvoy et al., (Reference McEvoy, Kennedy, Murphy, Boland, Delaby and O’Donovan2008; 2.11 kg milk per extra centimeter in PGSH), and indicates how restrictive the feed allowance offered to the S cows actually was. Mobilisation of body energy reserves, leading to a decline in BCS postpartum, is generally used to bridge the energy deficit gap (Roche et al., Reference Roche, Berry and Kolver2006; McCarthy et al., Reference McCarthy, Berry, Dillon, Rath and Horan2007). However, the energy deficit of the S cows in P1 did not result in any mobilisation of body reserves, as there was no change in BCS. Kennedy et al. (Reference Kennedy, O’Donovan, Delaby and O’Mara2008), who also offered cows a low DHA, did not observe a large mobilisation of the body reserves and postulated that a low DHA was sufficient in the first 40 days of lactation. However, considerable BW can be mobilised without a noticeable change in BCS (Berry et al., Reference Berry, Buckley, Dillon, Evans, Rath and Veerkamp2003); consequently, the feed allowance offered to cows should not be overly restricted in early lactation. Feed restrictions in early lactation have previously resulted in lower milk fat and protein concentrations (Delaby et al., Reference Delaby, Faverdin, Michel, Disenhaus and Peyraud2009; Ganche et al., Reference Ganche, Delaby, O’Donovan, Boland, Galvin and Kennedy2013b). Given the reduced energy intake of the S cows, a reduction in protein concentration would be expected (Coulon and Rémond, Reference Coulon and Redmond1991), but perhaps the cows were too early in lactation for differences to become apparent.
Effect of PGSH on cow production during weeks 6 to 10 of lactation
In P2, the response to the higher PGSH imposed (1.33 kg milk/cm PGSH) was greatly reduced compared with P1. Milk yield of the M cows was lower during P2 when compared with P1, whereas the P2 milk yield of the S cows remained similar to P1 (perhaps indicative of greater persistency); consequently, there was a reduction in the difference in milk yield between the two treatments in P2. This coupled with a 0.4 cm increase in PGSH for the M treatment in P2 compared with P1, compared with a 0.1 cm increase for the S treatment during the same period, resulted in a reduced response to the extra herbage being offered via a higher PGSH. The S cows had a greater increase in GDMI than the M cows between P1 and P2, which may have allowed these cows to maintain a more persistent milk yield. The greater increase in GDMI could possibly be attributed to the higher HM swards that were offered during P2 compared with P1.
Tuñon (Reference Tuñon2013) has previously shown that intake per bite and, consequently, total GDMI are greater on high HM swards (2330 kg DM/ha) compared with medium HM swards (1520 kg DM/ha) because of differences in sward density and grazing behaviour. Furthermore, the S cows appear to have mobilised more body energy reserves as there was a difference in BW and BCS during P2, which may have also contributed to the lack of difference in milk yield between P1 and P2. McCarthy et al. (Reference McCarthy, Berry, Dillon, Rath and Horan2007) found that increased SR (i.e. differences in feed supply) did not lead to significant differences in BCS at 60 DIM; however, the differences become progressively more pronounced as the grazing season advanced. During P2, when cows in the present experiment were at a similar stage of lactation to those of McCarthy, there was a difference in BW and BCS. The DHA in the present experiment, however, may have been more restrictive than that of McCarthy et al. (Reference McCarthy, Berry, Dillon, Rath and Horan2007). Cows in the present experiment may have also reached a critical point whereby a reduction in milk yield was insufficient to bridge the energy deficit gap and they had to mobilise energy reserves to overcome the shortfall in energy intake. Although the GDMI of the M cows increased at a lower rate than the S cows in P2, they still had a higher intake, reflecting the higher DHA offered, which may have contributed to the higher milk protein concentration of the M cows. Maher et al. (Reference Maher, Stakelum and Rath2003) found that milk protein concentration increased linearly with increasing DHA. Conversely, low milk protein concentration is generally associated with decreased DMI and energy supply (Coulon and Rémond, Reference Coulon and Redmond1991). The DMI and UFL intake of the S cows during P2 were 0.8 kg DM/cow per day and 1.1 UFL/cow per day less compared with the M cows.
Effect of spring grazing strategy on cumulative early lactation dairy cow production
When the 10-week period during which the experimental treatments were applied was examined, altogether it showed that there was a difference between the SS and MM treatments (i.e. the treatment that grazed to 2.7 cm continuously compared with the treatment that grazed to 3.5 cm continuously). This is similar to that reported by Ganche et al. (Reference Ganche, Delaby, O’Donovan, Boland and Kennedy2013a and Reference Ganche, Delaby, O’Donovan, Boland, Galvin and Kennedy2013b) and given that the results attained in P1 and P2 were not unexpected. However, it is interesting that there was no difference between the MS, SM and MM treatments. This indicates that short-term (i.e. 5 weeks) feed restrictions can be applied in early lactation without any significant reduction in cumulative production during the first 10 weeks of lactation. Vetharaniam et al. (Reference Vetharaniam, Davis, Upsdell, Kolver and Pleasants2003) reported that when cows had a reduced dietary energy intake, active secretory cells entered a quiescent, non-secretory state, and therefore reduced milk yield but had the ability to reactivate if energy intake increased. No interaction between P1 and P2 treatments in terms of milk yield indicates that the SM animals grazing to 2.7 cm in P1 reacted to the increase in PGSH (and consequent increase in DHA) in P2 very quickly. The results of this experiment may also have been influenced by the genetics of the herd. The ability of the S animals (i.e. the SM and MS cows) to easily reduce milk energy output when faced with low energy intake and their ability to increase milk production again when feed supply increases may be an acquired genotypic feature of cows selected for seasonal pasture-based dairy systems (Burke and Roche, Reference Burke and Roche2007).
Effect of spring grazing strategy on total cumulative dairy cow production
The findings of this experiment have practical implications for dairy farmers where pasture-based systems of production predominate. Given the lack of control of climatic factors dictating grass growth, it can be difficult to ensure a constant feed supply for early lactation dairy cows during spring (Hurtado-Uria et al., Reference Hurtado-Uria, Hennessy, Shalloo, Schulte, Delaby and O’Connor2013). The results from this study suggest that if grass allocations can be reduced for up to 5 weeks, cows will reduce their milk production in response to the reduced feed supply, but this will not have long-term repercussions on milk production.
The lack of difference at the end of lactation in the present experiment highlights the ability of the dairy cow to adjust milk production in response to the level of nutrients offered at pasture (Friggens et al., Reference Friggens, Emmans, Kyriazakis, Oldham and Lewis1998). Roche (Reference Roche2007) and McEvoy et al. (Reference McEvoy, Kennedy, Murphy, Boland, Delaby and O’Donovan2008) disagree, as both found that an inadequate level of feed in early lactation reduced subsequent milk production; however, in both experiments, the range of PGSH was much larger, 3.1 or 3.5 to 5.0 cm, respectively. Again, these experiments reported much larger differences in milk production than in the present experiment, which had a comparatively smaller difference between treatments. Grass DMI was similar for all treatments in P3. This indicates that all cows responded to the change in feeding regime and altered their GDMI accordingly. It can be concluded that the difference in milk yield in early lactation was diluted throughout the total lactation, as the experimental phase was relatively short. All swards were of high quality, as all were grazed to a relatively low PGSH in spring, which prevented stem development and accumulation of senescent material when compared with laxly grazed swards (Holmes et al., Reference Holmes, Hoogendoorn, Ryan and Chu1992), thus resulting in herbage with greater digestibility.
Treatment MM had significantly lower milk fat concentrations in P3. This possibly indicates a lower fibre intake by these cows (Phillips and Leaver, Reference Phillips and Leaver1985), perhaps due to their greater ability to select more digestible material or their reluctance to graze lower into the sward horizon, as all other treatments had to graze to 2.7 cm at some point during either P1 or P2. Milk protein concentration was significantly higher for the MS treatment cows in the carryover period. Burke et al. (Reference Burke, Williams, Hofmann, Kay, Phyn and Meier2010) found that animals restricted at a similar period in lactation for only 14 days tended to have reduced protein concentration in the carryover period; however, a greater restriction was placed on the cows.
Conclusion
This experiment demonstrated that imposing a PGSH of 2.7 cm for the first 10 weeks of lactation tended to reduce immediate milk yield when compared with cows grazing to 3.5 cm. However, when grazing to 2.7 cm was restricted to one 5-week period during the first 10 weeks of lactation, there was no effect on cumulative milk or milk solids production in either the first 10 weeks of lactation or on total lactation production. These findings provide farmers with a possible strategy to mitigate against low grass growth at different periods during early spring: PGSH can be reduced for a 5-week period during the first 10 weeks of lactation and lower DHA offered until grass growth recovers with no reduction in cumulative milk or sward production.
Acknowledgements
The authors thank F. Coughlan, N. Galvin, M. Feeney and J.P. Murphy for their technical assistance and all the staff of Moorepark research farm for their care of the animals and assistance with measurements during the experiment.