I. INTRODUCTION
Nickel- and cobalt-based high-temperature superalloys are materials of choice for high-temperature applications such as turbine engines because of their excellent microstructural stability and elevated temperature properties such as strength and resistance to creep, oxidation, and corrosion.Reference Sims, Stoloff and Hagel1–Reference Coutsouradis, Davin and Lamberigts3 The two primary microstructural constituents of these alloys are the γ solid solution, which forms the matrix, and precipitates of γ′ intermetallic compound. Many alloying elements are added to these alloys for improving their overall performance further. The alloying elements typically partition into either of the major constituent phases. Among the alloying additions, platinum has shown to impart a significant enhancement to creep resistance.Reference Jena and Chaturvedi4–Reference Hobbs, Zhang, Rae and Tin7 Consequently, the diffusion of Pt in γ solid solution is of importance.
Additionally, Pt diffusion becomes important in the context of bond coating of β phase (Ni, Pt)Al intermetallic compound, which is utilized to increase the high-temperature capability of the superalloys. However, the growth of topological close-packed (TCP) phases in the interdiffusion zone between the superalloy and the bond coat is deleterious to the structure. TCP phases grow in the interdiffusion zone because of loss of Ni from the superalloyReference Hayashi, Wang, Sordelet and Gleeson8 since Ni-based superalloys are in general Ni-rich alloys and the bond coats are Ni-lean. To avoid this, a phase mixture of γ-(Ni, Pt) solid solution and γ′-(Ni, Pt)3Al has been utilized as the bond coat, and its utility has been demonstrated in the case of CMX4 single-crystal superalloy.Reference Hayashi, Wang, Sordelet and Gleeson8, Reference Haynes, Pint, Zhang and Wright9 It was suggested that the presence of Pt in the bond coat decreases the loss of Al in the interdiffusion zone and improves the oxidation resistance of the superalloy.Reference Gleeson, Wang, Hayashi and Sordelet10
In materials that are used at high temperatures, a good knowledge of the diffusion process is important so as to understand the variation of many physical and mechanical properties with time. In the context of the superalloy substrate and the bond coat, interdiffusion studies are directly relevant as diffusion, and the resultant microstructural modifications, is the main cause for the degradation in performance of the system. However, a comprehensive study of the diffusion of Pt in either Ni or Co has not been performed yet. The following studies have been reported to date. Borovskiy et al.Reference Borovskiy, Marchukova and Ugaste11 estimated the interdiffusion coefficients in the Ni–Pt system in the temperature range of 950–1300 °C and in the Co–Pt system in the range of 1125–1300 °C. Ijima et al.Reference Ijima, Taguchi and Hirano12 calculated interdiffusion coefficients, activation energy, pre-exponential factor, and impurity diffusion coefficients in the Co–Pt system in the temperature range of 1000–1400 °C. Million and KučeraReference Million and Kučera13 estimated the activation energy for impurity diffusion of Pt in Ni and Co by residual activity method. Using the Hall method, Minamino et al.Reference Minamino, Yoshida, Jung, Hirao and Yamane14 determined the impurity diffusion coefficient of Pt in Ni in the temperature range of 1050–1350 °C. Karunaratne and ReedReference Karunaratne and Reed15 measured the interdiffusion coefficients in the Ni-rich side of the Ni–Pt system. Recently, Gong et al.Reference Gong, Zhang, Yaoa and Zhou16 measured the interdiffusion coefficients in the Ni–Pt system in the temperature range of 1150–1300 °C to validate the results obtained by simulations. Liu et al.Reference Liu, Liang, Du, Zhang and Yu17 studied interdiffusion and impurity diffusion coefficients in the Co–Pt system using CALculation of PHAse Diagrams (CALPHAD). In spite of these studies, the exact diffusion mechanism is still not understood as it requires knowledge of intrinsic and tracer diffusion coefficients in addition to interdiffusion or impurity diffusion coefficients. Keeping this in view, we have evaluated the variation of intrinsic diffusion coefficients with the composition in the Ni–Pt and Co–Pt binary systems by employing the diffusion couple technique in this work. It also allows for evaluating the role of the vacancy wind effect, which gives insights into the physical mechanism of diffusion.
In this study, diffusion couple technique is used first to determine the variation of interdiffusion coefficients as a function of the composition at different temperatures. Impurity diffusion coefficients are calculated by extending the interdiffusion coefficients to the composition of pure elements. Activation energy and pre-exponential factor for diffusion are estimated. Multifoil diffusion couple technique, developed by Levasseur and Philibert,Reference Levasseur and Philibert18 Cornet,Reference Cornet19 and van Loo et al.,Reference van Loo, Bastin and Rieck20 is then used to determine the intrinsic diffusion coefficients. The thermodynamic parameters for diffusion are estimated from the activity data, which are then used to determine the change in tracer diffusion coefficients and to examine the role of composition on the vacancy winds. The physics of diffusion process is discussed on the basis of these data.
II. EXPERIMENTS
In this study, 1-mm-thick foils of Ni, Co with 99.95 wt% purity, and Pt with 99.99 wt% purity were used. Pieces of 5 mm × 5 mm size were cut from the as-received foils using high-speed diamond saw. The bonding faces of the couple halves were ground and polished first with emery papers and then fine polished with 0.25-μm alumina slurry. The polished surfaces were cleaned ultrasonically in ethanol for 5 min and dried in hot air. The samples were then clamped with minimum pressure required in a special fixture to allow good contact between the bonding surfaces. Diffusion experiments were conducted in vacuum (∼10−7 kPa) tube furnace in the temperature range of 1050–1250 (±5) °C for 9 h.
For the multifoil experiments, Co, Ni, and Pt foils of 25-μm thickness were used as the end members. Eight Ni foils and then nine Pt foils were stacked one above another to make the Ni–Pt multifoil diffusion couple. Y2O3 particles (3–4 μm) were introduced between the foils. Nine Co foils and ten Pt foils were stacked to make the Co–Pt multifoil diffusion couple. These couples were then annealed at 1200 °C for 25 h in vacuum. After the heat treatment, samples were quenched and cross-sectioned using the slow-speed diamond saw. Sample halves were then fine polished using colloidal silica (0.04 μm) suspension. Composition profiles developed in the interdiffusion zone were measured using the energy-dispersive spectroscope (EDS) or electron probe micro analyzer (EPMA).
III. RESULTS
A. Interdiffusion coefficient, 

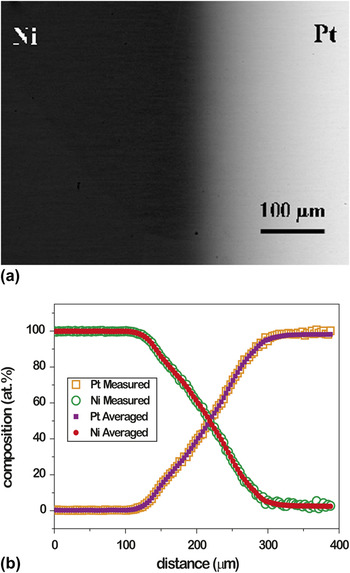
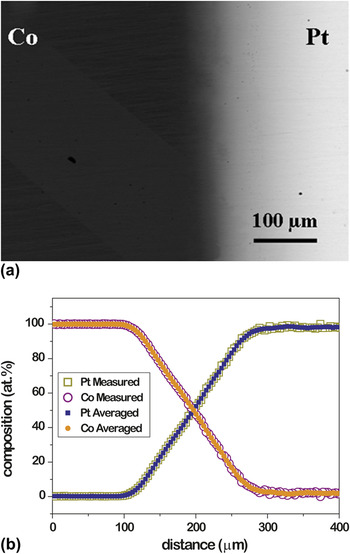
Figures 1(a) and 2(a) show the secondary electron images of the interdiffusion zones developed in Ni–Pt and Co–Pt diffusion couples annealed at 1250 °C for 9 h. The temperature for diffusion experiments was selected such that a complete solid solution develops in the interdiffusion zone.Reference Predel21 Figures 1(b) and 2(b) show the respective composition profiles measured using EDS. The composition profiles are averaged using smoothening functions of Origin8 software to calculate  . The change in
 with composition is calculated using the Wagner relation expressed as

(a) Backscattered electron (BSE) image of the interdiffusion zone developed in the Ni–Pt diffusion couple annealed at 1250 °C for 9 h and (b) corresponding measured and averaged composition profile.

(a) BSE image of the interdiffusion zone developed in the Co–Pt diffusion couple annealed at 1250 °C for 9 h and (b) corresponding measured and averaged composition profile.

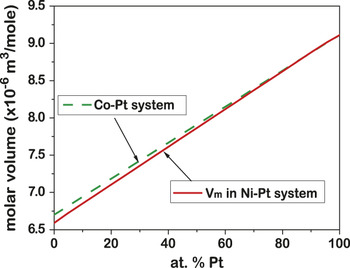
where “*” represents the position of interest, 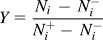 is the composition normalizing variable, N i is the mol fraction of component i. The superscripts + and − refer the unaffected left-hand (x = −∞) and right-hand (x = +∞) ends of the couple, respectively, and V m is the molar volume. The change in lattice parameter with the composition, available in the literature for the Co–Pt system,Reference Predel21 is used for calculating the molar volume. However, such information is not available for the Ni–Pt system. In that case, the Vegard law and the molar volumes of pure Ni and Pt were utilized to calculate the molar volumes of different alloy compositions. Variation of molar volume with composition for both the alloy systems is shown in Fig. 3.
Variation of molar volume V m with composition in the Ni–Pt and Co–Pt systems.

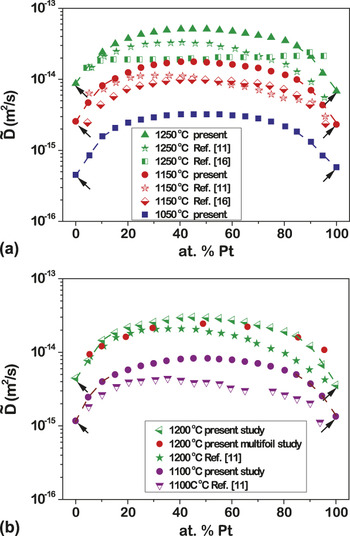
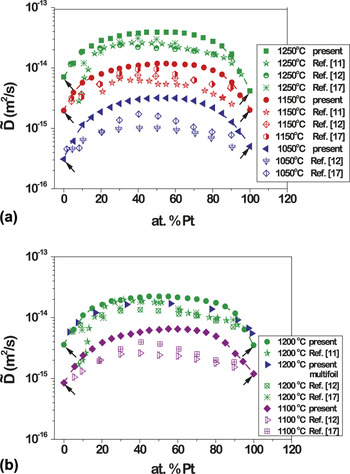
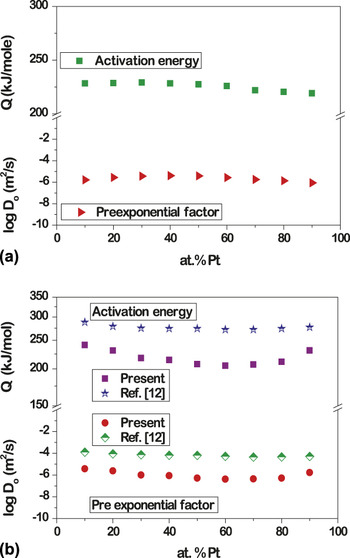
Variation in  with the composition in the Ni–Pt and Co–Pt systems is shown in Figs. 4 and 5, respectively. Data available in the literature is also plotted for comparison purposes.Reference Borovskiy, Marchukova and Ugaste11, Reference Ijima, Taguchi and Hirano12, Reference Gong, Zhang, Yaoa and Zhou16, Reference Liu, Liang, Du, Zhang and Yu17 It is seen that some minor differences exist between the experimental results of various studies. However, the trends are nearly identical. In both the alloy systems examined,
 does not vary much between 30 and 70 at.% Pt. Activation energy, Q and pre-exponential factor,
 , for
 at different compositions are computed using the Arrhenius equation
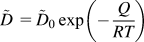 . Here, R is the gas constant and T is temperature in K. The variation in Q and
 with the composition is shown in Figs. 6(a) and 6(b). The change in Q and
 values with composition is available in the literatureReference Ijima, Taguchi and Hirano12 for Co–Pt system and are shown for comparison. It can be seen that Q and
 do not change much with the composition.
Variation of  at (a) 1050, 1150, and 1250 °C and (b) 1100 and 1200 °C with the composition in Ni–Pt system compared the present bulk and multifoil results with the literature data. Dotted lines show the extrapolation to 0 and 100 at.% Pt to calculate the impurity diffusion coefficients. Impurity diffusion coefficient values are indicated by arrow.

Variation of  at (a) 1050, 1150, and 1250 °C and (b) 1100 and 1200 °C with the composition in Co-Pt system compared the present bulk and multifoil results with the literature data. Dotted lines show the extrapolation to 0 and 100 at.% Pt to calculate the impurity diffusion coefficients. Impurity diffusion coefficient values are indicated by arrow.

The variation of activation energy and pre-exponential factor with the composition in (a) Ni–Pt system and (b) Co–Pt system compared with the available literature.

B. Impurity diffusion coefficients
Impurity diffusion coefficients at different temperatures can be calculated using the knowledge of  as they are related through the following equationReference Vignes and Birchenall22:

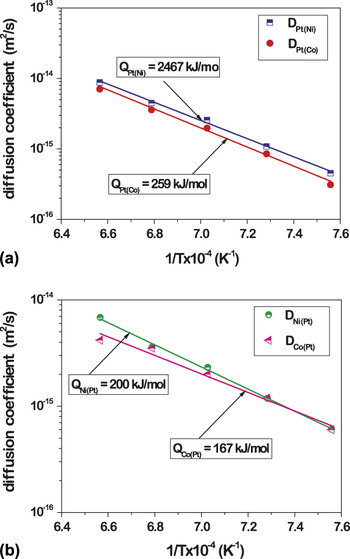
Here, A and B are the elements in A–B binary system,  is the thermodynamic factor, D A(B) and D B(A) are the impurity diffusion coefficients of A in B and B in A, respectively, ΔT s is the difference between the solidus temperature and the linear line connecting the melting points of A and B, and c is the structure-dependent coefficient. The impurity diffusion coefficients of Pt in Ni, D Pt(Ni), and Pt in Co, D Pt(Co), at different temperatures can be estimated by extrapolating the respective
 values to 0 at.% Pt, respectively. Likewise, the impurity diffusion coefficient of Ni and Co in Pt, D Ni(Pt) and D Co(Pt) can be calculated by extrapolating the respective
 values to 0 at.%Ni and Co. Since it was difficult to fit the data points to extend it to 0 at.%, and we have drawn a line rather manually to get these values. We have shown these lines on Figs. 4 and 5. The extrapolated values are indicated with arrows. Variation of these coefficients with (1/T) is shown in Fig. 7. The data is fitted with the Arrhenius equation to estimate Q and D 0. While the estimated Q values for D Pt(Ni) and D Pt(Co) are similar to those reported earlier,Reference Million and Kučera13, Reference Minamino, Yoshida, Jung, Hirao and Yamane14 whereas this value was found to be the same (280 kJ/mol) for both. Q for D Co(Pt) is lower than the value reported (296 kJ/mol) in literature.Reference Kučera and Zemčik23 This could possibly be due to the differences in the experimental techniques used by different research groups.
Arrhenius plot of impurity diffusion coefficient of (a) Pt in Ni, D Pt(Ni), and Pt in Co, D Pt(Co), and (b) Ni in Pt, D Ni(Pt), and Co in Pt, D Co(Pt).

C. Intrinsic diffusion coefficient, D i, by multifoil technique
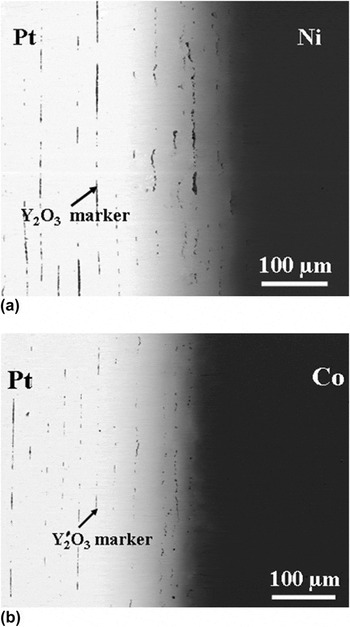
Since  is a kind of averaged value of D i of all the species involved in the diffusion process, determination of D i for individual elements is essential for thorough understanding of the diffusion. For estimating D i at different compositions, multifoil diffusion technique is used. The number of foils used for these experiments is decided based on the thickness of the interdiffusion zone developed in the bulk diffusion couple experiments. The backscattered electron (BSE) images of the interdiffusion zone developed in the Ni–Pt and Co–Pt multifoil diffusion couples are shown in Figs. 8(a) and 8(b), respectively. Levasseur and Philibert,Reference Levasseur and Philibert18 Cornet,Reference Cornet19 and van Loo et al.Reference van Loo, Bastin and Rieck20 have developed a relation to determine the velocity, v, of the markers at different planes as

BSE image of interdiffusion zone developed in (a) Ni–Pt and (b) Co–Pt multifoil diffusion couples annealed at 1200 °C for 25 h. Y2O3 marker particles are also shown.

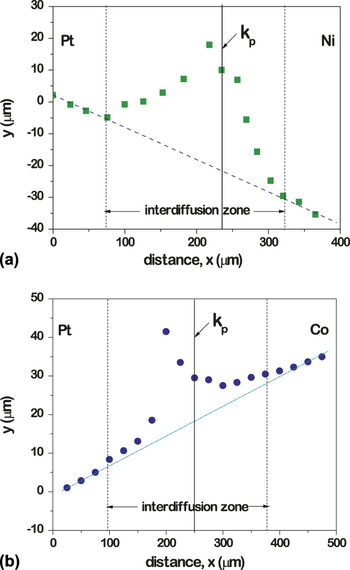
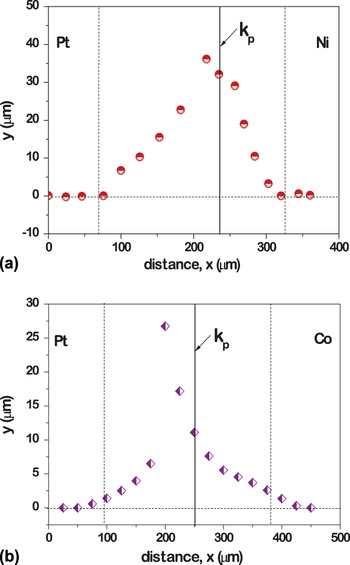
Here, x 0 is the initial position of the markers, x is the new position of the markers after interdiffusion, and y = (x − x 0) is the net displacement. The displacement of the markers is measured using the BSE image. Variations of y with x for both the couples are plotted and shown in Figs. 9(a) and 9(b). The markers outside the interdiffusion zone also had some displacement because of creep at annealing temperature. The following correction procedure, suggested by van Dal et al.Reference van Dal, Pleumeeres, Kodenstov and van Loo24 for plastic deformation, is used in the present study. A baseline is drawn which passes through the unreacted parts of the end members and the difference between the position of markers, and this baseline gives the actual displacement of the markers, which are shown in Figs. 10(a) and 10(b).
Marker displacement y(x) vs. the position parameter x in the (a) Ni–Pt and (b) Co–Pt systems. Interdiffusion zone is shown in between the dashed lines, k p indicates the Kirkendall marker plane position. Dotted baseline drawn for correcting the plastic deformation is also seen.

Marker displacement y(x) vs. the position parameter x after correction to the plastic deformation in the (a) Ni–Pt and (b) Co–Pt systems.

To proceed further,  at different compositions are calculated in the multifoil couples and results are compared with the
 values from the bulk diffusion couples as shown in Figs. 4(b) and 5(b). It is found that the data obtained from both the methods are similar. From the DarkenReference Darken25 relation,
 is related to D i in a binary A–B system by

where Vi and Ci are the partial molar volumes and concentrations of the species i. The velocity, v, of the maker plane at any composition is related to the intrinsic diffusion coefficientsReference Darken25 as

Using Eqs. (4)–(5), the expression for the ratio of D is can be written as

where

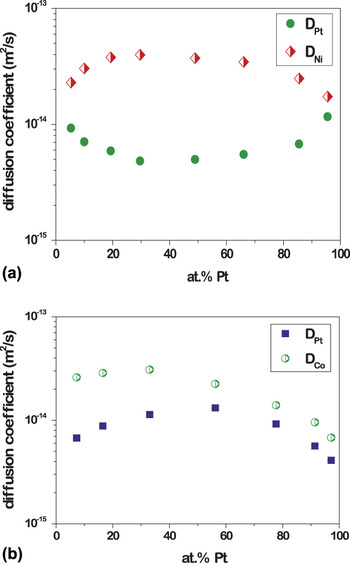
Using the above equations, D i values are calculated at different marker planes as a function of the composition and are plotted in Figs. 11(a) and 11(b).
Variation of intrinsic diffusion coefficients with composition in the (a) Ni–Pt and (b) Co–Pt systems.

D. Tracer diffusion coefficient of elements,

Diffusion couple technique is an indirect but reliable method to determine  . ManningReference Manning26 modified the relations developed by DarkenReference Darken25 as


where 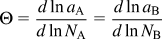 is the thermodynamic factor, ai and Wi are the activity and vacancy wind factor of element i, and

Here, M o is a constant and depends on the crystal structure of the material. For face-centered cubic crystals, it can be taken as 7.15.Reference Manning26 After replacing W i in Eq. (8), we have calculated the  of the elements. Then from the calculated values of
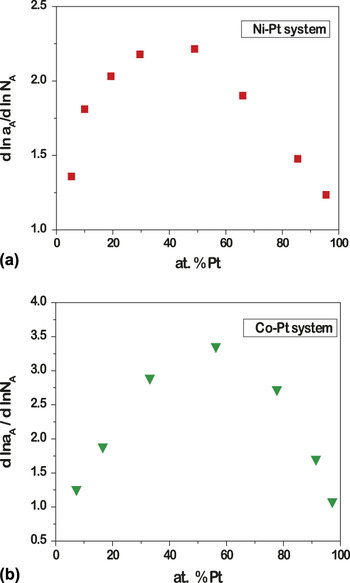
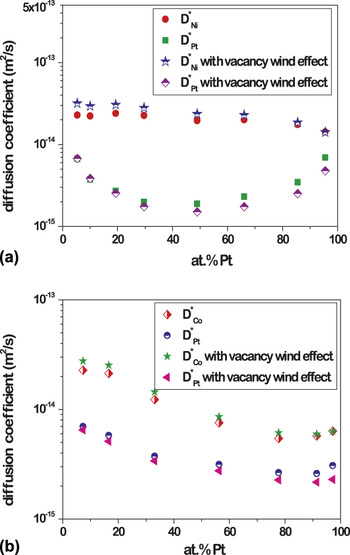
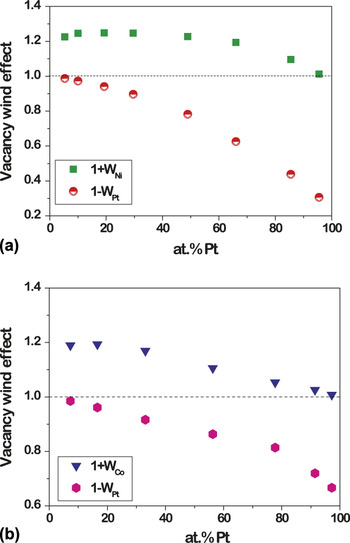
 , vacancy wind effects for different elements are calculated using Eq. (9). From the activity data at different compositions available in the literature,Reference Schwerdtfeger and Muan27, Reference Schwerdtfeger and Muan28 thermodynamic parameters in the Ni–Pt and Co–Pt systems are calculated and shown in Figs. 12(a) and 12(b). The data calculated for tracer diffusion coefficients are shown in Figs. 13(a) and 13(b), and the vacancy wind effects calculated at different compositions are shown in Figs. 14(a) and 14(b).
Thermodynamic parameters calculated for the (a) Ni–Pt and (b) Co–Pt systems at different compositions.

Variation of tracer diffusion coefficients with composition by considering and neglecting vacancy wind effect in the (a) Ni–Pt and (b) Co–Pt systems.

Vacancy wind effect as a function of composition in the (a) Ni–Pt and (b) Co–Pt systems.

The contribution of vacancy wind to diffusion is discussed extensively in literature.Reference Manning29–Reference Belova and Murch39 However, some uncertainty exists because of difficulties associated with the experimental techniques. To shed light on this, we also have calculated the tracer diffusion coefficients after neglecting the contribution from the vacancy wind, which means that we consider W = 1. The data calculated are also shown in Figs. 13(a) and 13(b) for comparison. It can be seen that the difference between the data sets is insignificant.
IV. DISCUSSION
As mentioned earlier, the knowledge on intrinsic and tracer diffusion coefficients are important for understanding the diffusion process in the Ni–Pt and Co–Pt systems, which were not available before. Instead of making a series of diffusion couples with different end-member compositions for finding the Kirkendall marker plane at different compositions, multifoil diffusion couple technique was used to estimate these parameters. An added advantage of this technique is that it minimizes the variability in percentage errors of different diffusion couples since the diffusion parameters are estimated from a single experiment.
In both the diffusion couples, the displacement of markers is away from Pt, which indicates that Ni and Co are faster diffusing species when compared with Pt. It can also be seen that the values of  in both the alloy systems are higher between 30 and 70 at.% Pt. This is possibly because of the higher thermodynamic driving force for intrinsic diffusion as reflected by the parameter shown in Fig. 12. Since the interdiffusion process is dominated by the faster diffusing species, D Ni and D Co are also higher in the same range.
Results of this work also show that  at different compositions does not vary significantly in the Ni–Pt system. This indicates that the variation of
 and D i with composition is due mainly to the thermodynamic driving force.
 in the Ni-rich side is marginally higher vis-a-vis the Pt-rich side because of the differences in vacancy concentration. The melting point of Ni (1455 °C) is lower than that of Pt (1768 °C). This means that the concentration of vacancies is likely to be higher in the Ni-rich side, which enhances the diffusion process. On the other hand,
 increases almost monotonously from Pt to the Co-rich side in the Co–Pt system. The increase in
 from Pt- to Co-rich side could be mainly because of the difference in melting point of these elements (the melting points of Co is 1495 °C). Results show that Pt has a lower diffusion rate over the entire composition range in both the alloy systems. This is due to the fact that the activation energy for impurity diffusion coefficients of Ni and Co in Pt are found to be lower than those of Pt in Ni and Co. Pt is expected to have lower concentration of vacancies at a given temperature (because of its higher melting point) as compared with Ni and Co. However, the low activation energy for Ni and Co diffusion in Pt indicates that the activation energy for migration must be lower. On the other hand, the concentration of vacancies must be higher in Ni and Co compared with Pt at a particular temperature due to the differences in the melting points. So the high activation energy for Pt diffusion in these two substrates indicates that activation energy for migration of Pt must be higher. This should be because of the smaller atomic size of Ni (149 pm) and Co (152 pm) compared to that of Pt (177 pm). There can be a role of vacancy impurity binding on diffusion. Many times, if there is a large difference in impurity and solvent atomic size, solute occupies the position next to the vacancy, which will be easier for impurity to diffuse. However, at this point, it is very difficult to quantify the exact role of impurity vacancy bonding.
Although the concept of vacancy wind effect was introduced by ManningReference Manning29 and Dayananda,Reference Dayananda30 the exact contribution of this effect on the diffusion rates is still not clear. There are mainly two ways to measure the contribution of the vacancy wind effect from the experimental results. The most commonly followed procedure is to determine D i experimentally from diffusion couple and  from tracer method first. Then, the vacancy wind effect can be estimated from Eqs. (8a) and (8b). In this approach, the outcome often tends to be rather inconclusive since two different techniques with large differences in error percentage are used.Reference Meyer32, Reference Dallwitz34 Hence, an alternative approach is followed in this study, where only D i (or
 ) of the elements can be measured and then the vacancy wind effect can be calculated using Eqs. (8) and (9). Since we followed the diffusion couple technique, we could directly measure D i and in turn estimate the contribution of the vacancy wind effects. Previously, the same procedure was followed in the Ni–Al system,Reference Paul, Kodentsov and van Loo38 which exhibits atomic ordering. However, the Ni–Pt and Co–Pt systems are more suitable to examine the contribution because of random nature based on which the theory of vacancy wind effect proposed by Manning was developed. It can be seen from our results that the contribution of vacancy wind effect on different elements vary significantly as a function of composition. Most importantly, the contribution of the vacancy wind effect on the diffusion coefficients of the faster diffusing species, which mainly control the interdiffusion process, is insignificant [Figs. 13(a) and 13(b)]. Similar result was found in the β-NiAl phase by Paul et al.Reference Paul, Kodentsov and van Loo38 In the Al-rich side of the phase, Al had around three order higher diffusion rate compared with Ni; however, the contribution of the vacancy wind effect was still not significant. The difference is less than the error limit associated with the measuring technique.
V. CONCLUSIONS
An experimental study on the interdiffusion process in Ni–Pt and Co–Pt binary alloy systems was conducted by employing the binary and multifoil diffusion couple techniques. The variation of interdiffusion coefficients with composition at different temperatures is calculated from bulk diffusion couple experiments. Intrinsic and tracer diffusion coefficients at different compositions are estimated from multifoil diffusion couple experiments using thermodynamic parameters calculated from the activity data. In both the systems, Pt is the slower diffusing species, and hence the interdiffusion process is controlled by the diffusion of Ni in the Ni–Pt system and by Co in the Co–Pt system. A comparison of the tracer and intrinsic diffusion coefficients indicates that the thermodynamic driving force plays an important role in making the intrinsic diffusion coefficients of Co and Ni higher in the composition range of 30–70 at.% Pt. Higher values of interdiffusion coefficients are also found in the same range since the interdiffusion process is mainly controlled by the faster moving species. The low activation energy for Co and Ni impurity diffusion in Pt compared with Pt in Ni and Co indicates that the size of the atoms play an important role as well with the smaller-sized species (Ni and Co) diffusing faster. The intrinsic diffusion coefficients are calculated directly from the experiments. Following, we calculated the contribution of the vacancy wind effect along with the tracer diffusion coefficients. The contribution of vacancy wind effects was found to depend on the difference between the mobilities of the species. We have shown that it can be neglected in determining the diffusion parameters since the difference falls in the range of experimental scatter.
ACKNOWLEDGMENT
We acknowledge the financial support of Aeronautical Research and Development Board, India in carrying out this research.