Introduction
A persistent debate in paleobiology concerns the mechanisms that drive macroevolutionary patterns. Some argue that physical or extrinsic factors have been the primary driver of macroevolution (e.g., Gould Reference Gould1985; Benton Reference Benton2009). Others argue that Phanerozoic diversity patterns, particularly diversity equilibrium and radiations, were controlled by extinction and origination driven by biotic interactions such as competition and predation (Walker and Valentine Reference Walker and Valentine1984; Alroy Reference Alroy2008, Reference Alroy2010). Previous work also shows that Phanerozoic diversity patterns are closely correlated with occurrences of predation traces and niche specialization among marine groups (Huntley and Kowalewski Reference Huntley and Kowalewski2007; Nürnberg and Aberhan Reference Nürnberg and Aberhan2015). Furthermore, adaptive radiations resulting from biotic interactions have been argued to have driven diversity patterns during some intervals of the Phanerozoic, such as the early to mid-Paleozoic and Mesozoic (Vermeij Reference Vermeij1987, Reference Vermeij2004, Reference Vermeij2008).
During the Mesozoic in particular, major ecological innovations spurred by the rise of durophagous predators and bioturbators changed the ecological structure of benthic marine macroinvertebrate communities, and thus this transition has been called the Mesozoic marine revolution (Vermeij Reference Vermeij1977; Thayer Reference Thayer1979, Reference Thayer1983). A previous attempt to test the role of biotic interactions on the structure of Jurassic marine benthic invertebrate communities using global fossil occurrence data yielded mixed results, but it largely supported a role for biotic interactions in structuring benthic communities (Aberhan et al. Reference Aberhan, Kiessling and Fürsich2006). However, the study was criticized in part because of its global scope (Vermeij Reference Vermeij2008). Building on the approach of Aberhan et al. (Reference Aberhan, Kiessling and Fürsich2006), we revisit the role of biotic interactions in structuring Jurassic marine benthic ecosystems, using additional global fossil occurrence data entered over the past 11 years, and by tracking changes in groups with escalation-sensitive traits within geographic regions and within depositional environments.
Mesozoic Marine Revolution and Escalation
Perhaps no other time interval in the Phanerozoic is more closely associated with biotic interactions driving macroevolutionary patterns than the Mesozoic (e.g., Vermeij Reference Vermeij1977, Reference Vermeij1987). Following the end-Permian mass extinction, the Mesozoic is characterized by the rise in prominence, in both taxonomic and ecologic diversity, of the modern evolutionary fauna, composed primarily of bivalves, gastropods, echinoids, scleractinian corals, and decapods (Sepkoski Reference Sepkoski1981, Reference Sepkoski1984).
This rise in dominance of the modern evolutionary fauna has been attributed to an increase in marine nutrient availability (Bambach Reference Bambach1993; Martin Reference Martin1996; Martin et al. Reference Martin, Quigg and Podkovyrov2008; Cárdenas and Harries Reference Cárdenas and Harries2010; Martin and Quigg Reference Martin and Quigg2012; Allmon and Martin Reference Allmon and Martin2014). Increased nutrient availability is thought to have allowed benthic groups, particularly mollusks, to become larger and fleshier, making them attractive prey items (Bambach Reference Bambach1993). An increase in fleshier prey led to an increase in predators and predation pressure (Vermeij Reference Vermeij1977, Reference Vermeij1987; Walker and Brett Reference Walker and Brett2002). Prey species adapted to this predatory pressure by developing escape and defensive mechanisms, including burrowing, increased motility, stronger cementation to hard substrates, increased shell thickness, narrowed apertures, and stronger ornamentation with ribs or spines, or by inhabiting marginal environments, (Vermeij Reference Vermeij1977, Reference Vermeij1987; Harper Reference Harper1991, Reference Harper2003; Harper and Skelton Reference Harper and Skelton1993; Oji Reference Oji1996).
The Mesozoic also marks an increase in benthic bioturbators, including echinoids, malacostracan arthropods, and deposit-feeding bivalves, and this increase coincided with major changes in benthic community structure (Thayer Reference Thayer1983). For example, bioturbators displaced sessile and byssally attached epifauna on soft substrates, which often resulted in mortality of sessile organisms because of their inability to reattach or reorient once disturbed (Thayer Reference Thayer1983). Bioturbation also resuspends sediment into the water column, which can hamper suspension feeding or result in burial of epifaunal organisms (Thayer Reference Thayer1983). Displaced epifaunal groups, which include stationary unattached and byssally attached bivalves, brachiopods, crinoids, corals, and sponges, became increasingly limited to hard substrates where the effects of bioturbation are reduced (Thayer Reference Thayer1983). Increased bioturbation during the Mesozoic also likely contributed to the increase in nutrient availability, as reworking of sediment releases nutrients into the water column (Thayer Reference Thayer1983).
The Mesozoic rise of predators and bioturbators led to the formulation of the escalation hypothesis, unidirectional selection that was driven by antagonistic interactions between species, such as predator–prey interactions (Vermeij Reference Vermeij1987, Reference Vermeij1994, Reference Vermeij2004, Reference Vermeij2013; Dietl and Kelley Reference Dietl and Kelley2002; Dietl Reference Dietl2003). Such unidirectional selective pressure exerted by one species onto another forces the species under selective pressure to adapt, which can result in speciation (Vermeij Reference Vermeij1987). Those groups that were not able to adapt to these increased biotic pressures became extinct or were marginalized and forced to inhabit less-productive habitats (Vermeij Reference Vermeij1987). Although escalation is difficult to test directly, owing to the difficulty of observing interactions in the fossil record, the potential evolutionary consequences of escalation can be detected (Vermeij Reference Vermeij1987; Kelley and Hansen Reference Kelley and Hansen1993, Reference Kelley and Hansen1996).
Reevaluating Tests of Escalation
Previous attempts to test the role of escalation on global macroevolutionary patterns have shown no statistically significant correlations between diversity trajectories of interacting groups (Madin et al. Reference Madin, Alroy, Aberhan, Fürsich, Kiessling, Kosnik and Wagner2006) or mixed results, with some trends supporting escalation and others not (Aberhan et al. Reference Aberhan, Kiessling and Fürsich2006). These studies have been criticized for being conducted on a scale too broad to detect escalation or for their focus on diversity as an indicator of escalation (Dietl and Vermeij Reference Dietl and Vermeij2006; Roopnarine et al. Reference Roopnarine, Angielczyk and Hertog2006; Vermeij Reference Vermeij2008). To test for escalation, Vermeij (Reference Vermeij2004, Reference Vermeij2008) argued that studies must compare (1) specific adaptive traits at (2) local to regional scales in (3) similar depositional environments and (4) preferably in the tropics, where abundant resources and well-oxygenated warm waters can sustain the interactions that lead to escalation. Specific adaptive traits need to be compared to determine whether these traits changed as predicted by escalatory pressure (Vermeij Reference Vermeij2008). If escalation is argued to occur at the local and regional scale, it needs to be tested at these scales (Vermeij Reference Vermeij2008). Similar depositional environments are required so that oceanographic conditions with similar levels of resource availability, oxygenation, and other environmental factors are compared (Vermeij Reference Vermeij2008). Tropical regions are preferred for testing escalation because the characteristic environmental conditions of these regions (productive, well-oxygenated warm waters) are necessary for sustaining escalatory interactions (Vermeij Reference Vermeij2004), although not always (Vermeij Reference Vermeij2008).
The Jurassic represents a crucial interval of the Mesozoic marine revolution when adaptive radiations resulting from escalation apparently caused the diversification of many marine benthic invertebrate groups (Vermeij Reference Vermeij2008). If escalation drove diversity and abundance patterns in the Jurassic, it is important to determine when and where escalation took place. Before the role of biotic interactions in shaping global diversity and abundance patterns can be evaluated, it is important to test whether escalation occurred in particular regions or environments.
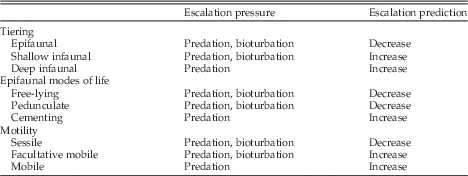
The goal of this study is to determine whether any specific regions and environments experienced ecological trends consistent with escalation during the Jurassic, when these trends occurred, and whether these trends occurred synchronously among regions and environments. This study builds on the approach used by Aberhan et al. (Reference Aberhan, Kiessling and Fürsich2006) in four ways. First, twice as much data are available now than were previously. Second, the spatial distribution of occurrences has increased. Third, this study focuses on patterns of occurrences at the regional scale rather than the global scale or low versus high latitudes. Fourth, this study compares patterns of occurrences among four depositional environments. Following Vermeij (Reference Vermeij1987), we predict that the proportion of occurrences of infauna and mobile and cementing epifauna should increase during the Jurassic, while free-lying (unattached to substrate) sessile epifauna is expected to decrease if escalation occurred (Table 1).
Expected escalatory pressure and predicted effects during the Jurassic based on Vermeij (Reference Vermeij1987).

Data and Methods
The Jurassic occurrence data set used for this study was downloaded from the Paleobiology Database (https://paleobiodb.org) on 20 February 2016 and consists of non-reef benthic macroinvertebrate species of bivalves, gastropods, brachiopods, echinoderms, corals, sponges, and arthropods body fossil occurrences. Ichnological data were not included in this study because these data are sparse in the Paleobiology Database and no other database exists for the Jurassic that can be analyzed quantitatively. The inclusion of arthropods and other non-echinoid echinoderms expands on the taxonomic groups considered by Aberhan et al. (Reference Aberhan, Kiessling and Fürsich2006). The data also include information on tiering, feeding strategy, motility, lithology, and depositional environment, as well as paleolatitude and paleolongitude coordinates determined from a GPlates paleogeographic rotation model (Wright et al. Reference Wright, Zahirovic, Müller and Seton2013). Senior synonyms were used where available, and the synonyms as well as ecological data for bivalves were updated using ecological data collected by one of the authors (M.A.).
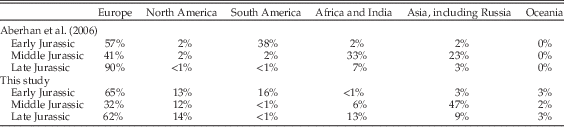
A total of 47,340 occurrences were downloaded. After occurrences that lack Jurassic stage designations were removed, the data analyzed consist of 43,961 occurrences from 9864 collections. This data set is almost twice as large as that analyzed by Aberhan et al. (Reference Aberhan, Kiessling and Fürsich2006), which contained more than 22,000 occurrences from more than 2800 collections (Table 2). The global distribution of occurrences has also increased, lessening the European dominance of occurrences in Aberhan et al. (Reference Aberhan, Kiessling and Fürsich2006). For example, in their 2006 study, European occurrences represented 41% of Middle Jurassic and 90% of Late Jurassic occurrences (Table 2). In contrast, European occurrences in this study constitute 32% of Middle Jurassic and 62% of Late Jurassic global occurrences (Table 2). This improved geographic coverage allows occurrence patterns from multiple regions to be analyzed with greater reliability.
Geographic distribution of Jurassic occurrences of non-reef bivalves, gastropods, brachiopods, echinoids, corals, and sponges downloaded from the Paleobiology Database in this study, compared with that of Aberhan et al. (Reference Aberhan, Kiessling and Fürsich2006). The data set used by Aberhan et al. (Reference Aberhan, Kiessling and Fürsich2006) consists of more than 22,000 occurrences and more than 2,800 collections compared with occurrences used in this study, which consists of 43,961 occurrences and 9,864 collections and includes arthropods and other groups of echinoderms. The data used by Aberhan et al. (Reference Aberhan, Kiessling and Fürsich2006) were downloaded on 19 December 2004 and the data used for this study were downloaded on 20 February 2016.

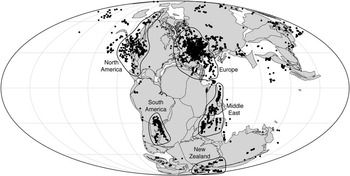
Five regional clusters of occurrences were manually selected based on paleocoordinates of each occurrence (Fig. 1). Occurrences lying within each region were determined with the pnt.in.poly function in the ‘SDMTools’ package in R (VanDerWal et al. Reference VanDerWal, Falconi, Januchowski, Shoo and Storlie2014; R Core Team 2016). Occurrences from these five regions represent 89% of the downloaded global occurrences and are named based on the continents where the occurrences are concentrated: North America, Europe, South America, Middle East (including parts of Africa and India), and New Zealand. Data are available for every stage for most regions, except the Middle East region, which lacks occurrences for the first three Jurassic stages, and New Zealand, which lacks occurrences for the Bathonian and Oxfordian stages.
Jurassic (173 Ma) global paleogeographic reconstruction, based on GPlates software using the rotation model from Seton et al. (Reference Thayer2012), showing Paleobiology Database occurrences. Occurrences are plotted approximately, as they span the entire Jurassic and are plotted here in a single time slice. Occurrences plotted using ArcMap (Environmental Systems Research Institute Reference Erwin2016).

As outlined by Vermeij (Reference Vermeij2008), ecological traits need to be compared by environment to test for escalation. Reliable environmental data are consistently available only for Europe. Within Europe, 29 different depositional environments have been reported, and these were grouped into five categories (nearshore, inner shelf, middle shelf, outer shelf, and slope and deep basin) following the time–environment framework of Bottjer and Jablonski (Reference Bottjer and Jablonski1988).
Species occurrences are used here as proxy for relative abundance, as abundance data in the Paleobiology Database are not standardized. In addition, occurrences have been shown to be suitable for assessing abundances (Buzas et al. Reference Buzas, Koch, Culver and Sohl1982; Aberhan et al. Reference Aberhan, Kiessling and Fürsich2006; Liow and Stenseth Reference Liow and Stenseth2007; Hayek and Buzas Reference Hayek and Buzas2010; Payne et al. Reference Payne, Truebe, Nützel and Chang2011; McGhee et al. Reference McGhee, Clapham, Sheehan, Bottjer and Droser2013; Clapham Reference Clapham2015). Proportions of groups with specific traits selected by escalation were calculated for every Jurassic stage and for every environmental category for every stage within Europe.
Escalation-sensitive ecological traits are grouped into three categories: tiering, epifaunal modes of life, and motility (Table 1). Confidence intervals (95%) for all proportions were calculated based on the method of Raup (Reference Raup1991). Spearman’s rank correlation tests were conducted on all time series to determine statistically significant trends in escalation-sensitive traits (Tables 3–5). All calculations were performed in R (R Core Team 2016). Source code and occurrence files used for this study are deposited in Dryad.
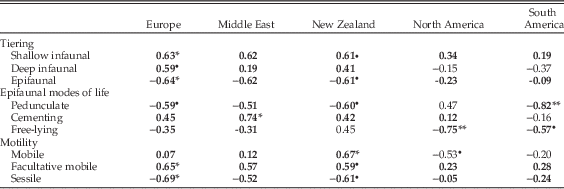
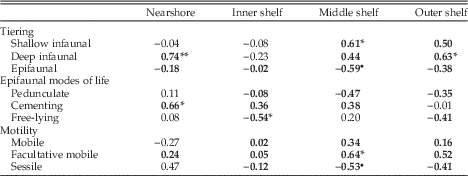
Spearman’s rank correlation test of changes in ecological traits over time by region through the Jurassic. Bold type indicates trends that are in the expected direction, with the sign of the correlation coefficient indicating thedirection of predicted escalatory pattern. Value of Spearman’s ρ is shown, with significance codes for p-values: ***p<0.001; **p<0.01; *p<0.05; ∙p<0.1.

Spearman’s rank correlation test of changes in ecological traits over time by environment in the European region through the Jurassic. Environmental categories follow the five-zone classification of Bottjer and Jablonski (Reference Bottjer and Jablonski1988). Bold type indicates trends that are in the expected direction, with the sign of the correlation coefficient indicating the direction of predicted escalatory pattern. Value of Spearman’s ρ shown, with significance codes for p-values: ***p<0.001; **p<0.01; *p<0.05; ∙p<0.1.

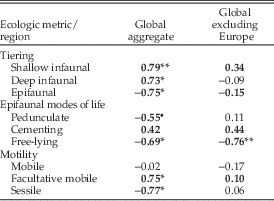
Spearman’s rank correlation test of changes in ecological traits over time during the Jurassic at the global scale and global scale without Europe. Bold type indicates trends that are in the expected direction, with the sign of the correlation coefficient indicating the direction of predicted escalatory pattern. Values of Spearman’s ρ shown with significance codes for p-values: ***p<0.001; **p<0.01; *p<0.05; ∙p<0.1.

Results
Our regional analyses reveal that ecological trends consistent with escalation are generally lacking, although, at least one trend consistent with escalation occurs in every region.
Regional Variation
Tiering
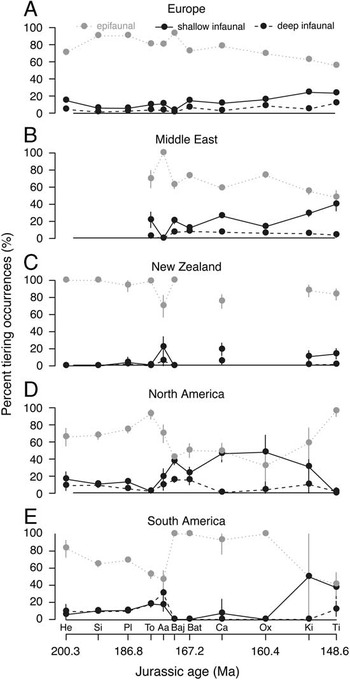
For all regions, epifaunal is the most common tier, (Fig. 2A–E); deep infaunal occurrences are generally static through the Jurassic. Only Europe exhibits statistically significant (i.e., nonzero) trends in tiering (Table 3). In Europe, epifaunal occurrences begin a monotonic decrease during the Bajocian driven by a decline in rhynchonelliform brachiopods, with a concomitant increase of shallow infaunal occurrences that continues through the end of the Jurassic (Fig. 2A).
Percent occurrences by tiering for each Jurassic stage for A, Europe; B, Middle East; C, New Zealand; D, North America; and E, South America. Escalatory trends predicted to increase through the Jurassic are shown in black; trends predicted to decrease are shown in gray. The 95% confidence intervals are indicated; where confidence intervals are absent, they are too narrow to be shown. Time-series correlations are summarized in Table 3. Geologic ages are the midpoint of stages based on the 2015 International Commission of Stratigraphy chronostratigraphy chart (Cohen et al. Reference Dietl2013). He, Hettangian; Si, Sinemurian; Pl, Pliensbachian; To, Toarcian; Aa, Aalenian; Baj, Bajocian; Bat, Bathonian; Ca, Callovian; Ox, Oxfordian; Ki, Kimmeridgian; Ti, Tithonian.

Most tiering trends are not consistent with escalation; however, shallow infaunal and epifaunal trends in Europe are consistent with Vermeij’s (Reference Vermeij1987) escalation hypothesis. Additionally, deep infaunal occurrences show no net trend in most regions, and they provide no evidence for or against escalation. Furthermore, insufficient data for New Zealand and wide confidence intervals in the latest Jurassic in South America make it difficult to identify trends.
Epifaunal Modes of Life
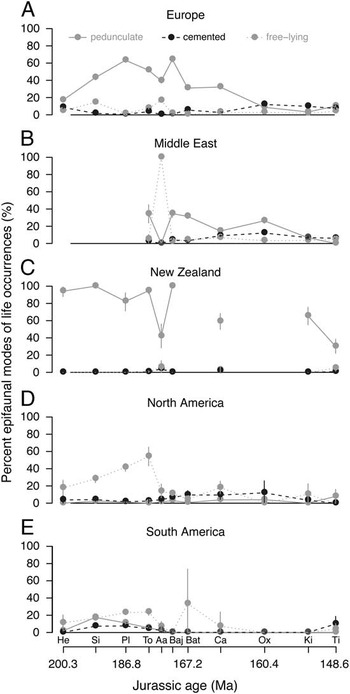
Pedunculate brachiopods (rhynchonelliforms) constitute the largest proportion of epifauna, and they generally decrease during the latter half of the Jurassic (Fig. 3A–E). This decrease in pedunculate occurrences can be observed in every region except North America, but only in South America is their decrease statistically significant. In general, the proportion of free-lying epifaunal occurrences fluctuates in all regions in the early half of the Jurassic followed by a general decrease. This trend of decreasing free-lying occurrences during the latter half of the Jurassic is most pronounced in North America, where the trend is statistically significant (Table 3). Cementing epifauna appear to increase in Europe and the Middle East (Fig. 3A, B), but this trend is only statistically significant in the Middle East.
Percent occurrences of epifaunal modes of life for each Jurassic stage by region: A, Europe; B, Middle East; C, New Zealand; D, North America; and E, South America. For abbreviations, see caption to Fig. 2. Time-series correlations are summarized in Table 3.

Epifaunal mode-of-life trends overall are not consistent with escalation; however, the observed decrease in pedunculate and free-lying epifaunal occurrences and the increase in cementing bivalves are all consistent with escalation.
Motility
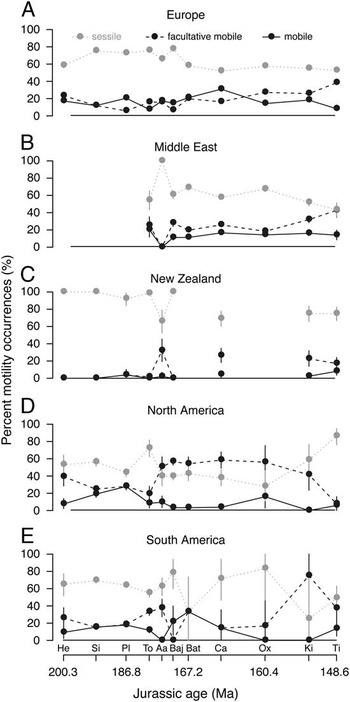
Overall, sessile groups decrease throughout the Jurassic, while facultative mobile groups increase throughout (Fig. 4A–E). In Europe, the increase in facultative mobile occurrences and decrease in sessile occurrences are statistically significant (Table 3). The proportion of fully mobile groups shows no net trend throughout the Jurassic, except for an increase in New Zealand, where the trend is statistically significant.
Percent occurrences by motility for each Jurassic stage by region: A, Europe; B, Middle East; C, New Zealand; D, North America; and E, South America. For abbreviations, see caption to Fig. 2. Time-series correlations are summarized in Table 3.

As with tiering and epifaunal mode-of-life trends, motility trends overall are not consistent with escalation, except for the observed decreases in sessile occurrences and increases in facultative mobile occurrences. The increase in facultative mobile occurrences is primarily driven by the increase in shallow infaunal occurrences. Epifaunal occurrences that are facultative mobile consist primarily of swimming pectinid and entoliid bivalves. The relatively static patterns in actively mobile species neither support nor refute escalation.
Environmental Variation
The abundance of data from a range of environments in Europe allows escalatory trends there to be compared among environments; however, data are missing for deep-slope and basin environments and therefore could not be analyzed. Escalatory trends in Europe are most strongly developed in nearshore and middle-shelf environments but are also present in outer-shelf environments.
Tiering
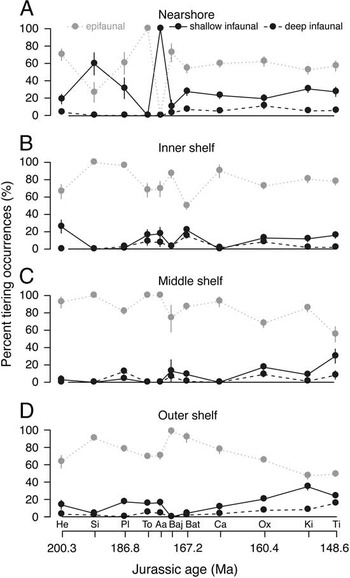
Occurrence patterns by tiering are similar in most depositional environments, with epifaunal occurrences dominating throughout (Fig. 5A–D). In nearshore and inner-shelf environments, tiers generally display little or no net change through the Jurassic except for deep infauna, which show a statistically significant increase in nearshore environments (Fig. 5A, B, Table 4), although they represent a minor portion of occurrences. This trend is driven primarily by pholadomyid, thraciid, and lucinid bivalves. In middle- and outer-shelf environments, epifauna decline in the latter half of the Jurassic as shallow infauna increase (Fig. 5C, D); however, the only statistically significant trends are the shallow infaunal increase in middle-shelf environments and the deep infaunal increase in outer-shelf environments (Table 4).
Percent occurrences by tiering in the Europe region by Jurassic stage in four depositional environments: A, Nearshore; B, Inner shelf; C, Middle shelf; and D, Outer shelf. For abbreviations, see caption to Fig. 2. Time-series correlations are summarized in Table 4.

Overall, tiering trends consistent with escalation are scarce; however, trends consistent with escalation occur in nearshore as well as middle- to outer-shelf environments, which is surprising, considering that escalation is thought to be restricted to shallower-water environments (see “Discussion”). Furthermore, the decline of epifauna and increase of shallow infauna in the latter half of the Jurassic in Europe (Fig. 2A) are likely driven by the trends in middle- and outer-shelf environments.
Epifaunal Modes of Life
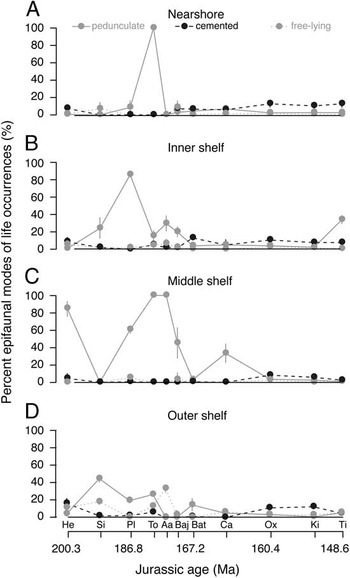
Pedunculate forms make up much of the epifaunal occurrences in all environmental categories and dominate the first half of the Jurassic. Although they appear to decline during the latter half of the Jurassic, none of these trends are statistically significant (Fig. 6A–D, Table 4). Additionally, although cementing epifauna appear to increase steadily through the latter half of the Jurassic in the nearshore and inner shelf (Fig. 6A, B), with a net increase in the middle shelf as well (Fig. 6C), only in the nearshore is this trend statistically significant (Table 4). Overall, free-lying occurrences show no net trend through the Jurassic, except a decline in the inner shelf (statistically significant) and the outer shelf throughout the latter half of the Jurassic.
Percent occurrences of epifaunal modes of life in Europe by Jurassic stage in four depositional environments” in the first sentence: “environments: A, Nearshore; B, Inner shelf; C, Middle shelf; and D, Outer shelf. For abbreviations, see caption to Fig. 2. Time-series correlations are summarized in Table 4.

Overall, epifaunal mode-of-life trends are not consistent with escalation, but the increase in cementing forms in nearshore settings is consistent with escalation. Cementing bivalves in the nearshore are dominated by species of Gryphaeidae (Nanogyra and Liostrea) and Ostreidae. Additionally, the general decrease in pedunculate forms is also consistent with escalation; however, they were predicted to increase in deeper-water environments to avoid predation (Vörös Reference Vörös2005), which is not observed.
Motility
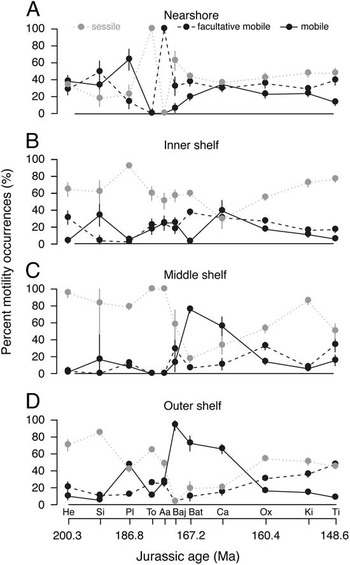
In general, mobile species decrease or are static in every environment following a sharp increase during the Middle Jurassic (Fig. 7A–D). Facultative mobile occurrences increase in nearshore, middle-shelf (statistically significant), and outer-shelf environments throughout the Jurassic, particularly through the latter half of the Jurassic (Fig. 7A, C, D). Sessile occurrences dominate during the Early and Late Jurassic, except in nearshore settings, where sessile occurrences are low during much of the Early Jurassic (Fig. 7A).
Percent occurrences by motility in the Europe region by Jurassic stage in four depositional environments: A, Nearshore; B, Inner shelf; C, Middle shelf; and D, Outer shelf. For abbreviations, see caption to Fig. 2. Time-series correlations are summarized in Table 4.

Motility trends in general do not support the escalation hypothesis. Sessile occurrences are expected to decrease through time in shallow environments while increasing in deeper environments (Vermeij Reference Vermeij1987), but that is not the case in middle- and outer-shelf environments, in which motility instead increased. The sharp increase of mobile occurrences during the Bajocian in outer-shelf environments is driven primarily by several families of grazing gastropods. Furthermore, the increase of facultative mobile occurrences through the Jurassic in the middle and outer shelf is driven by 18 shallow infaunal bivalve families, especially the Arcticidae and Mactromyidae.
Discussion
The Role of Regional Biotic Interactions on Global Ecological Trends
This analysis reveals heterogeneous ecological signals among regions during the Jurassic, with weak evidence of escalation overall. Directional trends consistent with escalation are most pronounced in Europe, where tiering (epifaunal and shallow infaunal) and motility (sessile and facultative mobile) change as predicted with the escalation hypothesis. Similar patterns consistent with escalation are also observed in the Middle East and New Zealand (albeit mostly not statistically significant). The only observed trends consistent with escalation in North and South America are the decrease in free-lying forms and the decrease in pedunculate occurrences in South America, as most trends in these two regions contradict or are neutral with regard to the escalation hypothesis.
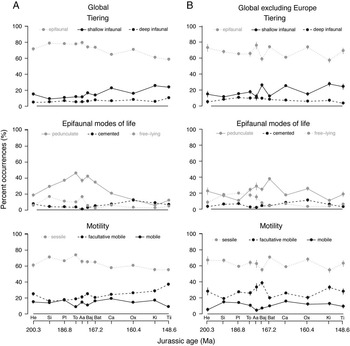
The ecological trends in Europe are largely consistent with the global results of Aberhan et al. (Reference Aberhan, Kiessling and Fürsich2006), particularly trends in motility, epifaunal guilds, and tiering. In their study, Aberhan et al. (Reference Aberhan, Kiessling and Fürsich2006) noted that most of the occurrences they analyzed were culled from Europe as a result of the uneven distribution of Jurassic strata around the world. This dominance of European occurrences suggests that their global patterns were likely driven by European patterns. Even with improved global coverage in this study, more than 55% of occurrences are from Europe. To determine the importance of European occurrences to global ecological trends, we compared trends globally with and without Europe (Fig. 8, Table 5). Our global occurrence trends are consistent with the results of Aberhan et al. (Reference Aberhan, Kiessling and Fürsich2006), and they show directional trends consistent with escalation, particularly in tiering, epifaunal guilds (free-lying), and motility (facultative mobile and sessile; Fig. 8A). Excluding Europe from the global aggregate weakens the directional trends consistent with escalation, such that only free-lying forms exhibit escalatory trends (Fig. 8B, Table 5). These results suggest that global ecological patterns are indeed driven largely by patterns in Europe.
Comparison of global-ecological trait trends including Europe (A) and excluding Europe (B) for each Jurassic stage. The global data consist of 43,961 occurrences compared with 19,401 non-European occurrences; the number of non-European occurrences is almost equal to the global number of occurrences used by Aberhan et al. (Reference Aberhan, Kiessling and Fürsich2006). For abbreviations, see caption to Fig. 2. Time-series correlations are summarized in Table 5.

European occurrence data broken down by depositional environment reveal patterns that are unexpected, as the ecological trends consistent with escalation occur in nearshore as well as middle- to outer-shelf environments (Figs. 5–7). Although the presence of escalatory trends supports Vermeij’s (Reference Vermeij1987) hypothesis, the observation that they are also apparent in deeper-water environments does not. Vermeij (Reference Vermeij1987) postulated that deeper environments would become refugia for benthic organisms that are unable to cope with the increased predation and bioturbation pressure in shallower environments. In his later analysis of escalation during the Jurassic, Vermeij (Reference Vermeij2008) conceded that escalation might occur in any environment at any time, as long as the productive conditions required to sustain escalatory interactions were present, suggesting that escalation is not exclusive to shallow tropical environments. Regardless, these results suggest the trends observed in Europe are driven by patterns in nearshore and middle- to outer-shelf environments.
The results of this study underline the importance of dissecting global data regionally and environmentally to understand underlying drivers of global biotic patterns (e.g., Miller Reference Miller1997a, Reference Millerb, Reference Miller2000, Reference Miller2003). Our finding that escalatory trends are prevalent in Europe raises the question of why strong escalatory trends occur in this region and not others?
Was the Western Tethys a Focal Point for Escalation?
During the Jurassic, Europe was located in the tropical to subtropical western Tethys realm (Fig. 1). The occurrences in Europe span a paleolatitudinal range of 8°N to 52°N, with the bulk of occurrences clustered around 30°N (Fig. 1). This region is dominated by species from carbonate deposits, which constitute approximately 70% of European occurrences, and the Middle East also primarily consists of carbonate occurrences with 65%. These two regions are much more carbonate dominated than the other regions: New Zealand (2% carbonate deposits), North America (32% carbonate deposits), and South America (33% carbonate deposits). This pattern reveals a lithologic underpinning to regions that demonstrate some trends consistent with escalation that likely represent warmer, more biologically productive regions, which is argued to be conducive of escalation (Vermeij Reference Vermeij1987, Reference Vermeij2004, Reference Vermeij2008).
The dominance of occurrences from carbonate deposits in Europe is consistent with the escalatory trends observed in this region, but it still does not fully explain the presence of escalatory trends in deeper-water environments that are generally less productive and nutrient rich than shallow-water environments (Vermeij Reference Vermeij1987). Geochemical analyses and studies on the Jurassic microfauna of the western Tethys suggest that increased nutrient availability and biological productivity was spurred by changes in ocean circulation and increased continental runoff (Bill et al. Reference Bill, O’Dogherty, Guex, Baumgartner and Masson2001; Aguado et al. Reference Aguado, O’Dogherty and Sandoval2008; Reolid et al. Reference Reolid, Nagy, Rodríguez-Tovar and Olóriz2008; Baumgartner Reference Baumgartner2013). Increased nutrient availability in the western Tethys during the Middle Jurassic would have coincided with changes in ecological signals that are consistent with escalation, suggesting a causal link. If increased nutrient availability did indeed drive the escalatory patterns observed in Europe and the Middle East regions, it would support Vermeij’s (Reference Vermeij1987, Reference Vermeij2004) hypothesis that high productivity is required for escalation to occur.
Alternative Explanations
Aberhan et al. (Reference Aberhan, Kiessling and Fürsich2006) correlated observed ecological trends with other possible abiotic and biotic explanations for escalatory patterns. Of abiotic controls beyond nutrients and temperature, they also examined sea-level change and seawater chemistry. Although sea level did increase through the latter half of the Jurassic (Hallam Reference Hallam2001), models suggest that sea-level change may or may not drive changes in habitat area and, therefore, biotic changes (Holland Reference Holland2012). Whether sea-level change drives changes in habitable space in a region depends on the starting sea-level position and shelf geometry (Holland Reference Holland2012). Since these parameters are difficult to establish for any basin, we did not compare sea-level changes with our results.
With regard to seawater chemistry, Aberhan et al. (Reference Aberhan, Kiessling and Fürsich2006) tracked shell mineralogy to test whether the ecological trends were overprinted by the geochemical state of Jurassic seas. During the latter half of the Jurassic, the oceans switched from an “aragonite” sea to a “calcite” sea, as a result of a declining seawater magnesium/calcium ratio (Hardie Reference Hardie1996; Lowenstein et al. Reference Lowenstein, Hardie, Timofeeff and Demicco2003; Müller et al. Reference Müller, Dutkiewicz, Seton and Gaina2013). Because the percentage of aragonitic shells increased during the Middle to Late Jurassic, seawater chemistry was inferred to not play a role in the observed ecological trends (Aberhan et al. Reference Aberhan, Kiessling and Fürsich2006). Following this approach, we tested whether the observed ecological trends could have been driven by a switch to a calcite sea. As in Aberhan et al. (Reference Aberhan, Kiessling and Fürsich2006), the percentage of fossil occurrences with aragonitic shells in this study increases after the Middle Jurassic at the global scale (see Supplementary Fig. 1), but also within Europe, suggesting that the trends observed in this study were not driven by changing seawater chemistry. Whether changes in seawater chemistry muted an even larger than observed increase in the percentage of aragonitic shells cannot be tested with the present data set.
Aberhan et al. (Reference Aberhan, Kiessling and Fürsich2006) also explored whether intrinsic biotic factors may have caused the perceived escalatory trends, particularly infaunalization. The reasoning for this analysis is that adaptation for burrowing that occurs within just a single clade might indicate adaptation independent of predation pressure. If several clades that share a specific trait show similar increases in relative abundance, then it is likely that some external factor might have promoted that trait and led to its proliferation, such as an increased escalatory pressure. In this study, several bivalve taxa show similar increases in infaunal occurrences (Cardiida, Carditida, Pholadida, Trigoniida, Nuculida, and Nuculanida among others; Aberhan et al. Reference Aberhan, Kiessling and Fürsich2006), and therefore it is unlikely that ecological trends observed are a result of intrinsic biotic factors.
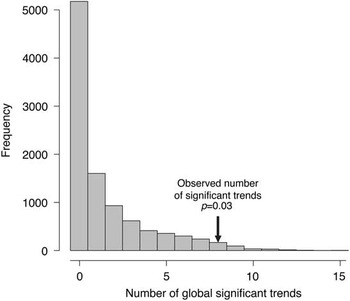
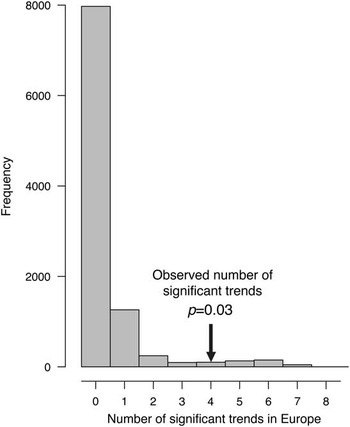
Relatively few statistically significant trends consistent with escalation were recognized here, raising the question of how many trends would be developed by chance alone? To test this, we simulated 10,000 iterations of a null model by conducting a random permutation of time stages followed by Spearman’s rank correlation tests. This analysis allows us to determine if the number of observed statistically significant trends is more or less than ought to occur by chance. The results of this analysis for all regions aggregated and for Europe separately suggest that more significant trends were observed than would be expected by chance (global: p=0.03, Europe: p=0.03; Figs. 9 and 10), suggesting weak but statistically significant patterns of ecological signals associated with escalation.
Random permutation of time stages followed by Spearman’s rank correlation tests using 10,000 iterations for all 45 tests conducted in all regions. The observed number of statistically significant trends is eight (Table 3), and only 355 of 10,000 permutations equal or exceed this, for a p-value of 0.03.

Random permutation of time stages followed by Spearman’s rank correlation tests using 10,000 iterations for all nine tests conducted in Europe. The observed number of statistically significant trends is four, and only 327 of 10,000 permutations equal or exceed this, for a p-value of 0.03.

Statistical power may also play a role in the number of significant trends observed in this study. The availability of few time bins for this study (N=11) reduces the statistical power and favors statistical insignificance, because the probability of rejecting a null hypothesis decreases with small sample size. Although statistical significance is used here to establish which directional trends are consistent with escalation, many other ecological trends are also directional and consistent with escalation but are not statistically significant, particularly during the latter half of the Jurassic. It is possible that statistical testing may fail to detect true biological signals, owing to low sample size and low power.
Although, the decrease in epifaunal occurrences in Europe is consistent with the escalation hypothesis, at least four other factors could contribute to this pattern. First, because Europe has the highest amount of epifaunal occurrences during the Jurassic, it has great potential for experiencing a detectable drop in epifauna. It is possible that it is simply easier to detect the epifaunal decline in Europe than in regions that began the Jurassic with a comparatively lower number of epifauna.
Second, a decline in hard substrates may have driven the Jurassic decline in attached epifauna. Although it is possible that the frequency of hardgrounds declined during the Jurassic, quantitative data to test this is not available. Because attached epifaunal species could have colonized to secondary hardgrounds consisting of shells and skeletal debris (Kidwell and Jablonski Reference Kidwell and Jablonski1983) and because many other epifaunal species were free-lying on soft substrates, it seems unlikely that the decline in epifauna solely reflects a decline in hardgrounds.
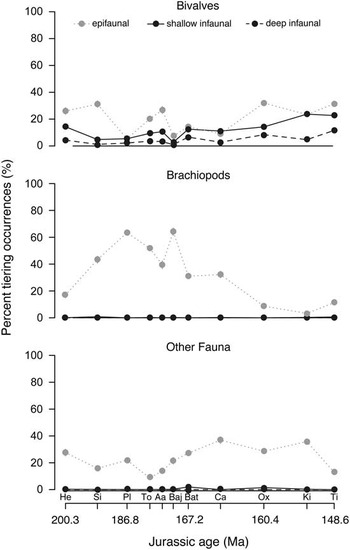
Third, the decrease in epifauna, driven largely by the decline in pedunculate rhynchonelliform brachiopods, might also be explained by competitive exclusion with bivalves (Tomasovych Reference Tomasovych2006). The data presented here do indicate a modest (but not statistically significant) rise in epifaunal and shallow infaunal bivalves during the Late Jurassic (Fig. 11, Supplementary Table 1), consistent with the idea that brachiopods were replaced by bivalves. Although the replacement of brachiopods with bivalves has been attributed to the more efficient metabolism of bivalves (Tomasovych Reference Tomasovych2006), this difference in metabolism was present long before the replacement took place, casting doubt on the role of competition between brachiopods and bivalves (Payne et al. Reference Payne, Heim, Knope and McClain2014). The decline in brachiopods is mirrored by an increase in non-bivalve and non-brachiopod epifauna, some of which include predators such as asteroids and gastropods (Fig. 11). This pattern is consistent with previous arguments that biotic interactions such as predation were responsible for the decimation of Jurassic brachiopods in Europe as well as the observed increase in cementing bivalves (Donovan and Gale Reference Donovan and Gale1990; Harper Reference Harper1991; Harper and Wharton Reference Harper and Wharton2000; Vörös Reference Vörös2010; Tyler et al. Reference Tyler, Leighton, Carlson, Huntley and Kowalewski2013).
Percent occurrences by tiering of European taxonomic groups. Bivalves show a modest rise at the end of the Jurassic, while brachiopod occurrences sharply decrease. Rise of epifaunal non-bivalves and non-brachiopods is primarily driven by gastropods. Time series are summarized in Supplementary Table 1. For abbreviations, see caption to Fig. 2.

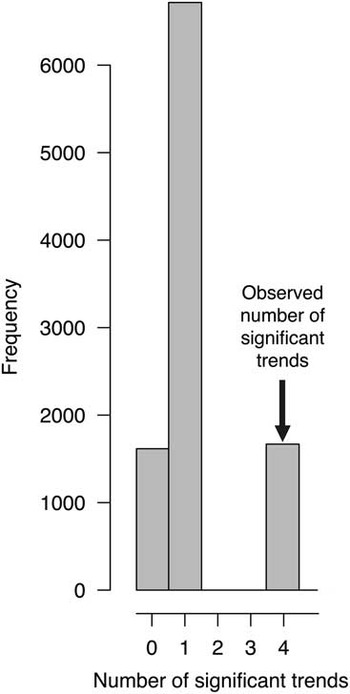
Fourth, because Europe accounts for 55% of all occurrences in this study, it is possible that the greater number of statistically significant trends there merely reflects the larger available sample size. To test this, we randomized occurrences among regions while preserving the age of occurrences and the number of occurrences in each region. For each of the 10,000 randomization trials, we calculated the number of statistically significant escalation trends in Europe, against which we can compare the actual number of significant European trends. If the observed number of trends in Europe is a consequence of sample size, randomization should produce a similar number of significant European trends, but if the observed number of European trends truly reflects a difference in Europe compared with the rest of the world, then the observed number of European trends should be greater than that seen in the randomization. The randomization confirms that the number of trends in Europe is not driven by sample size (Fig. 12).
Frequency distribution of statistically significant trends in Europe using a random permutation of occurrences by region followed by Spearman’s rank correlation tests using 10,000 iterations for all nine tests conducted. The observed number of statistically significant trends in Europe is four (Table 3), and only 1668 of 10,000 permutations equal or exceed this, for a p-value of 0.17.

Role of Escalation on Macroevolutionary Patterns
A central question in paleobiology concerns the driver of Phanerozoic diversity patterns (Sepkoski Reference Sepkoski1978, Reference Sepkoski1979, Reference Sepkoski1981, Reference Sepkoski1984; Alroy et al. Reference Alroy, Aberhan, Bottjer, Foote, Fürsich, Harries, Hendy, Holland, Ivany, Kiessling, Kosnik, Marshall, McGowan, Miller, Olszewski, Patzkowsky, Peters, Villier, Wagner, Bonuso, Borkow, Brenneis, Clapham, Fall, Ferguson, Hanson, Krug, Layou, Leckey, Nürnberg, Powers, Sessa, Simpson, Tomašových and Visaggi2008). Evidence exists for both abiotic and biotic drivers, with multiple studies outlining the role of physical, abiotic factors (Hallam Reference Hallam1989; Benton and Emerson Reference Benton and Emerson2007; Mayhew et al. Reference Mayhew, Jenkins and Benton2008, Reference Mayhew, Bell, Benton and McGowan2012; Peters Reference Peters2008; Benton Reference Benton2009; Erwin Reference Erwin2009), and others attributing macroevolutionary patterns to biotic factors (Walker and Valentine Reference Walker and Valentine1984; Huntley and Kowalewski Reference Huntley and Kowalewski2007; Alroy Reference Alroy2008; Alroy et al. Reference Alroy, Aberhan, Bottjer, Foote, Fürsich, Harries, Hendy, Holland, Ivany, Kiessling, Kosnik, Marshall, McGowan, Miller, Olszewski, Patzkowsky, Peters, Villier, Wagner, Bonuso, Borkow, Brenneis, Clapham, Fall, Ferguson, Hanson, Krug, Layou, Leckey, Nürnberg, Powers, Sessa, Simpson, Tomašových and Visaggi2008; Nürnberg and Aberhan Reference Nürnberg and Aberhan2015).
The escalation hypothesis presupposes certain physical conditions, including warm, productive, well-oxygenated environments (Vermeij Reference Vermeij1987, Reference Vermeij2004, Reference Vermeij2008). If these conditions are met in a given region, it is argued that escalation would occur and adaptations that arise in these regions will eventually spread to other regions and drive global diversity patterns (Vermeij Reference Vermeij2008). Therefore, both physical and biotic factors would synergistically drive macroevolutionary patterns if escalation is sustained over long periods of time. Furthermore, although escalation might occur at any given time and location, only during certain intervals of the Phanerozoic are macroevolutionary patterns attributed to escalation, particularly during the early to mid-Paleozoic and the mid- to late Mesozoic (Vermeij Reference Vermeij1987, Reference Vermeij2004, Reference Vermeij2008). This suggests that only during some intervals of the Phanerozoic were optimum conditions established on a wide enough and long enough scale to facilitate a role for escalation in macroevolutionary patterns.
Our results suggest that overall evidence for escalation is weak during the Jurassic, but escalation may be a plausible factor in driving regional macroevolutionary patterns through the latter half of the Jurassic in the western Tethys. A combined phylogenetic–biogeographic study is needed to test when and if the western Tethyan realm acted as a center of dispersal to other regions during the Cretaceous, leading to escalation on a global scale during the height of the Mesozoic marine revolution (Vermeij Reference Vermeij1977). Nevertheless, the results of this study underline the importance of dissecting global data regionally and environmentally to understand the dynamics of macroevolutionary patterns, be they driven by abiotic or biotic factors.
Conclusions
-
1. Regional Jurassic ecological trends related to escalation are rare. Some patterns, such as deep infaunal and fully mobile occurrences in most regions, exhibit few to no net trends through the Jurassic, and some trends even contradict the escalation hypothesis, particularly in North and South America.
-
2. Ecological trends are geographically heterogeneous. Most of the observed trends consistent with escalation occur in Europe, where the paleolatitudinal positions and carbonate-dominated environments of the western Tethys suggest tropical to subtropical, biologically productive regions. These physical conditions support Vermeij’s (Reference Vermeij2004, Reference Vermeij2008) argument that regions with warm, productive, well-oxygenated environments are more likely to sustain escalatory interactions. These results underline the importance of dissecting global patterns regionally to understand the dynamics of global macroevolutionary patterns.
-
3. Within Europe, ecological trends are heterogeneous among depositional environments and exhibit weak evidence for escalation overall. Trends that are consistent with escalation, such as an increase in infauna, cementing epifauna, and decrease in pedunculate forms, occur primarily in nearshore and middle-shelf environments but are also present to a lesser extent in inner-shelf and outer-shelf environments. Evidence of escalation in middle to outer-shelf environments is unexpected, as escalation has been argued to be restricted to shallower-water environments. These results also highlight the need to dissect global and regional data into environments to understand the dynamics of macroevolutionary patterns.
-
4. Other factors might contribute to the observed decrease in epifaunal occurrences in Europe, which dominates the global signal of Jurassic escalation. These factors include intrinsic mechanisms such as competitive displacement, extrinsic mechanisms such as availability of hard substrates, and statistical artifacts. None of these is sufficient to fully explain the observed ecological patterns in Europe, leaving escalation as the most plausible explanation.
Acknowledgments
We thank S. Danise, S. Goldstein, S. Walker, and B. Howes for helpful discussions. We also thank reviewers F. Fürsich and M. Clapham and associate editor W. Kiessling for their constructive and insightful reviews of the manuscript. We are grateful to the many people who contributed to the Paleobiology Database for the data used in this study. In particular, we thank major contributors M. Clapham, W. Kiessling, F. Fürsich, L. Villier, and J. Pálfy. M.A. thanks the German Science Foundation (DFG, grant AB 109/10). This is Paleobiology Database official publication No. 280.
Supplementary Material
Data available from the Dryad Digital Repository: http://dx.doi.org/10.5061/dryad.ds4gd