During disasters, emergency medical responders equipped with point-of-care testing (POCT) instruments, such as handheld devices and oxygen saturation monitors, are deployed to disaster sites.Reference Kost, Tran and Tuntideelert1 Local health system infrastructure may be inoperable or overwhelmed by the number of victims needing rapid on-site testing for triage and disaster management.
Hurricane Katrina demonstrated the need for field POCT to facilitate evidence-based triage and directed rescue.Reference Kost, Tran and Tuntideelert1 The portability of POCT instruments makes them ideal for use by emergency responders, such as disaster medical assistance teams (DMATs), to facilitate diagnosis, treatment, and appropriate backup care.
Disaster settings demand POCT under adverse conditions, such as high and low temperature and high humidity. Our objective was to assess whether glucose meter test strips and handheld blood gas analyzer cartridges can provide accurate results after exposure to high and low temperatures that may be encountered at disaster sites.
METHODS
POCT Systems and Reagents
The glucose meters and handheld blood gas analyzer were operated at room temperature. Meters and analyzer were not thermally stressed. Only the reagent test strips and cartridges were stressed. Stressed strips and cartridges were immediately tested while they were in the heated, cooled, or frozen state. Three glucose meter systems (GMS) were evaluated: 2 electrochemical (GMS 1-EC, GMS 2-EC) and 1 spectrophotometric (GMS 2-S) with 1 lot of glucose test strips for each. Test strips are single use and disposable. Glucose test strips were evaluated using aqueous quality control (QC) solutions supplied by the manufacturers. One glucose QC level was selected for each GMS to span the clinical range of glucose results commonly encountered. One lot of aqueous QC was used for each GMS.
We used a handheld blood gas analyzer (HHBG) with 1 lot of test cartridges. Single-use disposable cartridges were evaluated with level 1 RapidQC Complete blood gas QC solution (Bayer Healthcare, Tarrytown, NY), which is composed of buffered bicarbonate solution containing sodium, potassium, calcium, chloride, carbon dioxide, oxygen, nitrogen, glucose, lactate, and dyes. This solution was drawn into a syringe the day before the experiment, allowing the solution to stabilize, thereby avoiding drift in Po2 and Pco2 during testing, which used a paired differences approach to further minimize artifacts (see Statistical Analysis).
Control Levels
The mean (±standard deviation [SD]) glucose levels of the QC test solutions (N = 225) based on measurements obtained with control strips were 60.0 ± 3.9 mg/dL with coefficient of variation (CV) of 6.5% for GMS 1-EC, 111.4 ± 7.6 with CV of 6.8% for GMS 2-EC, and 137.3 ± 6.1 with CV of 4.4% for GMS 2-S. The mean Po2 and Pco2 levels were 162.5 ± 9.0 and 52.7 ± 6.4 mmHg with control cartridges (N = 45), respectively.
Stress
The temperatures selected for thermal stress were based on realistic conditions that emergency responders and DMATs may encounter, as described in the following section.
Protocol: High Temperature and Glucose Test Strip Measurements
Glucose test strips in original canisters were sealed watertight and placed into double waterproof sealed plastic bags, then submerged in a 40°C water bath for up to 4 weeks. For each of 3 trials, 5 test strips for each meter system were removed from the canister without replacement after 15, 30, and 60 minutes; 12, 24, and 72 hours; and 1, 2, and 4 weeks of thermal stress. Also, at each time point 5 control test strips were removed from canisters that were stored at room temperature (21°C). The order of testing (control vs stressed) was randomized at each time point and by GMS. If by random selection control strips were designated for testing first, then the control test strips for the specific GMS were tested first before testing the thermally stressed strips.
Protocol: Freezing and Thawing and Glucose Test Strip Measurements
Glucose test strips in original canisters were sealed watertight and placed into double waterproof sealed plastic bags, then in a freezer (−21°C) for durations up to 4 weeks. For each of 3 trials, a group of 5 test strips from each GMS was removed without replacement from the canister after 12, 24, and 72 hours; and 1, 2, and 4 weeks of stress, then immediately tested. Also, at each time point, a separate group of 5 test strips was removed from the canister and allowed to thaw for 30 minutes to room temperature before testing. The test order was randomized. Each group of test strips (ie, control, frozen, or thawed) was tested before beginning testing with the next group.
Protocol: Heating and Cooling of Cartridges and Blood Gas Measurements
Test cartridges in the original packaging were placed into double waterproof sealed bags and subjected to 4 static conditions: control (21°C), freezing (−21°C), heat (40°C), and cool (2°C). Cartridges were stressed for 12, 24, and 72 hours. For each of 3 trials, 5 sets of cartridges were tested at each time point in random order. Each set consisted of 4 cartridges, 1 cartridge for each static condition. The same QC solution level was used for each set. Po2 and Pco2 were measured.
Statistical Analysis and Units
We compared glucose results obtained from thermally stressed test strips to results obtained from control (room temperature) strips. Student t test for means was applied to compare the results obtained with thermally stressed test strips relative to controls, which were serialized and compared in the same order. We reported the mean and SD of the glucose differences. Student t test for paired differences was applied to compare the differences in Po2 and Pco2 between thermally stressed cartridges and control cartridges, which were tested in pairs quickly to avoid drift. We report the mean and standard deviation of the paired differences. Results are reported in both SI and conventional units. To convert mg/dL to mmol/L, mmol/L = mg/dL × 0.05551. Blood gas results are reported in millimeters of mercury. To convert mmHg to kPa, kPa = mmHg × 0.133.
RESULTS
Effects of High Temperature on Glucose Test Strip Measurements
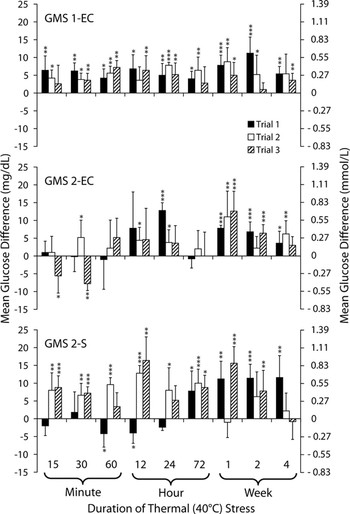
Figure 1 shows the mean glucose differences between heat-stressed and control test strips for durations of stress up to 4 weeks. Heated test strips generated elevated glucose results, which varied and were inconsistent, especially for GMS 2-EC and GMS 2-S. The mean glucose differences were as high as 11.2 mg/dL (SD 4.5 [1–13]) on GMS 1-EC, in trial 1; 12.8 (SD 2.2 [−11 to 22]) on GMS 2-EC, in trial 1; and 16.4 (SD 6.6 [−7 to 22]) on GMS 2-S, in trial 3.
Effects of thermal stress on glucose test strips. Mean differences in glucose results obtained with heat-stressed test strips relative to control for the 3 glucose meter systems (GMSs) are shown. Test strips were stressed at 40°C. Controls were stored and measured at room temperature (21°C). *P< 0.05. **P< 0.01. ***P< 0.001. Reprinted with permission from Knowledge Optimization, Davis, CA

Effects of Freezing and Thawing on Glucose Test Strip Measurements
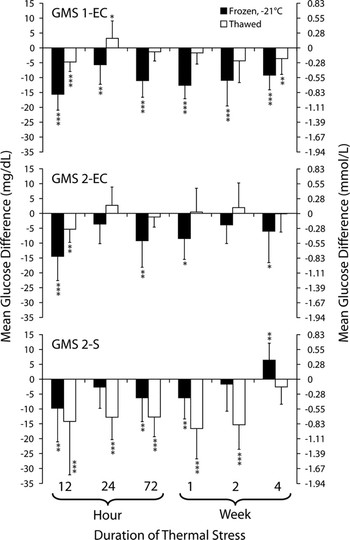
Figure 2 shows mean glucose differences between frozen and control test strips, and between thawed and control strips for durations of stress up to 4 weeks. Glucose results obtained with frozen test strips were significantly lower than control in 6 of 6 time durations for GMS 1-EC, and in 4 of 6 time durations for both GMS 2-EC and GMS 2-S (Figure 2). The mean glucose difference was as low as −15.6 mg/dL (SD 5.3 [−32 to −1]) for GMS 1-EC, −14.5 (SD 8.1 [−32 to 7]) for GMS 2-EC, and −9.8 (SD 11.3 [−41 to 16]) for GMS 2-S. The data presented are the pooling of 3 experimental trials.
Effects of freezing and thawing on glucose meter system (GMS) test strip results. This figure shows mean glucose difference between frozen or thawed test strips relative to control. Test strips were cold stressed at −21°C. Controls were stored and measured at room temperature (21°C). *P< 0.05. **P< 0.01. ***P< 0.001. Reprinted with permission from Knowledge Optimization, Davis, CA

Frozen GMS 1-EC and GMS 2-EC test strips appeared to have partial recovery in performance when thawed to room temperature. The mean glucose measurements between thawed and control strips were not statistically different in 3 of 6 time durations for GMS 1-EC, and in 5 of 6 time durations for GMS 2-EC. The mean glucose difference between thawed and control strips were as low as −1.3 mg/dL (SD 3.1 [−23 to 13]) for GMS 1-EC, −0.13 mg/dL (SD 6.1 [−14 to 16]) for GMS 2-EC, and −15.3 mg/dL (SD 8.3 [−64 to 4]) for GMS 2-S.
The mean glucose measurements were significantly lower on thawed strips than frozen strips at 5 of 6 time durations (P < 0.01) on GMS 2-S. The mean glucose difference between frozen and thawed strips was as much as 13.7 ± 9.0 mg/dL lower with thawed GMS 2-S strips at the 2-week time point.
Effects of Heating and Cooling of Test Cartridges on Blood Gas Measurement
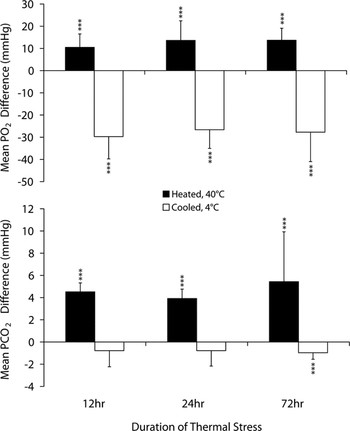
Figure 3 shows the effect of heating and cooling of test cartridges on Po2 and Pco2 measurements. Heated cartridges generated significantly higher Po2 results compared with room temperature (control) cartridges (P < 0.001). The mean of the Po2 differences was as high as 13.7 (SD 5.4 [4–25]) mmHg after 72 hours of stress. Pco2 measurements were significantly higher on heated cartridges compared with control (P < 0.001). The mean difference in Pco2 was as much as 5.4 (SD 4.5 [2.7–5.8]) mmHg.
Effects of heating and cooling of test cartridges on Po2 and Pco2 results obtained with a handheld blood gas analyzer. This figure shows the mean Po2 and Pco2 paired-differences between heated (40°C) or cooled (2°C) test cartridges and control (21°C). * P< 0.05. **P< 0.01. ***P< 0.001. Reprinted with permission from Knowledge Optimization, Davis, CA

Cooled cartridges generated significantly lower Po2 results compared with controls (P < 0.001). The mean difference in Po2 measurement between cooled and room temperature cartridges was as much as −29.7 (SD 10.0 [−14 to −51]) mmHg lower after 12 hours of stress. Frozen cartridges failed to generate results. The data presented are the pooling of 3 experimental trials.
DISCUSSION
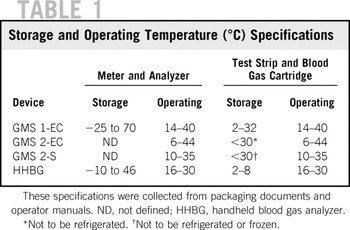
DMATs are deployed to disaster sites with sufficient medical supplies to sustain operations for 72 hours.2 DMATs establish field locations where they triage and diagnose patients. The medical diagnostic equipmentReference Mace, Jones and Bern3 carried should be suitable for response site environmental conditions, which can vary widely, such as low to high temperatures, extremes of humidity, and high altitude, and may exceed equipment storage and operating limits (Table 1). POCT devices and reagents carried by DMATs need to endure these environmental stresses to avoid producing inaccurate test results.
Storage and Operating Temperature (°C) Specifications

Environmental factors, such as temperature, humidity, and altitude, affect glucose meter measurements.Reference Haller, Shuster and Schatz4–Reference Fink, Christensen and Ellsworth7 Haller et alReference Haller, Shuster and Schatz4 found that glucose meters were unreliable at temperatures of 12.2°C to 30.6°C and at humidities of 49% to 100% when subjected to conditions within manufacturer-specified ranges. Bamberg et alReference Bamberg, Schulman and MacKenzie5 found that refrigerated test strips had a longer shelf life, but recommended that manufacturers develop new storage systems so that glucose meters and reagent test strips can be stored together. Bilen et alReference Bilen, Kilicaslan and Akcay6 observed that with increased altitude, glucose meter measurements were falsely increased or decreased based on the type of reagent test strip chemistry, either glucose oxidase or glucose dehydrogenase.
We observed that thermal stresses affect glucose test strip and blood gas cartridge performance adversely. We hypothesize that heating and cooling alters enzyme activity and compromises the structural integrity of test strips and cartridges resulting in the elevated or depressed test results. Devaraja et alReference Devaraja, Sridevi and Singh8 reported that heating can inactivate glucose oxidase and disrupt enzyme activity. Multilayer test strips can separate from differential thermal expansion rates of materials in different layers.
Accurate glucose monitoring is critical for appropriate glycemic management.Reference Kost, Tran and Abad9 Accurate blood gas results enable rapid assessment of respiratory function, facilitate initiation of appropriate supportive care (eg, oxygen therapy, ventilator support), and indicate the effectiveness of the emergency treatments. POCT blood gas measurements provide critical information for on-site decision making in the care of disaster victims, such as during Hurricane Katrina.Reference Kost, Tran and Tuntideelert1 Hence, blood gas measurements must be accurate.
In addition to environmental factors, endogenous factors (eg, elevated blood oxygen tension and hematocrit levels) and exogenous factors (eg, medications in the blood) can interfere with glucose meter measurements.Reference Kost, Vu and Lee10–Reference Tang, Louie and Lee15 Falsely elevated glucose results could lead to unnecessary administration of insulin, or alternately, to inaction when in fact the patient is hypoglycemic. Discrepancies in glucose meter measurements and their potential effects on therapeutic decisions are discussed by Kost et al.Reference Kost, Tran and Abad9 Discrepancies also may influence field performance.
POCT provides fast on-site testing that facilitates evidence-based decisions, and when fully implemented and deployed can support local health system infrastructure, as occurred in Hurricane Katrina.Reference Kost, Tran and Tuntideelert1 KostReference Kost16 reported how POCT has not been developed adequately, explored fully, or deployed proactively to meet the challenges of acute rescue, public health, or “newdemics,” defined as unexpected and disruptive problems that affect the health of large numbers of individuals in a crowded world.
Our study showed that commercially available test strips for glucose meters and cartridges for a handheld blood gas analyzer, both used by hospitals and emergency responders, are affected by thermal stresses. To ensure that POCT devices provide accurate measurements wherever they may be used, we recommend that devices and reagents need to be laboratory and field tested in extreme environmental conditions experienced by emergency responders to independently verify durability and functionality; product literature should provide performance limits for operation or storage in extreme conditions, such as high and low temperature and humidity; technology designers should be cautious in selecting materials used for fabrication (eg, thermal expansion properties of reagent substrates, adhesives, and moisture barriers may not be compatible when stressed); and quality assurance protocols for disaster response POCT need to be optimized for extreme temperature, humidity, altitude, vibration, shock, and environments encountered (eg, marine, flooding).
CONCLUSIONS
The performance of glucose meter test strips and blood gas analyzer cartridges was affected adversely, and sometimes inconsistently, by thermal stresses. Heating generated falsely elevated results, and cooling yielded falsely depressed results.
After freezing, thawed electrochemical, but not spectrophotometric, glucose test strips often recovered. More detailed experiments will be needed to determine the extent to which blood gas cartridges recover from freezing, if at all.
DMATs and emergency medical responders should be aware of the potential risks of inaccurate results from POCT when operated in adverse conditions. Manufacturers must produce POCT devices and reagents suitable for field use under these conditions. New POCT technologies should be designed for environmental challenges encountered at disaster and emergency response sites.
Acknowledgments
The authors thank Nicole Gentile, Lam Vo, Ryan Asistin, Joseph Matolo, Darrell Griswold, and the UC Davis Children’s Hospital Critical Care Transport Team. Shaunyé Belcher and Ron Mathew were Hugh Edmondson Research Fellows.
The project was supported by award U54EB007959 (G.J.K., principal investigator) from NIBIB, a Pathology and Laboratory Medicine grant, and the Point-of-Care Testing Center for Teaching and Research.
Authors' Disclosures The authors report no conflicts of interest.