Stroke, a serious cerebrovascular condition, ranks among the foremost causes of mortality and disability globally. Therefore, it imposes a heavy and long-term burden on global public health, a burden with substantial potential for intervention(Reference Choi, Sagris and Hill1). In recent decades, stroke incidence has risen markedly, particularly in low- and middle-income countries, thereby intensifying healthcare burdens in these settings(Reference Prust, Forman and Ovbiagele2). Among the multiple contributing factors to the pathogenesis of stroke, nutritional status has increasingly been recognised as a critical and modifiable risk factor. Malnutrition is notably prevalent among patients with stroke, especially in older populations(Reference Di Vincenzo, Luisi and Alicante3,Reference Sabbouh and Torbey4) . The nutritional risk index (NRI), which integrates body mass and serum albumin concentration, was originally developed to assess nutritional risk in hospitalised and elderly individuals. Recent studies have highlighted its significant role in predicting disease onset and outcomes(Reference Buzby5,Reference Cereda and Pedrolli6) . Malnutrition exerts multifaceted effects in the pathophysiology of CVD through metabolic and inflammatory pathways, significantly influencing disease progression(Reference Yao, Lindholm and Stenvinkel7). Nevertheless, despite growing interest in nutritional assessment, existing studies have predominantly focused on individual nutritional components – such as specific vitamins or micronutrients – rather than systematic assessments of overall nutritional status, particularly in general populations(Reference Chen, Lu and Pang8,Reference Grüngreiff, Gottstein and Reinhold9) . Whether NRI is associated with stroke occurrence, and whether such an association is mediated by lipid and inflammatory markers, remains unclear. To address these gaps, the present study was designed to examine the association between NRI and stroke prevalence using nationally representative data from the National Health and Nutrition Examination Survey (NHANES; 2011–2020) and to further investigate the potential mediating roles of lipid and inflammatory biomarkers in this association. This work seeks to advance understanding of stroke aetiology and related risk factors, to generate hypotheses for future longitudinal research and to provide evidence to guide public health practice and policy-making.
Methods
Study participants and design
NHANES is a continuous cross-sectional survey. It uses a complex, stratified, multistage probability sampling design to obtain nationally representative samples of the non-institutionalised USA population in each survey cycle(Reference Lai, Zhou and Li10). Data collection consists of in-home interviews followed by standardised physical examinations and biospecimen collection in mobile examination centres. Anthropometric measurements and blood pressure were obtained by trained personnel following NHANES standardised protocols, and laboratory biomarkers were measured using NHANES laboratory methods. Detailed information on survey design, sampling, examination and laboratory procedures is available in the NHANES protocols and analytic guidelines(11). The National Center for Health Statistics Ethics Review Board reviewed and approved all NHANES protocols, and written informed consent was obtained from each participant.
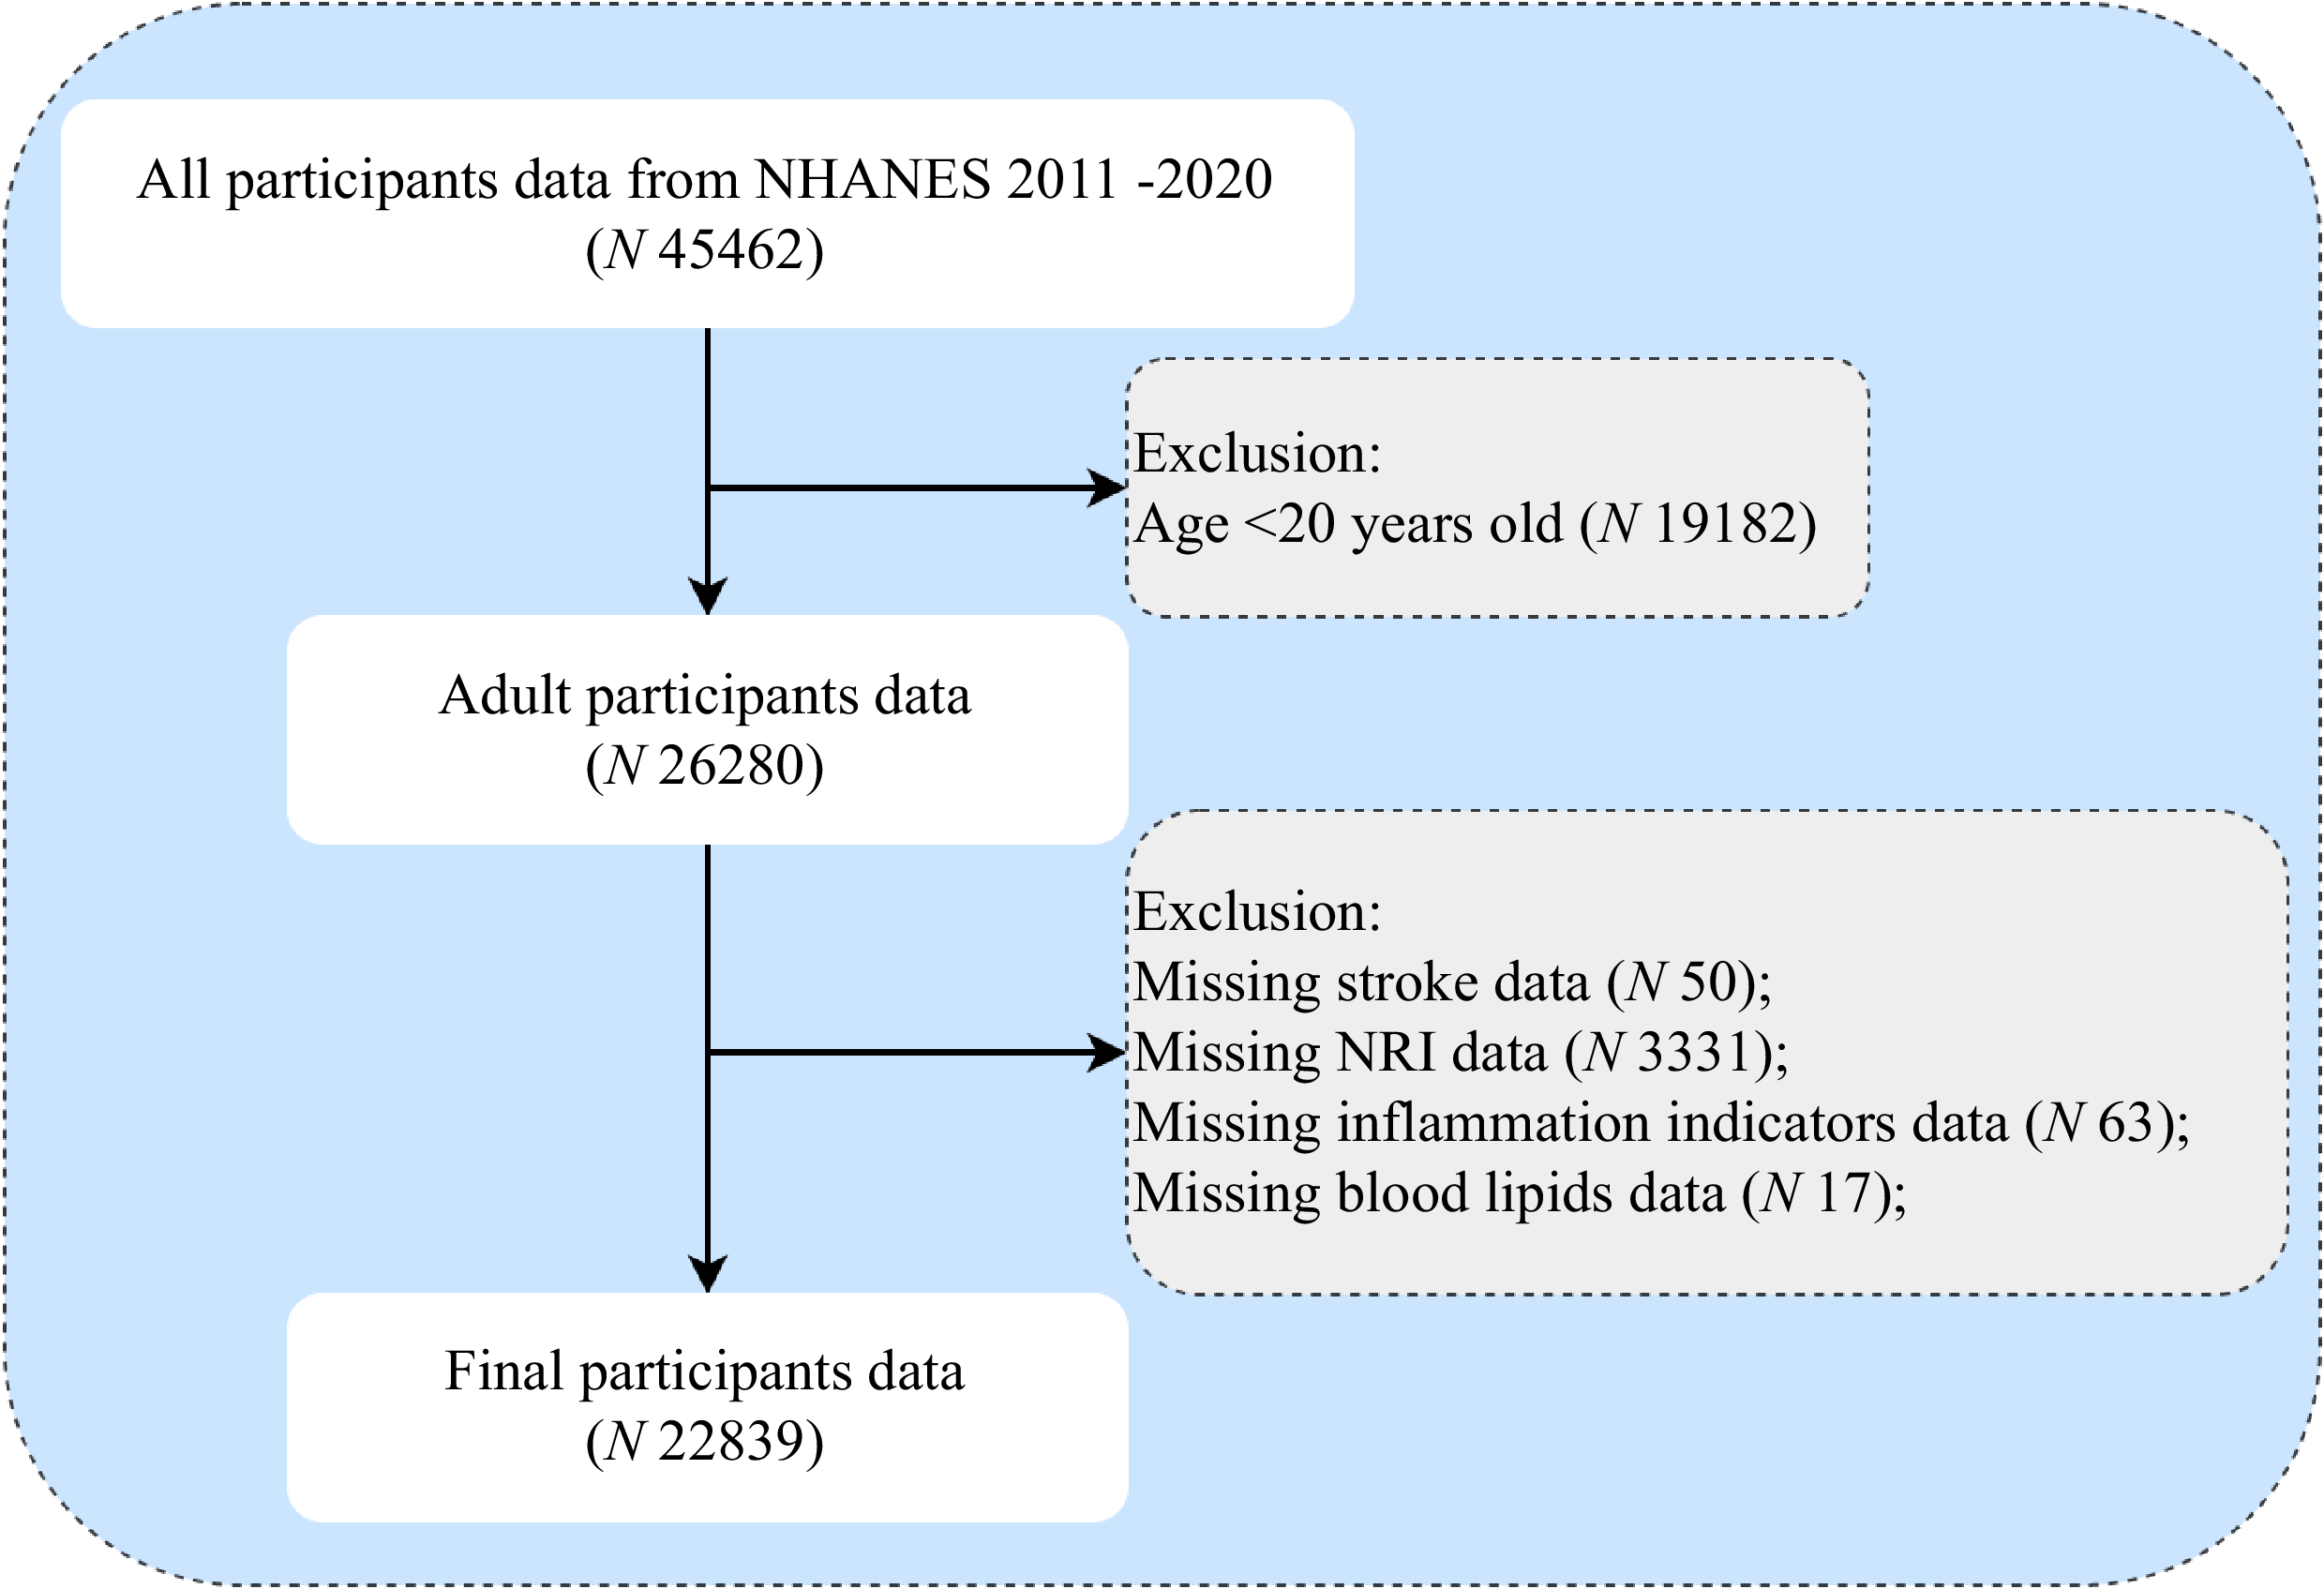
Data from four NHANES cycles (2011–2020) were included in the analysis. The pre-pandemic sample was derived by pooling the 2017–2018 cycle and the partial 2019–2020 cycle (March 2019–March 2020). Participants were assigned specific weights based on sampling probability and non-response rates to ensure representativeness, thereby enhancing the validity of survey results and the reliability of the data. Among 45 462 participants initially screened, 22 839 remained in the final analytic sample after excluding individuals who met any of the criteria listed below: (1) Age < 20 years (n 19 182); (2) missing NRI data (n 3331); (3) missing stroke status (n 50); (4) missing inflammatory markers (n 63) and (5) missing lipid profiles (n 17) (Figure 1).
Research flow chart.

Nutritional risk index assessment
NRI was computed using the equation: NRI = (1·519 × serum albumin [g/dl]) + (41·7 × actual body weight [kg]/ideal body weight [IBW; kg])(Reference Bouillanne, Morineau and Dupont12). IBW was determined using the Lorentz formula: for males, IBW = height (cm) − 100 − ((height (cm) − 150)/4); for females, IBW = height (cm) − 100 − ((height (cm) − 150)/2·5). Lower values of the NRI are indicative of a higher risk of malnutrition.
Definition of stroke
Stroke status was ascertained from the Medical Conditions Questionnaire using self-reported physician diagnosis. Participants responded to the item, ‘Has a doctor or other health professional ever told you that you had a stroke?’ Responses of ‘Yes’ were coded as a history of stroke, whereas ‘No’ indicated no history.
Mediator variables
Inflammatory markers assessed in this study, including the systemic immune-inflammation index (SII), product of platelet and neutrophil count (PPN), platelet:lymphocyte ratio (PLR), neutrophil:lymphocyte ratio (NLR) and lymphocyte:monocyte ratio (LMR), were derived according to the NHANES protocol. Blood specimens were collected by certified phlebotomists and processed in accredited laboratories following standardised procedures. The inflammatory markers were derived from the following formulas: SII = platelet count × neutrophil count/lymphocyte count; PPN = platelet count × neutrophil count; PLR = platelet count/lymphocyte count; NLR = neutrophil count/lymphocyte count and LMR = lymphocyte count/monocyte count. Lipid parameters were evaluated by measuring the levels of TG and total cholesterol (TC). All indicators were obtained through standardised sampling and testing procedures to ensure data accuracy and reliability.
Covariates
Based on previous publications and biological considerations, covariates known to or suspected to confound the association with stroke were selected a priori(Reference Mao, Weng and Xie13,Reference Jiang, Shen and Chen14) . These covariates included age, sex (male/female), marital status (married; unmarried and other), race (White; Black; Mexican and other), education level (≤ high school; > high school), BMI, physical activity, smoking, drinking and the presence of diabetes (yes/no) and hypertension (yes/no). Physical activity was categorised as inactive (< 600 MET-min/week) or active (≥ 600 MET-min/week)(Reference Xu, Earp and Adami15). Smoking was categorised as current smokers (≥ 100 cigarettes over the lifetime and smoking at present), former smokers (≥ 100 lifetime cigarettes but not smoking at present) and never smokers (< 100 lifetime cigarettes). Drinking was categorised as non-drinkers, light-to-moderate drinkers (< 1 drink/d for women and < 2 drinks/d for men) and heavy drinkers (≥ 1 drink/d for women and ≥ 2 drinks/d for men); a standard drink corresponded to 14 g of pure ethanol(Reference Guenther, Ding and Rimm16). Hypertension was considered present if any of the following applied: a self-reported history of hypertension, current antihypertensive medication use, systolic blood pressure ≥ 140 mmHg or diastolic blood pressure ≥ 90 mmHg(Reference Liu, Fan and Liu17). Diabetes was classified as present when either condition was met: ongoing antidiabetic medication therapy or a self-reported physician diagnosis of diabetes(Reference Li, Zhang and Yang18).
Statistical analysis
All statistical analyses were conducted in accordance with the complex, multistage sampling design of the NHANES, incorporating appropriate survey weights, stratification and clustering to ensure national representativeness. SII, PPN, PLR, NLR, LMR, TG and TC were skewed; therefore, their values were natural log-transformed (ln) prior to analysis. Continuous variables were summarised as mean (sd) or as median (IQR), as appropriate; categorical variables were summarised as counts and percentages. Group differences in continuous variables were assessed with an independent-samples t test or the Mann–Whitney U test, while categorical variables were evaluated using the χ 2 test. To investigate the association between NRI and stroke prevalence, three logistic regression models were constructed: Model 1: unadjusted; model 2: adjusted for age, race, education level, marital status and BMI and model 3: further adjusted for potential confounders including BMI, physical activity, smoking, drinking, diabetes and hypertension. NRI, divided into quartiles, was analysed both as a continuous variable and as a categorical variable. For trend assessment, NRI quartiles were treated as a continuous variable in the logistic regression models. Additionally, restricted cubic splines were fitted within model 3 to examine potential non-linear associations between NRI and stroke prevalence. Sex, age, marital status, education level, race, BMI, physical activity, smoking, drinking, hypertension and diabetes were included as covariates for subgroup and interaction analyses(Reference Mao, Weng and Xie13,Reference Jiang, Shen and Chen14) . Furthermore, an exploratory mediation analysis was conducted to examine whether two lipid indices (ln-TC and ln-TG) and five inflammatory indices (ln-SII, ln-PPN, ln-PLR, ln-NLR and ln-LMR) could account for part of the observed association between NRI and stroke prevalence.
Statistical analyses were conducted in R (version 4.3.1), with statistical significance set at a two-sided P value < 0·05.
Results
Baseline characteristics of participants
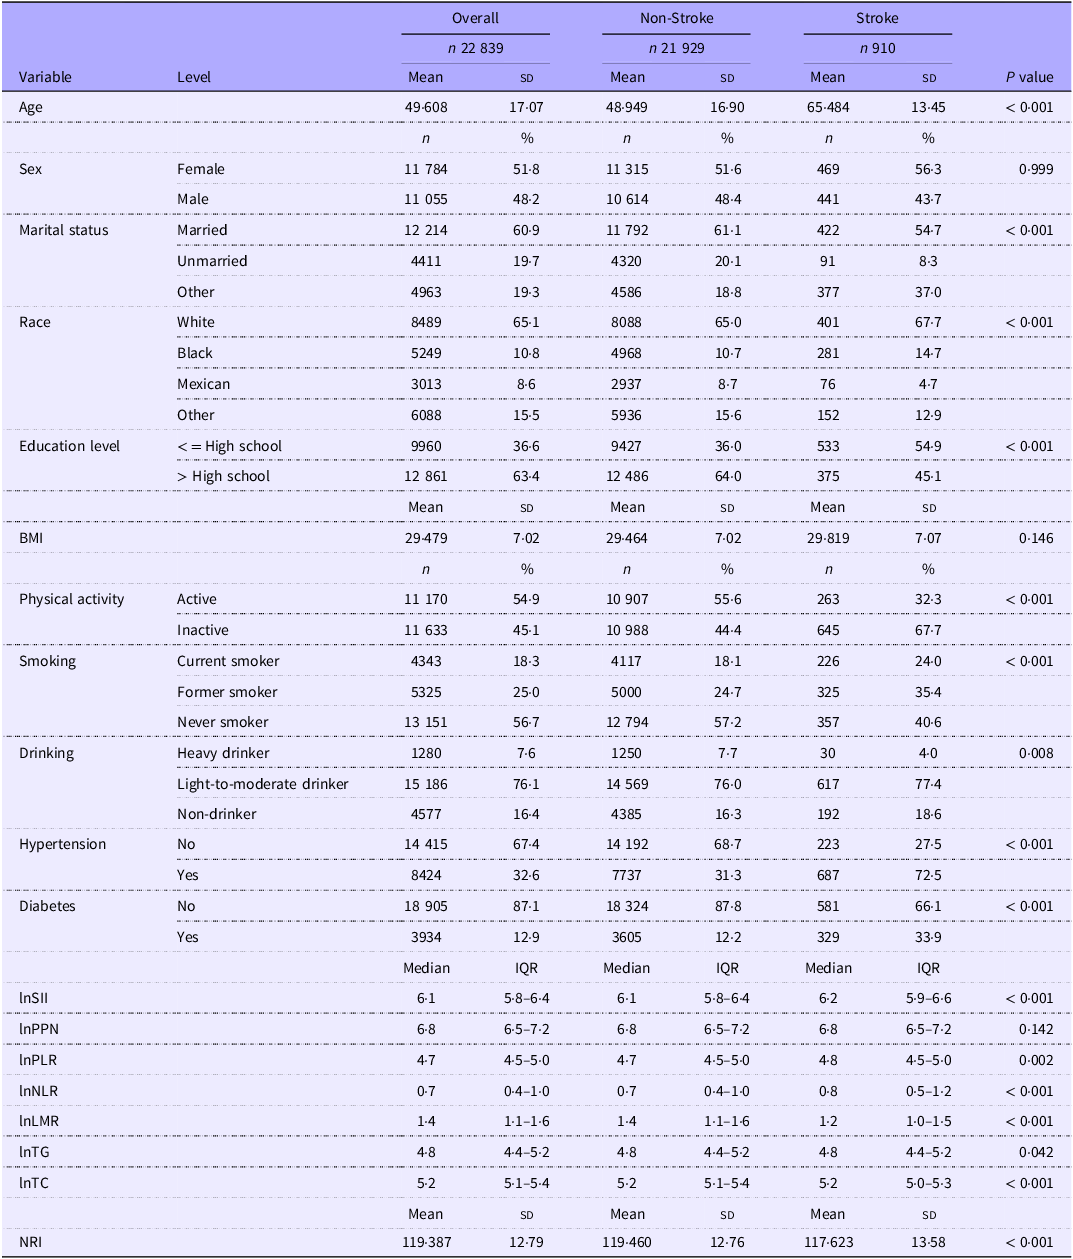
In total, 22 839 individuals were included (11 055 men (48·2 %) and 11 784 women (51·8 %); mean age, 49·61 (sd 17·07) years). Table 1 summarises baseline characteristics by stroke status (non-stroke, n 21 929; stroke, n 910). Compared with the non-stroke group, participants with stroke were generally older, had lower education levels and more often showed physically inactive and current or former smokers, with a greater prevalence hypertension and diabetes. Regarding biomarkers, the stroke group showed higher SII, PLR and NLR than the non-stroke group.
Participant-Weighted baseline characteristics

Table 1 Long description
Note: BMI: body mass index; SII: systemic immune inflammation index; PPN: product of platelet and neutrophil count; PLR: platelet-lymphocyte ratio; NLR: neutrophil-to-lymphocyte ratio; LMR: lymphocyte-to-monocyte ratio; TC: total cholesterol; TG: triglycerides. NRI: Nutritional Risk Index.
SII, systemic immune inflammation index; PPN, product of platelet and neutrophil count; PLR, platelet:lymphocyte ratio; NLR, neutrophil:lymphocyte ratio; LMR, lymphocyte:monocyte ratio; TC, total cholesterol; NRI, nutritional risk index.
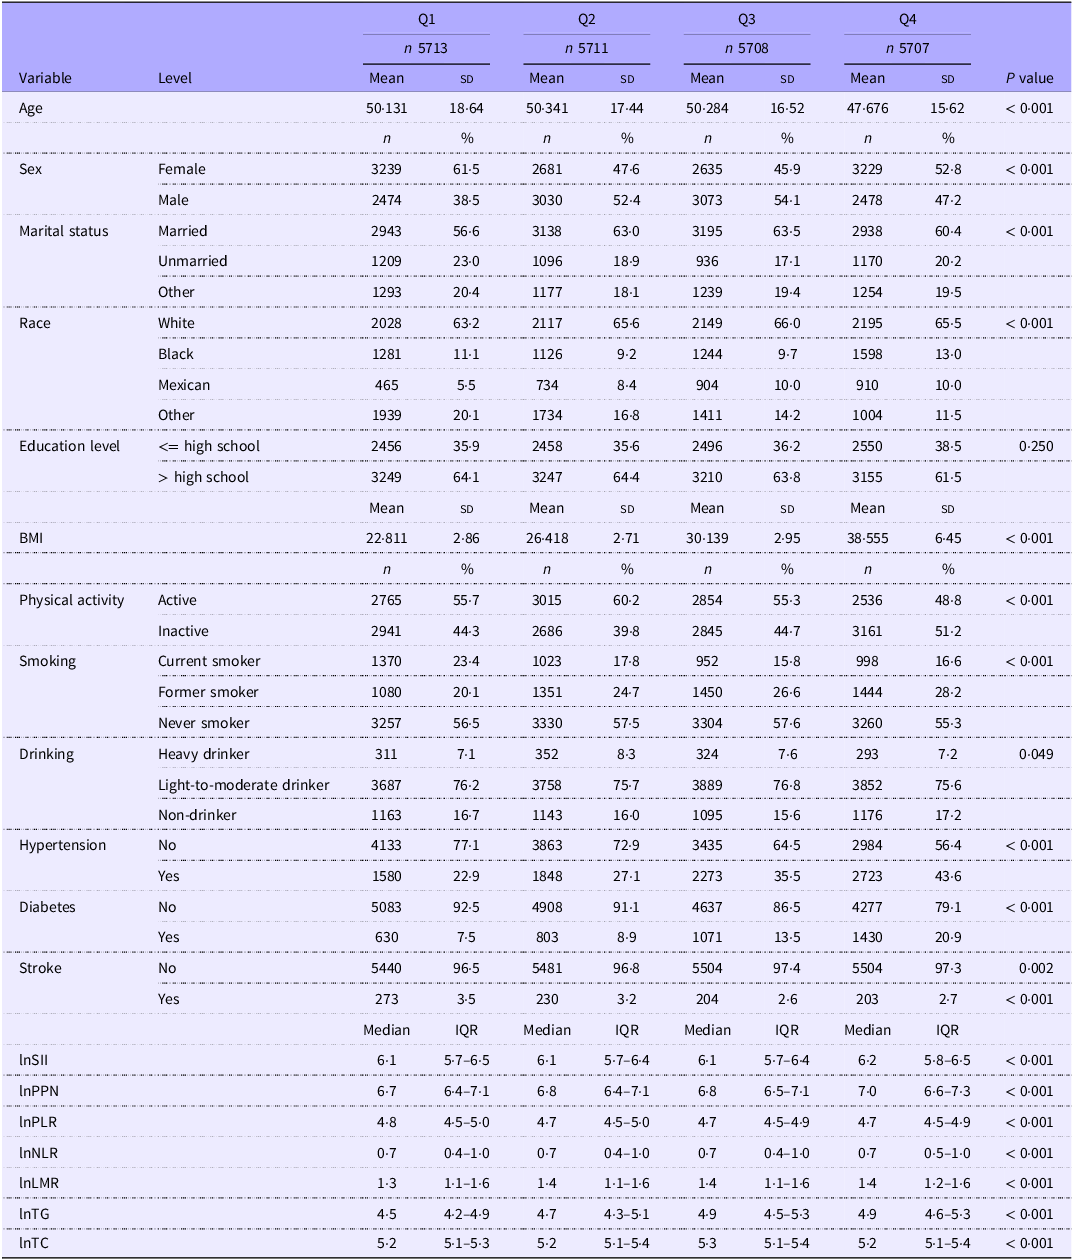
Table 2 summarises participant characteristics across NRI quartiles. Participants in Q4, relative to those in NRI-Q1, were generally younger, had a lower proportion of women and were modestly more often married and had greater shares of White, Black and Mexican participants. Additionally, individuals in NRI-Q4 also had higher BMI, were more likely to be physically inactive, had a larger share of former smokers and showed increased hypertension and diabetes prevalence, with a slightly lower prevalence of stroke. Regarding laboratory indices, participants in NRI-Q4 showed higher SII, PPN, LMR and TG level.
Characteristics of participants according to NRI quartiles

Table 2 Long description
Note: BMI: body mass index; SII: systemic immune inflammation index; PPN: product of platelet and neutrophil count; PLR: platelet-to-lymphocyte ratio; NLR: neutrophil-to-lymphocyte ratio; LMR: lymphocyte-to-monocyte ratio; TC: total cholesterol; TG: triglycerides; NRI: Nutritional Risk Index; Q: Quartile.
SII, systemic immune inflammation index; PPN, product of platelet and neutrophil count; PLR, platelet:lymphocyte ratio; NLR, neutrophil:lymphocyte ratio; LMR, lymphocyte:monocyte ratio; TC, total cholesterol; NRI, nutritional risk index; Q, quartile.
Association between nutritional risk index and stroke
Three survey-weighted multivariable logistic regression models were constructed to explore the correlation between NRI and stroke, revealing a significant negative association (Figure 2). In model 3, the association remained statistically significant, with each 1-unit increase in NRI associated with approximately 4 % lower odds of prevalent stroke (OR = 0·96, 95 % CI: 0·95, 0·97; P < 0·001). Furthermore, after converting NRI from a continuous variable into quartile-based categories, participants falling within the third (Q3) and highest (Q4) quartiles showed markedly reduced likelihood of stroke relative to those in the lowest quartile (Q1) in model 3, with corresponding adjusted OR of 0·68 (95 % CI: 0·53, 0·86) and 0·60 (95 % CI: 0·42, 0·85), respectively.
Association between NRI and stroke. Model 1: unadjusted. Model 2: adjusted for sex, age, marital status, education level, race and BMI. Model 3: based on model 2, further adjusted for physical activity, smoking, drinking, hypertension and diabetes. NRI: Nutritional Risk Index.

Figure 2 Long description
Abbreviations: OR: odds ratio; CI: confidence interval. NRI: Nutritional Risk Index. Model 1: unadjusted. Model 2: adjusted for sex, age, marital status, education level, race, BMI. Model 3: based on Model 2, further adjusted for physical activity, smoking, drinking, hypertension, and diabetes.
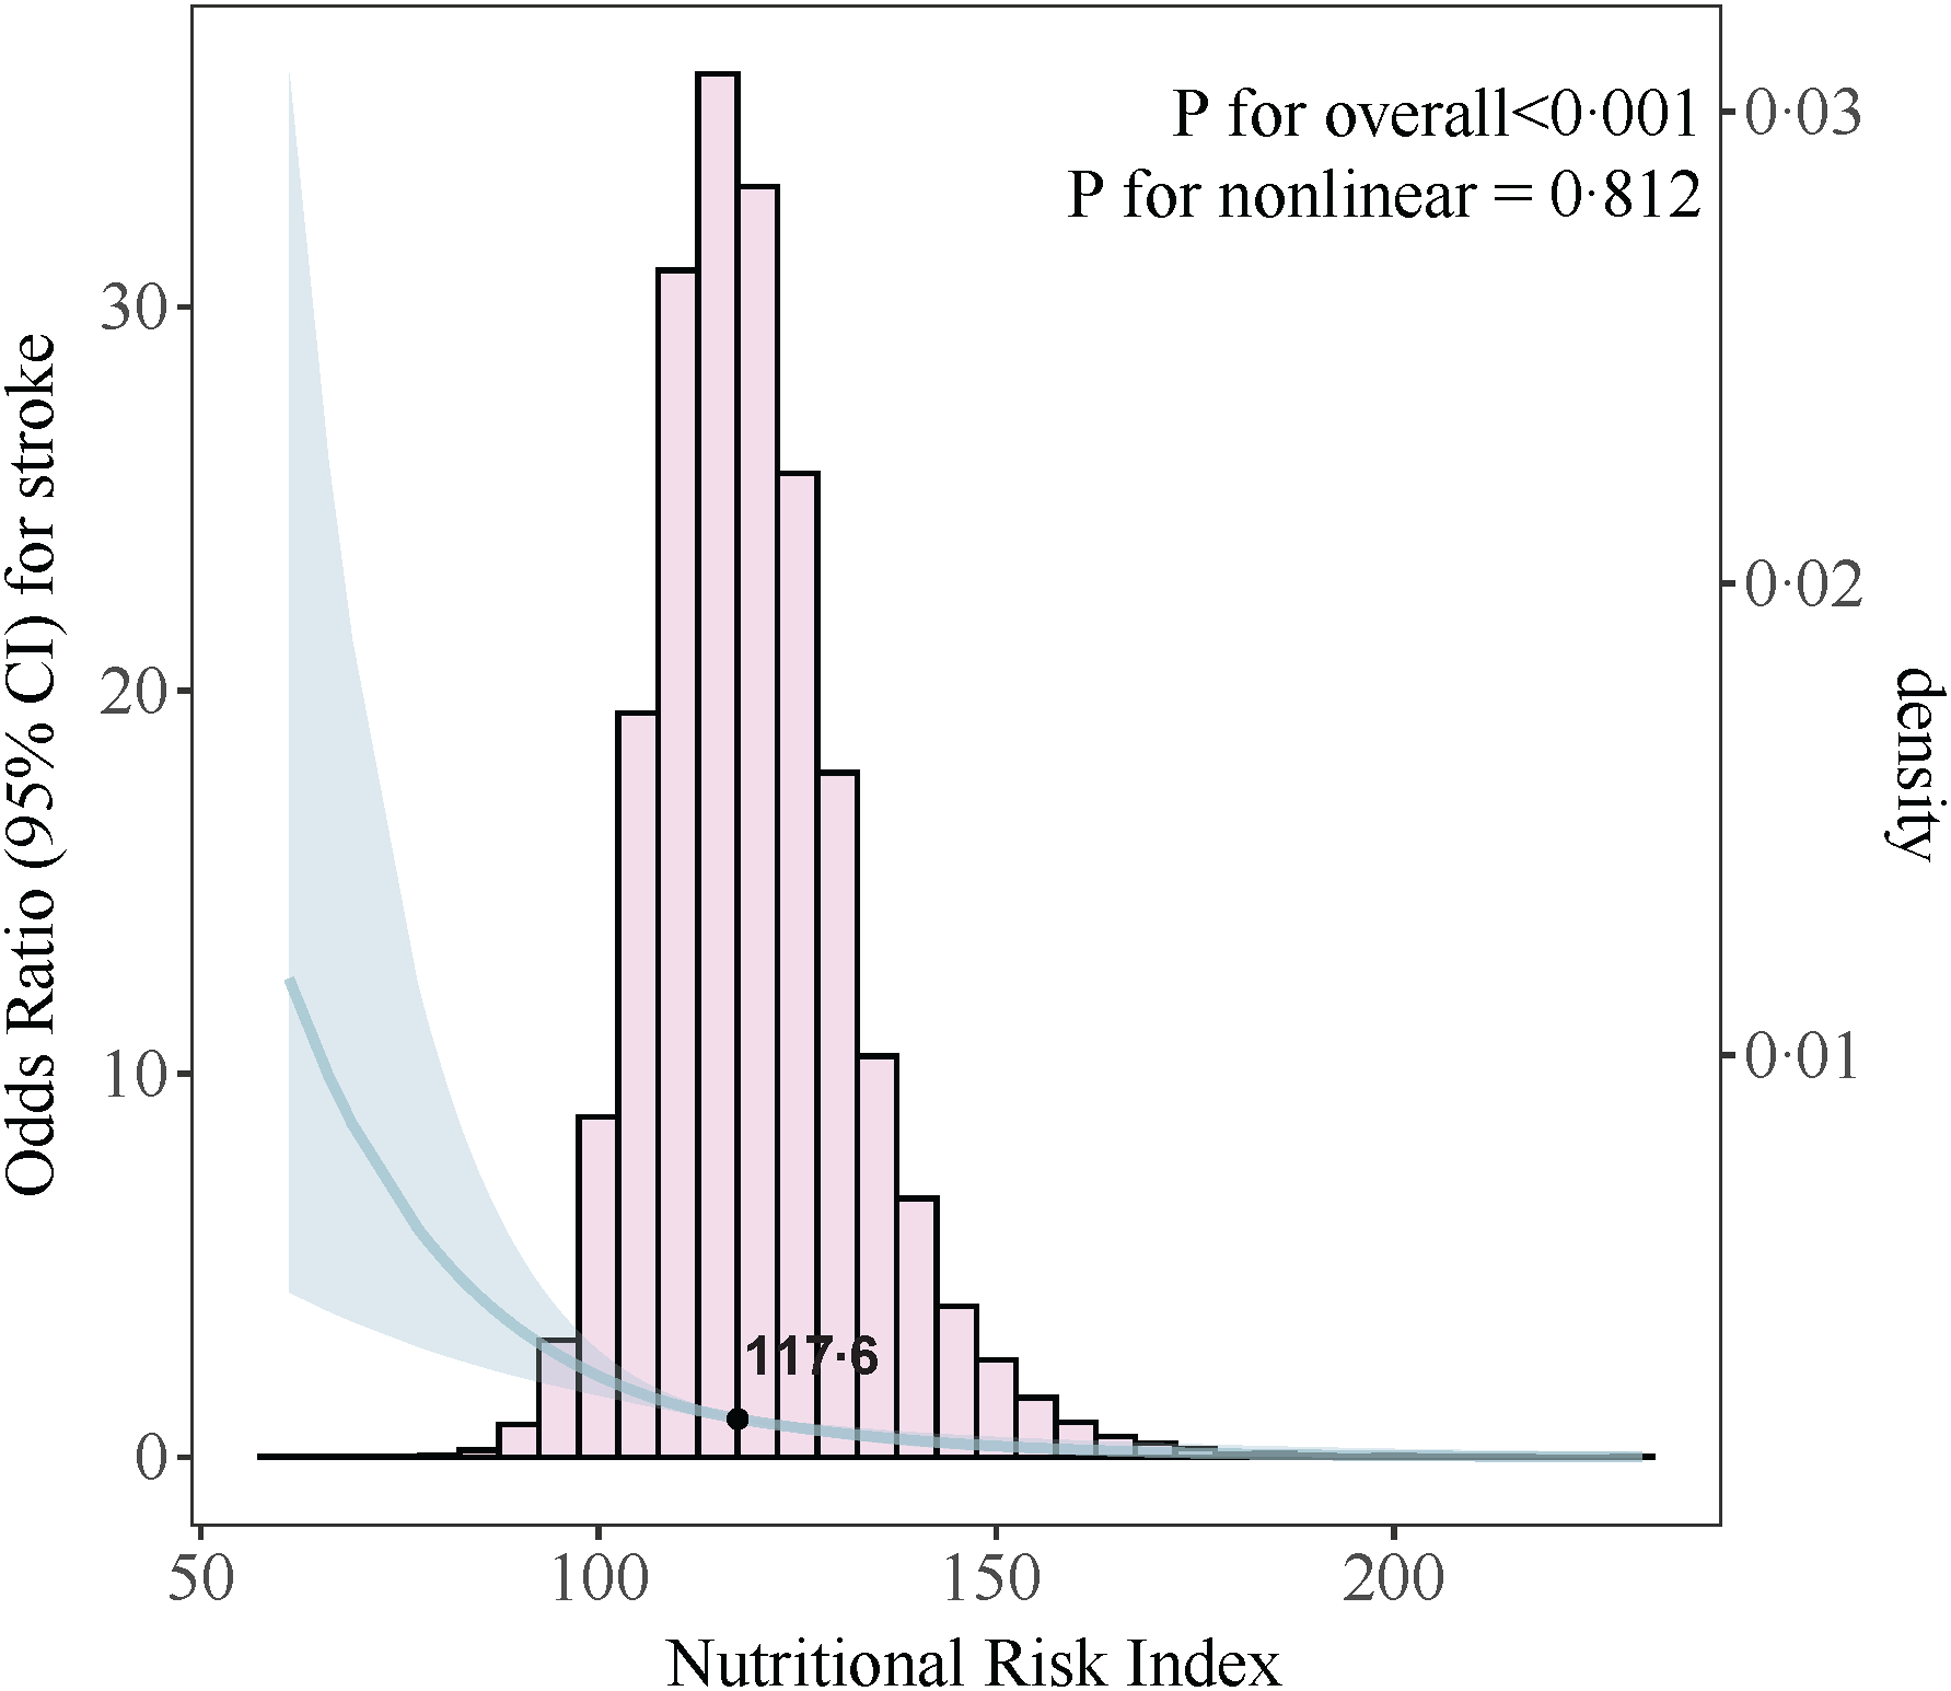
Across all three models, the NRI–stroke association showed a significant linear trend (P for trend < 0·05). Consistently, the model 3 restricted cubic spline curve supported an approximately linear relationship between NRI and stroke risk, with no evidence of nonlinearity (P for nonlinearity = 0·812; Figure 3).
Dose–response relationship between NRI and stroke. Adjusted variables: sex, age, marital status, education level, race, BMI, physical activity, smoking, drinking, hypertension and diabetes. Reference: NRI = 117·6 (OR = 1).

Figure 3 Long description
Note: Adjusted variables: sex, age, marital status, education level, race, BMI, physical activity, smoking, drinking, hypertension, and diabetes. Reference: NRI = 117.6 (OR = 1).
Subgroup analysis
Subgroup results are shown in Figure 4. The negative relationship between NRI and stroke risk was more pronounced in certain populations, particularly among former smokers, light-to-moderate drinkers, individuals with hypertension and those without diabetes. In these subgroups, participants in Q4 exhibited a significantly lower incidence of stroke, indicating a clear dose–response pattern. In addition, interaction analysis revealed no statistically significant results.
Subgroup analysis between NRI and stroke. Adjusted variables: sex, age, marital status, education level, race, BMI, physical activity, smoking, drinking, hypertension and diabetes. Stratification variables themselves were not included in the model when stratified. NRI, nutritional risk index.

Figure 4 Long description
Abbreviations: OR: odds ratio; CI: confidence interval. NRI: Nutritional Risk Index. Adjusted variables: sex, age, marital status, education level, race, BMI, physical activity, smoking, drinking, hypertension, and diabetes. Stratification variables themselves were not included in the model when stratified.
Mediation analysis
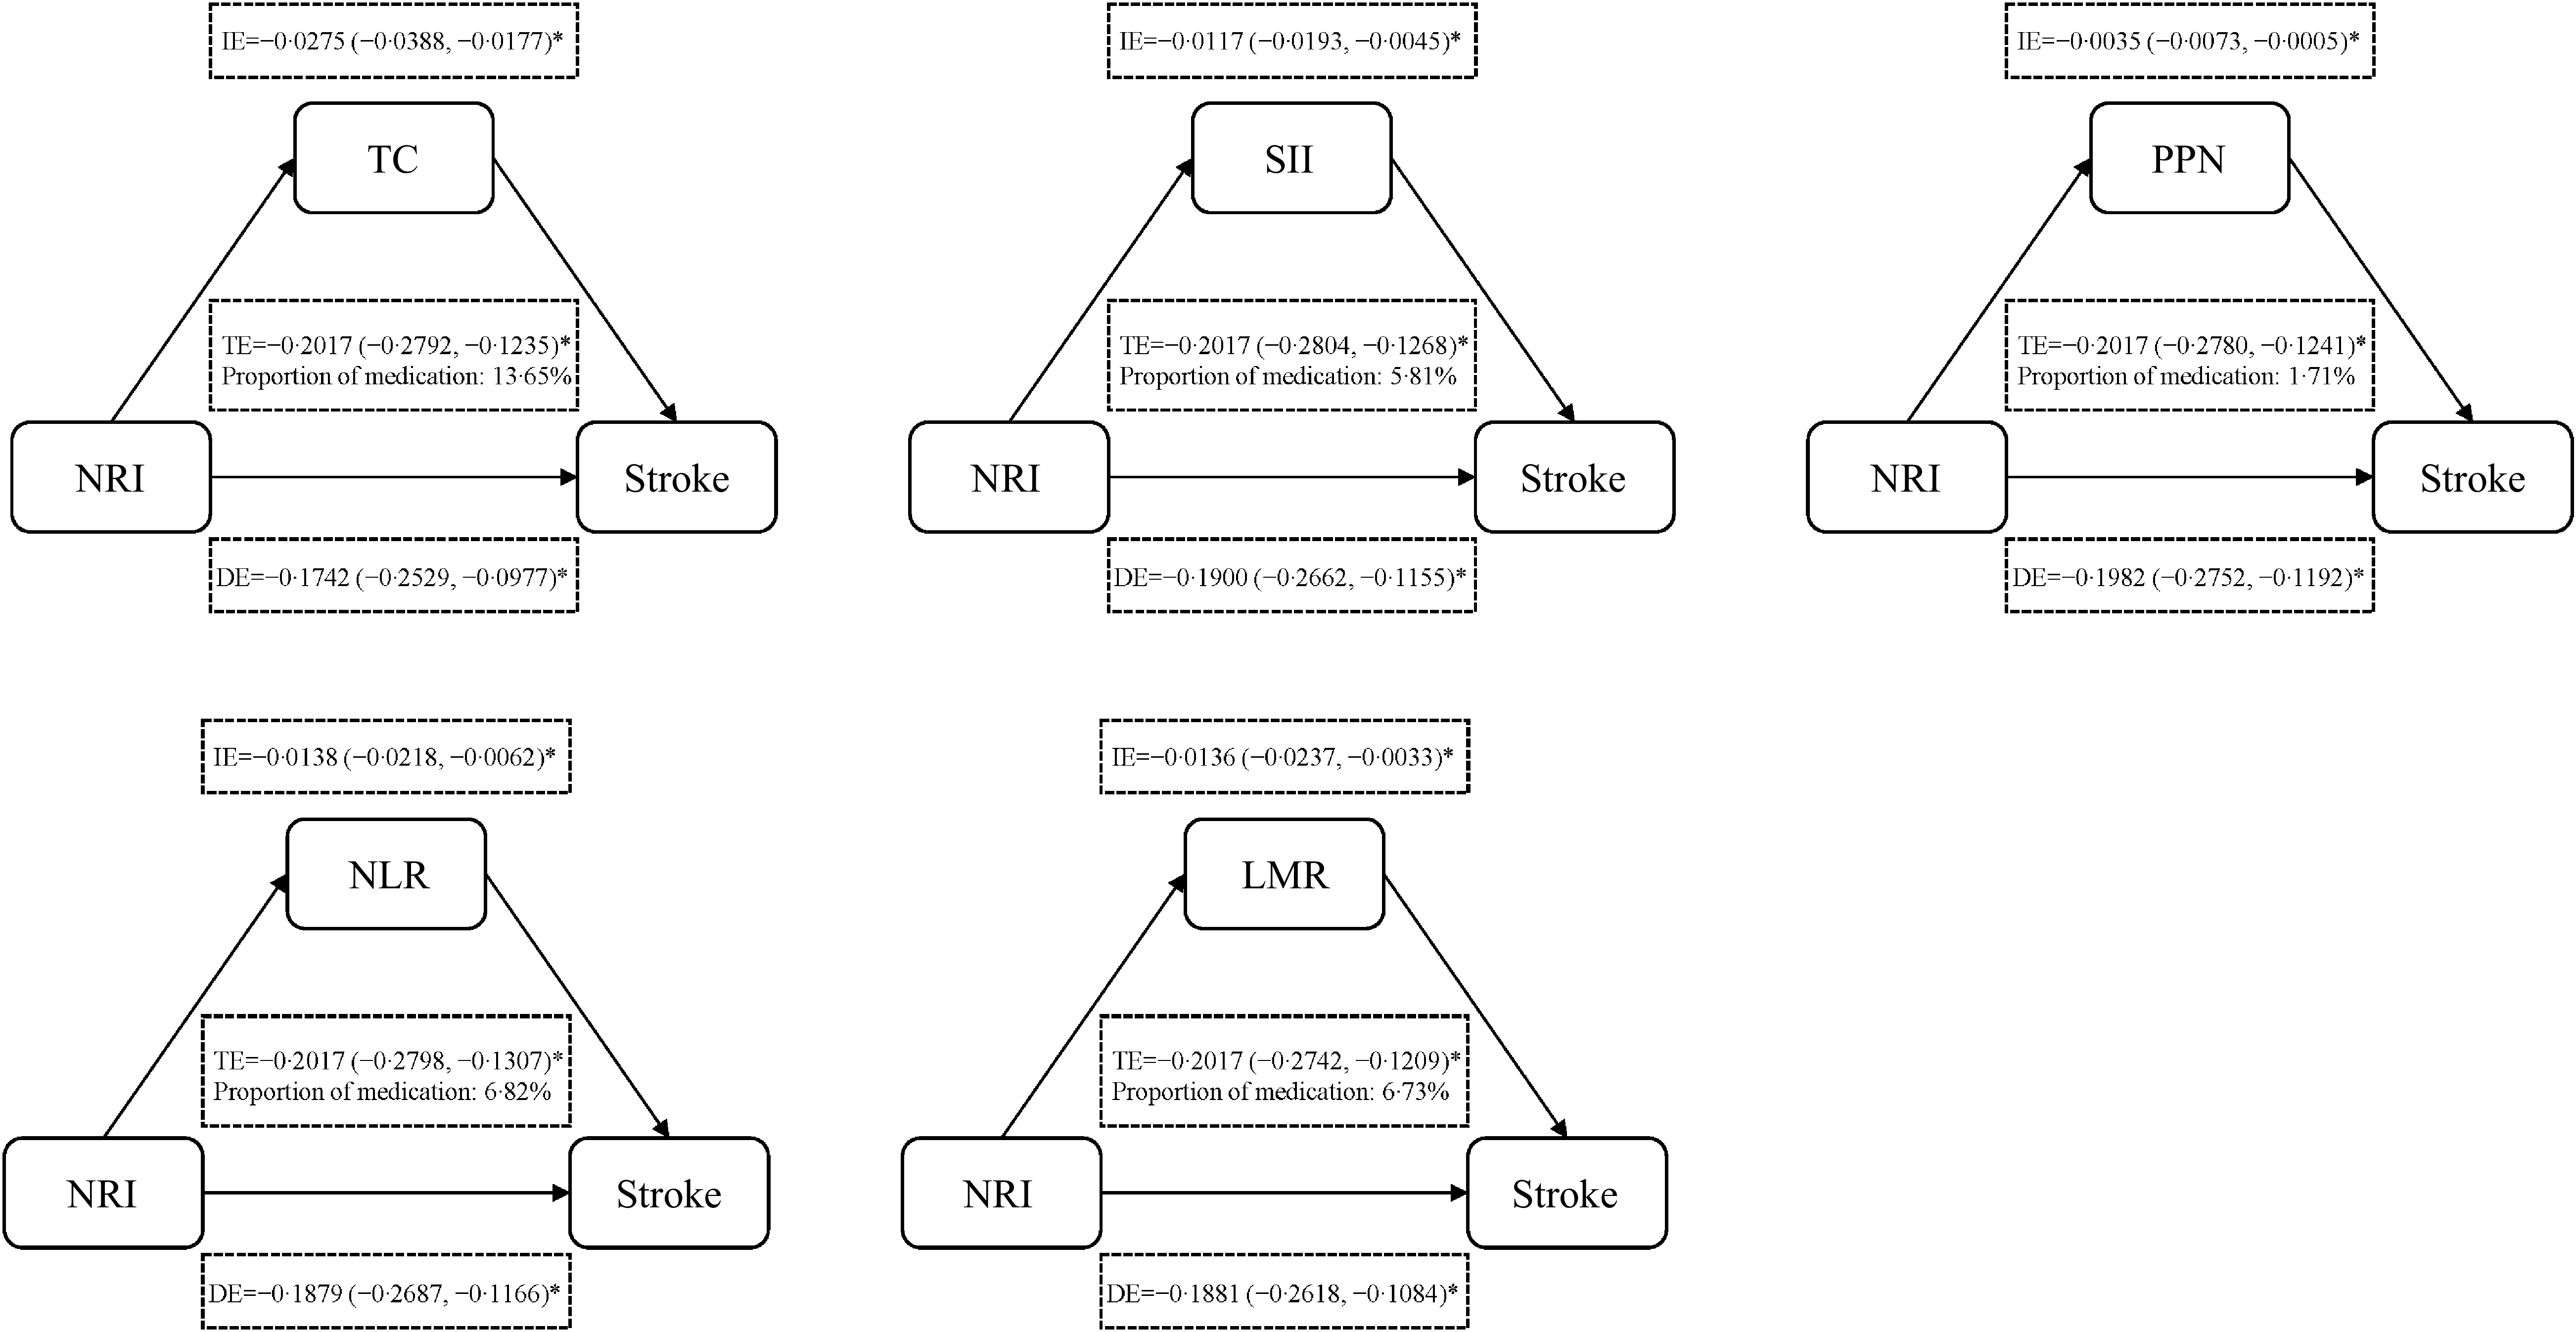
Online Supplementary Table 1 presents the associations of lipid and inflammatory markers with NRI, as well as their associations with stroke. The results indicated that only TC, SII, PPN, NLR and LMR met the criteria for mediation analysis and acted as mediators in the relationship between NRI and stroke. The proportions of the total effect mediated by TC, SII, PPN, NLR and LMR were 13·65 %, 5·81 %, 1·71 %, 6·82 % and 6·73 %, respectively (Figure 5). These results indicate that alterations in lipid profiles, and inflammatory responses may statistically account for a proportion of the observed NRI–stroke association.
The mediating role of lipid/inflammation markers between NRI and stroke. Adjusted variables: sex, age, marital status, education level, race, BMI, physical activity, smoking, drinking, hypertension and diabetes. SII, systemic immune inflammation index; PPN, product of platelet and neutrophil count; NLR, neutrophil:lymphocyte ratio; LMR, lymphocyte:monocyte ratio; TC: total cholesterol; NRI, nutritional risk index.

Figure 5 Long description
Adjusted variables: sex, age, marital status, education level, race, BMI, physical activity, smoking, drinking, hypertension, and diabetes. Abbreviations: SII: systemic immune inflammation index; PPN: product of platelet and neutrophil count; PLR: platelet-to-lymphocyte ratio; PLR: platelet-to-lymphocyte ratio; NLR: neutrophil-to-lymphocyte ratio; LMR: lymphocyte-to-monocyte ratio; TC: total cholesterol; TG: triglycerides; NRI: Nutritional Risk Index.
Discussion
In this study, 22 839 participants from NHANES were analysed. Participants with stroke had a substantially lower mean NRI than those without stroke. Following adjustments for potential confounding factors, a significant negative correlation between NRI and stroke occurrence was observed, suggesting that individuals with higher NRI levels may be less susceptible to stroke. Across strata defined by age, smoking, drinking, hypertension and diabetes, subgroup analyses provided additional evidence that this negative association was consistent and stable. These robust findings support the reliability of NRI as a potential predictor of stroke risk. Mediation analysis indicated that TC, SII, PPN, NLR and LMR functioned as mediators in the association between NRI and stroke, providing insights into possible underlying mechanisms.
Stroke is a severe condition characterised by high morbidity and mortality, and it can markedly compromise long-term patients’ health and overall well-being(Reference Wolfe19). Existing evidence suggests that malnutrition is commonly observed among individuals with stroke, underlining the critical role of timely nutrition-related screening and intervention for enhancing patient recovery and overall health outcomes(Reference Sabbouh and Torbey4). Nutritional status and immune function are intricately linked, as malnutrition often leads to impaired immune responses, increasing susceptibility to infections and adversely affecting recovery and long-term prognosis(Reference Keusch20). In the context of stroke and related conditions, serum albumin has been recognised as an important biomarker(Reference Babu, Kaul and Dadheech21,Reference Zhou, Wang and Meng22) . The NRI, an integrated index derived from serum albumin concentration and body mass, is commonly applied in the evaluation of an individual’s nutritional status(Reference Cereda and Pedrolli23). Albumin functions as a downregulated acute-phase reactant, and its concentration tends to decline markedly during inflammatory responses or under conditions of poor nutritional status(Reference Keller24). A high NRI generally indicates better nutritional status, while a low NRI suggests a potential risk of malnutrition. Taken together, higher NRI levels were linked to a lower risk of stroke, implying that better nutritional status may be protective.
Low serum albumin levels indicate malnutrition and may, in addition, signal a heightened systemic inflammatory burden(Reference Sheinenzon, Shehadeh and Michelis25). Malnutrition has been shown to impair the production and activation of immune cells, thereby weakening innate immune responses as well as adaptive immune responses(Reference Nimmanwudipong, Cheadle and Appel26). This immunosuppressive state may predispose individuals to chronic low-grade inflammation, which can accelerate atherosclerosis through endothelial injury and in turn increase plaque instability(Reference Wolf and Ley27). Moreover, nutritional status can influence lipid metabolism and regulate blood lipid levels. Inadequate nutrition may cause lipid metabolic disturbances, which can ultimately increase the risk of atherosclerosis(Reference Galkina and Ley28). Atherosclerosis, as a systemic disease, not only affects the coronary arteries but also significantly increases the risk of cerebrovascular events, serving as a core pathological basis for ischaemic stroke(Reference Banerjee and Chimowitz29). Building on prior evidence linking malnutrition to chronic inflammation and dysregulated lipid metabolism, we further hypothesised that inflammation- and lipid-related markers might mediate in the association between the NRI and stroke and therefore conducted an exploratory mediation analysis. The results indicated that five biomarkers were robustly linked to stroke (with significant direct effects) and suggested that TC, LMR and NLR, among others, may partially mediate the link between low NRI and increased stroke risk, supporting the notion that reduced NRI may elevate stroke risk through both lipid metabolic imbalance and chronic inflammation. However, the mediated proportions of the indirect effects were relatively small. Several factors may explain this observation. First, stroke is a multifactorial disease. The INTERSTROKE study reported that multiple modifiable risk factors together account for approximately 88–90 % of the stroke population-attributable risk, with traditional risk factors such as hypertension contributing particularly strongly, suggesting that the NRI–stroke association may operate more through pathways involving blood pressure regulation, metabolic abnormalities and cardiovascular factors(Reference O’Donnell, Xavier and Liu30). In addition, endothelial dysfunction represents a key pathological process in stroke, and cohort evidence indicates that lower flow-mediated dilation is associated with incident ischaemic stroke(Reference Numazaki, Nasu and Satoh31). Second, indices such as SII, NLR, LMR and PPN are computed mainly using peripheral blood cell counts and thus primarily reflect peripheral immune cell composition and systemic inflammatory propensity, which may not directly capture stroke-relevant inflammatory cytokines or localised vascular-wall inflammation. Previous studies have linked elevated inflammatory factors, including IL-6 and hs-CRP, to a higher risk of ischaemic stroke(Reference Zhou, Han and Gong32,Reference Huang, Zhang and Wang33) , which could partly account for the relatively small mediated proportions observed for these cell-derived indices. Finally, the association between lipid levels and stroke may differ across subtypes because of underlying pathological heterogeneity. Prospective evidence suggests that higher TC/TG levels are associated with greater ischaemic stroke risk, whereas very low TC levels may be associated with a higher risk of hemorrhagic stroke(Reference Gu, Li and Chen34). Because stroke subtypes were not distinguished in the present study, the mediating role of TC when treated as an isolated lipid phenotype may have been diluted. Overall, these findings highlight NRI as an integrated assessment index that captures nutritional status and may influence stroke onset and course through effects on lipid profiles and inflammatory responses.
Therefore, the importance of nutritional intervention in stroke management should not be overlooked. Regular monitoring of patients’ nutritional status (e.g. serum albumin levels), combined with early intervention strategies, may help reduce complications and facilitate recovery. Moreover, future research should further elucidate how nutritional status and inflammatory processes interact across the initiation, progression and prognosis of stroke.
Several limitations warrant consideration. First, because this analysis is cross-sectional, the data cannot support causal inference regarding a direct link between NRI and stroke. In addition, NRI and lipid/inflammatory biomarkers were assessed at the same NHANES examination; by contrast, stroke status relied on self-reported prior diagnosis, which prevents clear temporal ordering and thus limits causal mediation inference. Accordingly, the mediation analysis results are best viewed as exploratory and hypothesis generating, not as evidence for a causal mechanism; the observed association may also reflect reverse causation or other bidirectional relationships. Second, stroke status and part of the study information were derived from participant self-reports and were not confirmed through medical record review or clinical adjudication; this reliance on self-report may introduce recall bias and outcome misclassification, thereby undermining the reliability of key variables and the observed association. Moreover, stroke is widely recognised as a multifactorial disease, arising from complex genetic and environmental mechanisms. Therefore, residual or unmeasured confounding factors may still exist. Additionally, because stroke subtypes (e.g. ischaemic v. hemorrhagic stroke) were not available, subtype-specific analyses could not be conducted, which prevented us from evaluating whether the association between NRI and different stroke aetiologies varied across subtypes. Finally, although the study sample demonstrated moderate representativeness – evidenced by a self-reported stroke prevalence of 3·98 %, consistent with previous reports(Reference Mao, Weng and Xie13) – caution is required when generalising these findings. Differences in racial background, cultural context and healthcare systems could constrain how well these findings translate across settings and populations. Future investigations are encouraged to recruit broader demographic samples and incorporate long-term follow-up approaches to better delineate the causal link between NRI and stroke, providing a stronger foundation for more precise disease control and targeted interventions.
Conclusion
In this study, NRI was inversely associated with stroke prevalence. Exploratory mediation analyses indicated that lipid and inflammatory biomarkers may statistically explain a small proportion of this association. These observations highlight NRI as a potentially useful marker in relation to stroke prevalence and motivate further investigation of underlying biological pathways.
Supplementary material
For supplementary material/s referred to in this article, please visit https://doi.org/10.1017/S0007114526107181
Acknowledgements
Thanks to the NHANES and providers of all the datasets used in the study.
This work was supported by the Zhejiang Medical and Health Science and Technology Planning Program (No. 2025KY548).
H. J. contributed to conceptualization, formal analysis, writing – original draft, and visualization. J. W. contributed to conceptualization, writing – review & editing, and supervision. All authors read and approved the final manuscript.
The authors declare that they have no competing interests.
The National Center for Health Statistics Research Ethics Review Board approved all protocols, and informed permission was acquired from all participants included in the investigation.
Consent for publication: not applicable
The datasets analysed during the current study are available in the NHANES database (NHANES – National Health and Nutrition Examination Survey Homepage (cdc.gov)).