

Introduction
Turkey has been going through a profound urban renewal process over the past decade, one based on an urban policy where public and private land have been aggressively developed with major government support. In the view of some, property development is one of the pillars of Turkey’s economic growth, and therefore deserves the support it receives. In contrast, certain critiques suggest that Turkey’s construction sector has developed too rapidly and at the expense of other important sectors, such as the industrial sector. In addition, the centralized and clientelistic mechanisms that have dominated this urban renewal process have had adverse effects on state-society relations and have strained the social fabric. Despite profound public interest in the topic, empirical studies investigating this subject remain limited. This article aims to make a contribution in this regard by analyzing the government’s role in the rise of the construction sector, the extent of growth in this sector, and the economic and political consequences of these developments.
We show that the construction sector developed rather rapidly in the period before 2006, but then adopted a slower growth trend in the post-crisis era. The rise of the construction sector was supported by legal reforms that promoted public and private property development by lifting institutional restrictions and centralizing property development. These changes in the law enabled the government administration to develop public land and to provide cheap land to favored partners in the private sector, which in turn generated excessive rents.
The rapid rise of a state-led construction sector had important political and economic consequences vis-à-vis industrial development, the distribution of land rents, relationships between actors in the state and private sectors, and citizens’ rights as regards their urban environment. Our findings suggest that there was a transfer from the industrial sector to the construction sector in the period before 2006, which led to significant decline in the trend growth of the industrial sector. We believe that these results are related to the excessive rent generated in the construction sector, to opaqueness and favoritism in regards to distribution, and to limitations put on fair competition within the sector. These factors promoted clientelism and eroded ordinary citizens’ influence on urban policy decisions.
In the post-crisis era, the construction sector has slowed, which has weakened the validity of the widespread perception of there being an ever-rising share in the construction sector. The basic statistics provided in this paper reflect that the pre-crisis trend cannot be generalized in such a way as to accurately depict the subsequent developments that occurred in this sector during the second half of the decade. Our analysis highlights how, following a rapid increase in the years leading up to the 2007 global crisis, the share of the construction sector returned quickly to its pre-crisis levels, no longer contributing to the slowdown in the industrial sector during the post-crisis era. Nevertheless, a closer look at the data reveals certain characteristics of this sector that are effectively hidden in the aggregate numbers. When we decompose total construction into its private and public components, we observe that, while private construction has slowed, public construction has continued to grow rapidly—along with the concerns that inevitably have arisen due to the excessive centralization and clientelism in the sector. This fact indicates the necessity of an urgent reform in urban policy, one that would institute decentralization and transparency in urban development.
The AKP government, economic growth, and urban policy
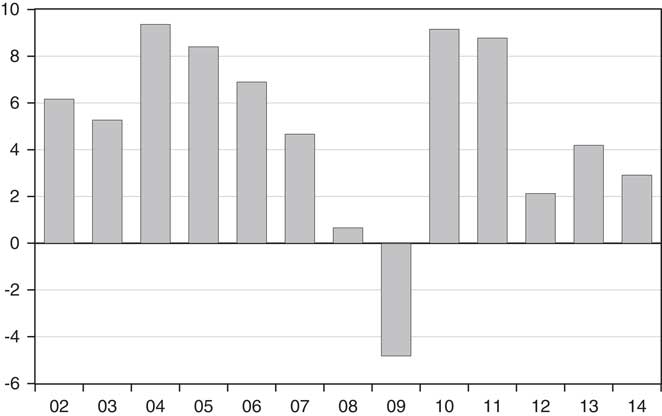
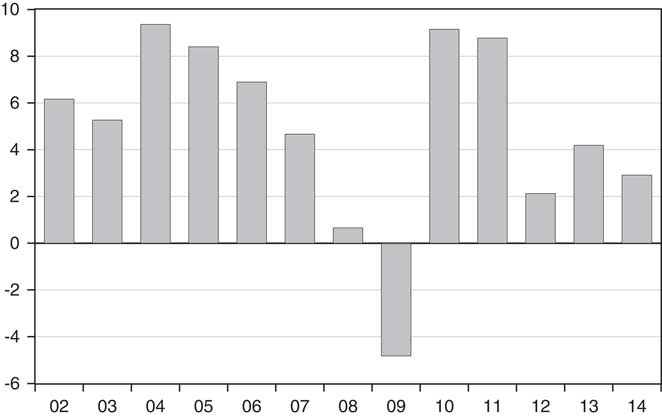
The rise of the Justice and Development Party (Adalet ve Kalkınma Partisi, AKP) in 2002 and its continued electoral success in subsequent years was well received in neoliberal circles. This was mainly the result of the government’s economic policies—which emphasized production, privatization, and other business-oriented policies—as well as its ability to maintain an above-average growth rate, particularly in its early years (Figure 1).
Growth Rate of Real GDP Source: Turkish Statistical Institute (Turkstat) and authors’ calculations
Privatization of public land and promotion of public and private property development played an important role in the growth strategy of the AKP government. Despite its overall neoliberal orientation, the government adopted a highly active role in the development of the construction sector, providing incentives both economic and political. The most significant economic incentive included the cheap land that the government provided for the purposes of property development.Footnote 1 Most large-scale developments took place through public-private partnerships, in which the state provided land while the private sector carried out the construction projects. In other cases, the state took an even more active role and carried out developments itself, using public land.
Changes in the legal framework
The government’s contribution to urban renewal was not limited to the provision of land, but also included reforms that shaped the pace of urban development. The changes and amendments made to the relevant laws over the past decade have dramatically centralized urban planning and lifted restrictions in urban development.Footnote 2 Perhaps the most important reform in this respect concerns the changes made to the Housing Development Administration Law (Toplu Konut Kanunu; henceforth HDAL, no. 2985).Footnote 3 The numerous amendments made to the HDAL between 2003 and 2013 transformed the rather idle state institution of the Housing Development Administration (Toplu Konut İdaresi Başkanlığı, TOKİ; henceforth HDA) into a major actor in property development, one which enjoys extensive powers, including publicizing private land, privatizing public land (independently from the Public Procurement Authority [Kamu İhale Kurumu]; henceforth PPA), developing for-profit real estate projects (independently from government ministries and municipalities), and forming partnerships with private developers. Today, the HDA is exclusively and directly accountable to the Prime Ministry, maintains a private budget independent from the treasury, enjoys exemptions from taxation, and can avoid the fiscal auditing of the Turkish Court of Accounts (T.C. Sayıştay Başkanlığı), the main regulatory institution against corruption. Atiyas notes that, although the HDA’s exemptions were originally limited to public housing projects, in 2011 these were extended so as to cover all of its construction activities.Footnote 4
Another important legal change took place in the Public Procurement Law (Kamu İhale Kanunu; henceforth PPL, no. 4734), which was amended extensively between 2002 and 2014.Footnote 5 The amendments limited the powers of the PPA to regulate the sale of public land and other construction-based government procurements. Transparency in regards to such procurements is critical in ensuring competitiveness in the property development sector and in fighting corruption. However, the amendments made to the PPL granted 60 institutions, including the HDA, exemptions from the PPL and relaxed procurement regulations. These reforms may well have expedited procurement processes, but at the same time they severely limited the regulatory power of the PPA and hindered the transparency of the procurements.
Other important legal interventions promoting property development include the amendments made to the Law on Land Development Planning and Control (İmar Kanunu; henceforth LLDPC, no. 3194), the Law on Metropolitan Municipalities (Büyükşehir Belediyesi Kanunu; hencforth LMM, no. 5216), the Law on the Transformation of Areas under Disaster Risk (Afet Riski Altındaki Alanların Dönüştürülmesi Hakkında Kanun; henceforth LTADR, no. 6306), and the Land Registry and Cadastral Law (Tapu Kanunu ve Kadastro Kanunu; henceforth LRCL, no. 6302), among others. The amendments made to the LLDPC relaxed the necessary procedures for obtaining building permits and limited the enforcement of the administrative court’s decisions meant to stop unlawful construction developments.Footnote 6 The LMM centralized urban planning by granting metropolitan municipalities increased rights to develop city plans and by limiting the power of local administrations, thereby hindering residents’ access to the urban planning decisions that impact their surroundings.Footnote 7 The LTADR allowed public actors, such as the HDA and its private sector allies, to intervene in and transform areas that they designate as being under risk of disaster, without having to receive consent from the residents.Footnote 8 Finally, the LRCL provided foreign nationals (with exceptions including Cuban, North Korean, Syrian, and Armenian nationals) with the right to purchase private property in Turkey.Footnote 9
These legal amendments allowed the state not only to promote property development, but also to become a key actor in the construction sector. The HDA records suggest that the number of housing units developed through HDA projects has risen considerably over the past decade, from 43,145 between 1984 and 2003 to 590,483 between 2004 and 2014.Footnote 10 According to statistics from the Association of Real Estate and Real Estate Investment Companies (Gayrimenkul ve Gayrimenkul Yatırım Ortaklığı Derneği, GYODER), as cited by Törüner in 2008, the HDA’s market share increased from 1.1 percent in 2003 to 18.6 percent in 2007.Footnote 11 Similarly, 2013 statistics from the Organization of Housing Developers and Investors (Konut Geliştiricileri ve Yatırımcıları Derneği, KONUTDER) suggest that the HDA is the number one actor in the housing sector, having developed 10 percent of all housing units developed between 2002 and 2012.
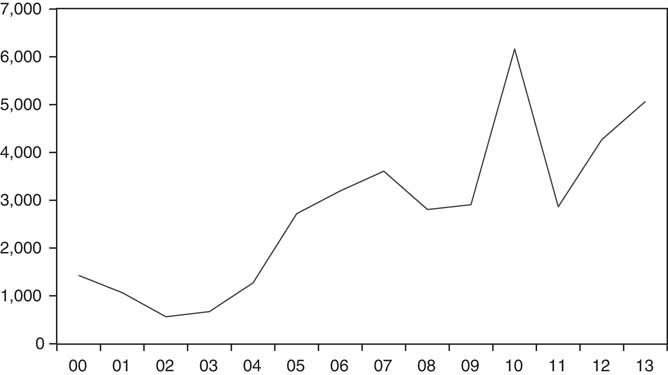
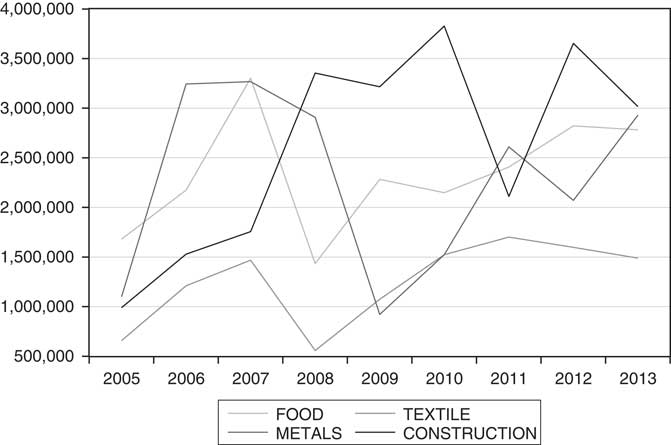
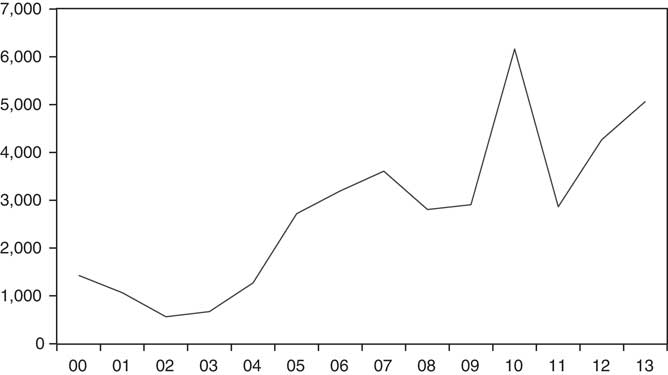
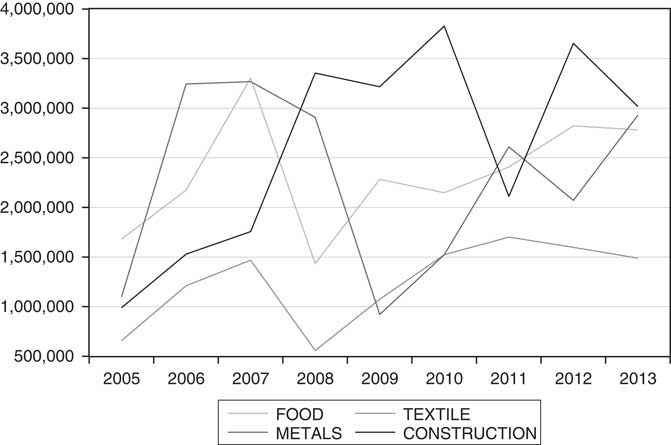
While the HDA records reveal the massive rise of the HDA as a developer and/or partner in the construction sector, private sector counterparts have also enjoyed the new legal environment promoting property development. Cheap land obtained through connections to the government and fewer institutional restrictions on property development have reduced economic and bureaucratic costs for these entrepreneurs and promoted new construction. Figure 2 demonstrates the dramatic rise in building permits distributed over the past decade, which occurred thanks to changes to the laws that lifted restrictions on property development. Figure 3 compares the profits earned in various sectors of the economy between 2005 and 2013 and demonstrates the rise in the profitability of the construction sector, which surpassed other sectors.Footnote 12
Number of Building Permit Source: Turkstat
Breakdown of Profits in Alternative Sectors Source: Central Bank of Turkey
Overall, the government’s emphasis on urban development, its active role in the construction sector, and changes made in the legal framework had important consequences. The following sections of the article focus on the economic consequences of this urban policy and analyze the role that the construction sector has played in Turkey’s economic growth.
The rise of the construction sector
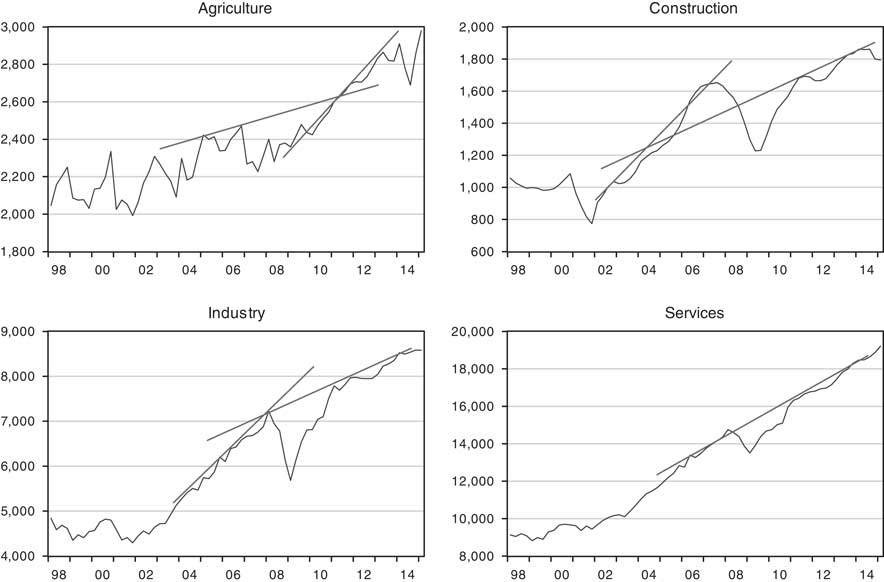
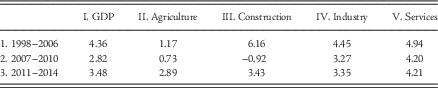
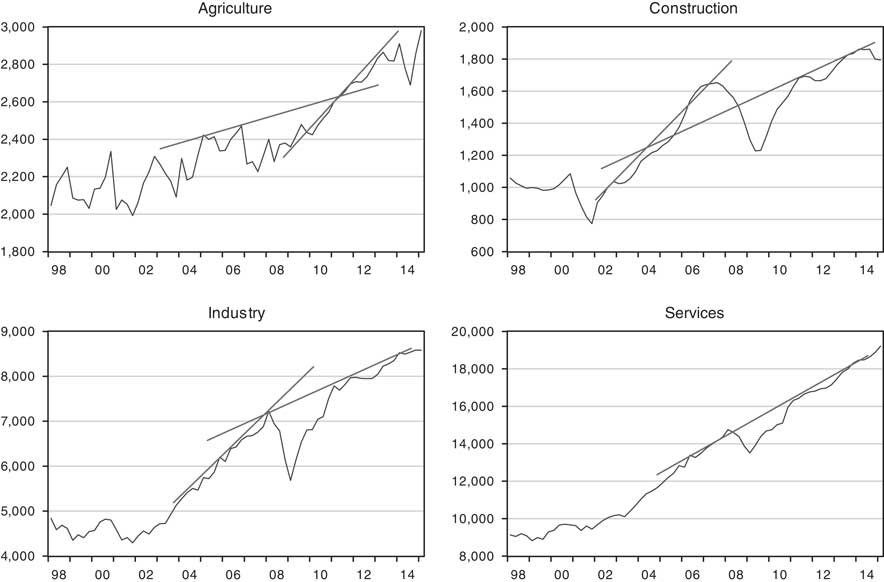
In order to analyze the development of the construction sector and situate its role within the broader economic context of Turkey, in Figure 4 we plot the four components of Turkey’s GDP according to the production approach, using quarterly data for the period from 1998.q1 through 2015.q1. Table 1 provides the annual growth rates of these components.
GDP Components Based on the Production Approach Real GDP using 1998 prices (million TL). Seasonally adjusted data using Census X-13 technique. Source: Turkstat
Average Annual Growth Rates

Several observations are immediately noticeable from Figure 4 and Table 1: (i) the construction sector was indeed the most rapidly growing sector in the period before the financial crisis (Table 1, row 1), but the post-crisis trend (row 3, column 3) seems to be slower than the pre-crisis trend (row 1, column 3); (ii) there has been a slowdown in the trend growth of the industrial sector in the post-crisis period (row 3, column 4), which closely follows the general trend in the GDP; (iii) there was also a slight slowdown in the services sector after 2007 (column 5); and (iv) the agricultural sector has been the only sector to accelerate its trend growth in the period after the 2007–2008 financial crisis.
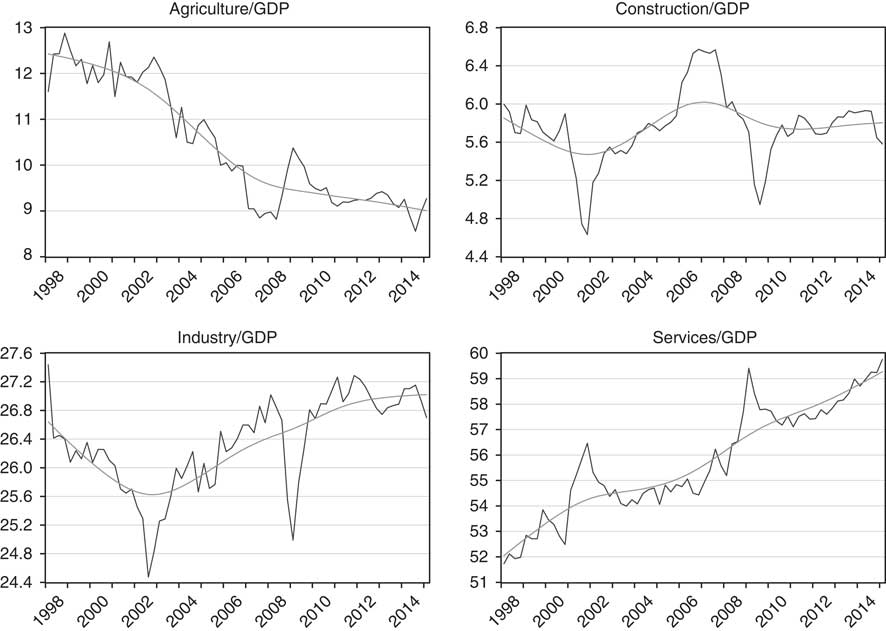
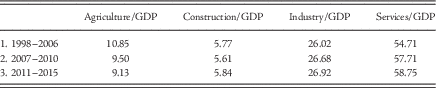
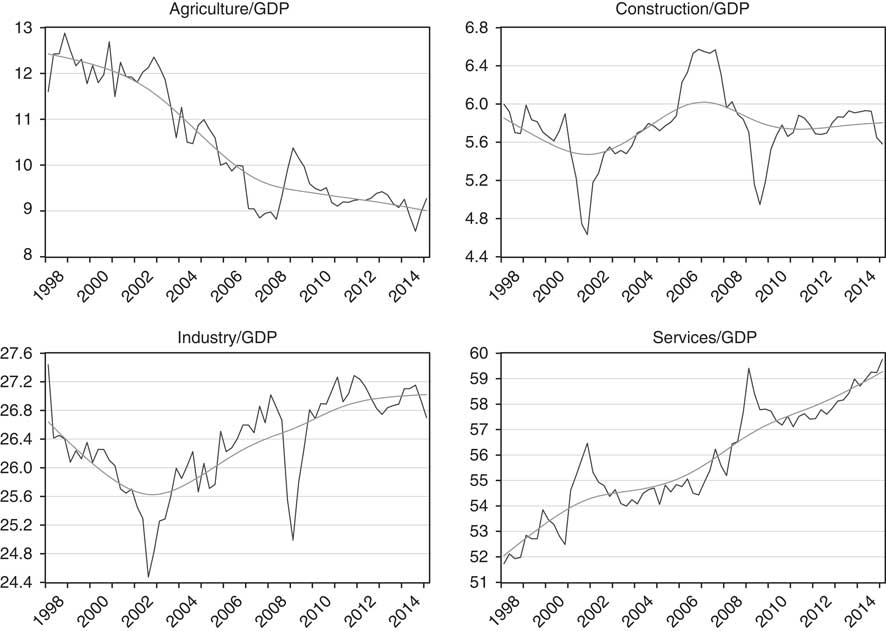
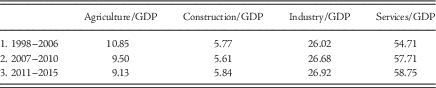
Figure 5 illustrates the shares of these sub-components as a fraction of the GDP, while Table 2 provides average quarterly shares. The red line shows the Hodrick-Prescott time trend. From 2001 onwards, the share of the construction sector increased, reaching its peak in 2007, as seen in Figure 5. However, after the crisis, its share dropped back down to slightly below 6 percent, which is approximately the average for the whole sample, as seen in Table 2 (column 2). Despite the acceleration in the growth rate of the agricultural sector in recent years, we may also note that its share in the GDP followed a decreasing trend over time (Table 2, column 1). Turning to the lower panels, the share of industry had an increasing trend starting roughly in 2002 and continuing until the 2007–2008 crisis, but the trend growth then slows in the post-crisis period. The last panel shows that the share of the service sector has had an increasing trend throughout the sample period.
Sectoral Shares in GDP Using the Production Approach Real GDP using 1998 prices (million TL). Seasonally adjusted data using Census X-13 technique. Source: Turkstat and authors’ calculations
Average Quarterly Shares
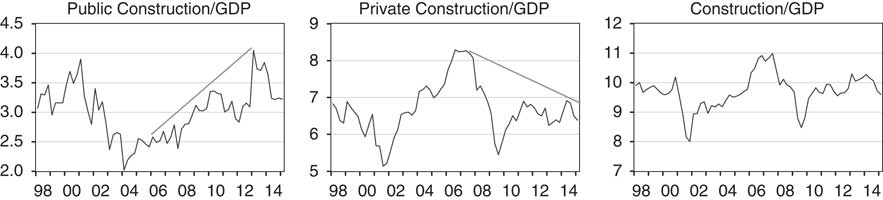
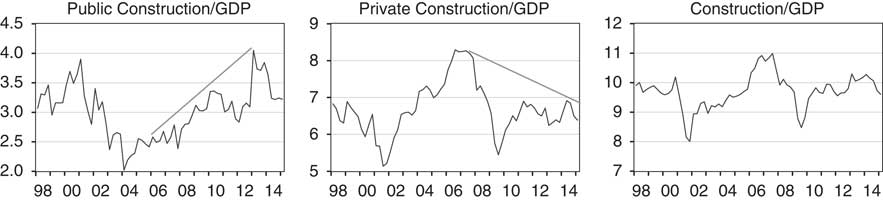
In addition to the production approach, another method of decomposing the GDP is the expenditure approach. With this approach, construction spending is shown as part of the investment category, which is further broken down into public and private investment. Figure 6 illustrates the share of construction measured according to the expenditure approach. The left panel shows the share of construction expenditure undertaken by the public sector, while the middle panel shows the share of construction expenditure undertaken by the private sector. The panel on the right then shows the sum of these two sub-components as a fraction of the GDP, which is comparable to the upper right panel in Figure 5.Footnote 13 Since 2004, the share of the public sector construction expenditure has had an increasing trend. Even though the share of private construction expenditure declines in the post-crisis period, the share of public construction expenditure continues to increase. In the aggregate, however, the overall decline in private construction offsets the rise in public construction, thus keeping the share of total construction in the GDP at a stable level.
Sectoral Shares in GDP Using the Expenditure Approach Real GDP using 1998 prices (million TL). Seasonally adjusted data using Census X-13 technique. Source: Turkstat and authors’ calculations.
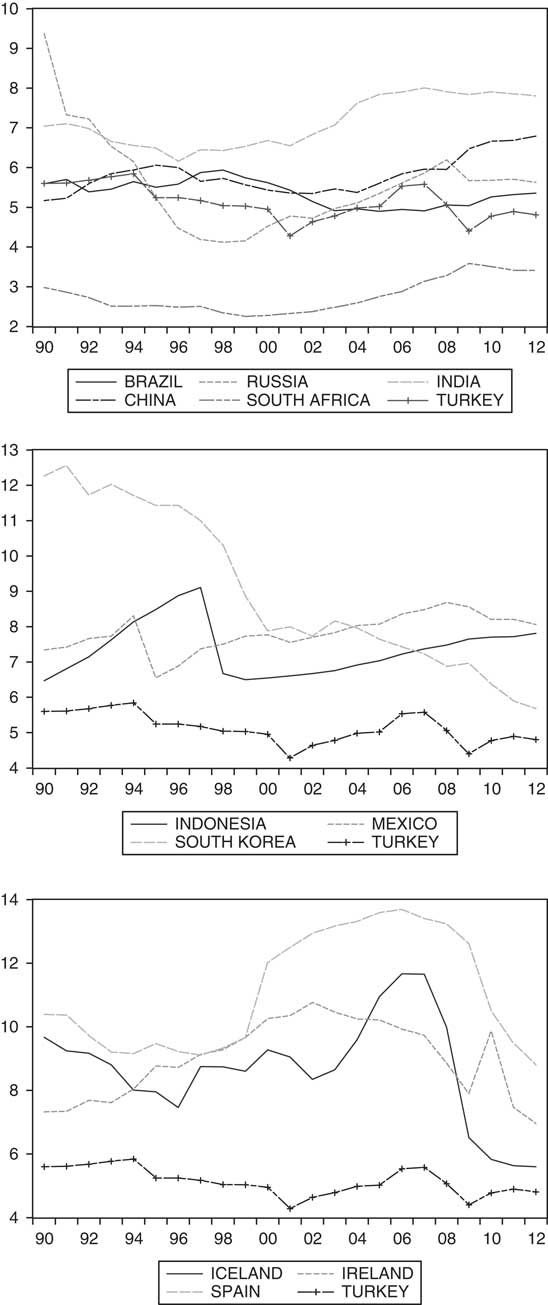
Finally, a comparative perspective suggests that the growth of the construction sector in Turkey has paralleled its counterparts elsewhere. Figure 7 compares the share of the construction sector in Turkey with several other emerging market economies, as well as with those eurozone countries that experienced a construction boom. The charts plot the share of the construction sector as a fraction of the GDP. The top panel compares the construction ratio in Turkey with the so-called “BRICS” economies, which are the major emerging market economies of Brazil, Russia, India, China, and South Africa. We observe that, while the share of the construction sector is highest for India (hovering around 7 percent) and lowest for South Africa (hovering around 3 percent), Turkey remains inside this corridor for the entire period from 1990 to 2012. The middle panel provides a further comparison with other emerging market economies, such as Indonesia, Mexico, and South Korea. Here, we observe that the share of the construction sector in Turkey is consistently below these countries as well. The lower panel compares the share of Turkey’s construction sector with those eurozone countries whose names were associated with real estate bubbles during the recent financial crisis; namely, Spain, Iceland, and Ireland. Here, we observe that the construction ratios in these troubled economies were more than twice as large as the share of the construction sector in Turkey.
Construction/GDP from an International Perspective Source: United Nations Statistics Division, National Accounts Main Aggregates Database
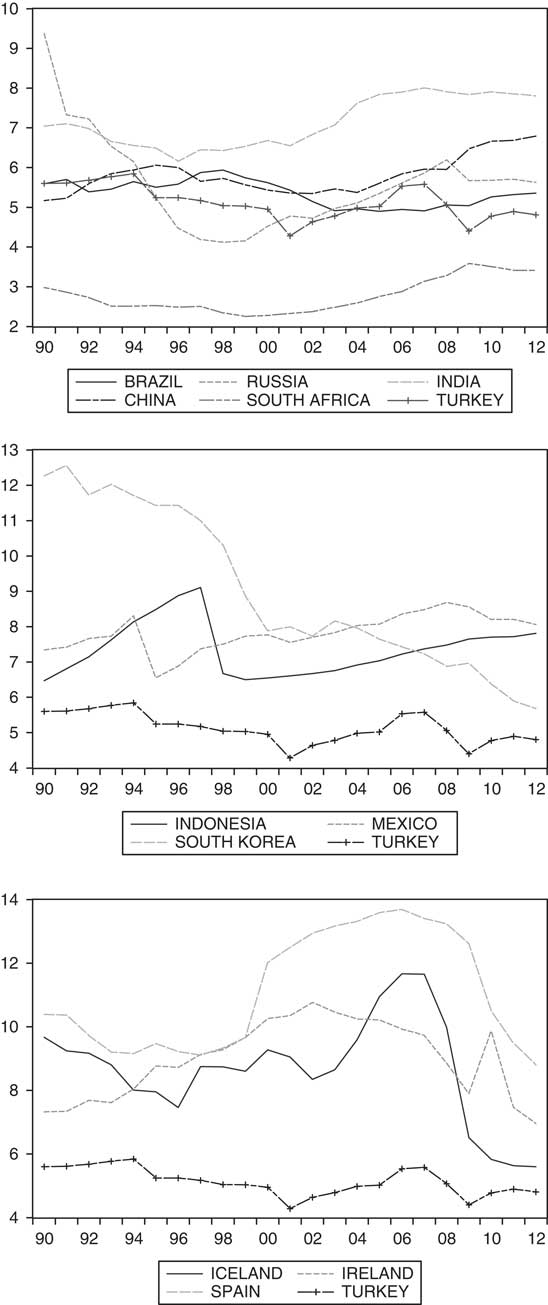
Overall, Figure 7 suggests that, even though the construction sector grew rapidly before 2006, its share has in fact been comparable to other emerging market economies, and that it has never reached the levels observed in those countries that experienced real estate bubbles. Although the growth in the construction sector is not at an extreme level, this fact does not preempt the problems associated with the state’s involvement in the construction sector, with the opaqueness of the law, and with the generation of excessive rent, all of which may generate wrong incentives for entrepreneurs to switch into construction from more productive sectors. In the next section, we investigate this question formally.
The effects of construction on economic growth
When the AKP came to power in 2002, Turkey’s story of rapid growth driven by the industrial sector continued, but now with an additional emphasis on the promotion of property development. However, the AKP’s urban policy created controversy. While some groups considered the government’s urban renewal strategy to be the real engine of Turkey’s economic growth, others argued that it may have had adverse effects on the economy, particularly due to excessive state involvement and the limits placed on transparency and institutional checks.
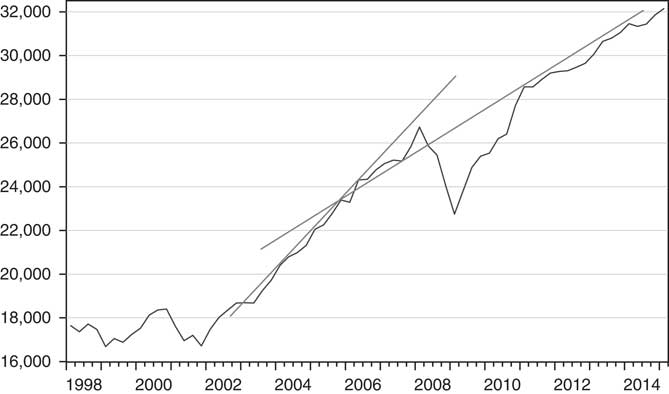
Soon after the AKP’s second term in 2007, the global financial crisis struck. While Turkey’s GDP had a quick rebound after the recession in 2008, the pre-crisis trend has not yet been matched again (Figure 8).
Slowing Trend in Turkish GDP Real GDP using 1998 prices (million TL). Seasonally adjusted data using X-13 technique. Source: Turkstat
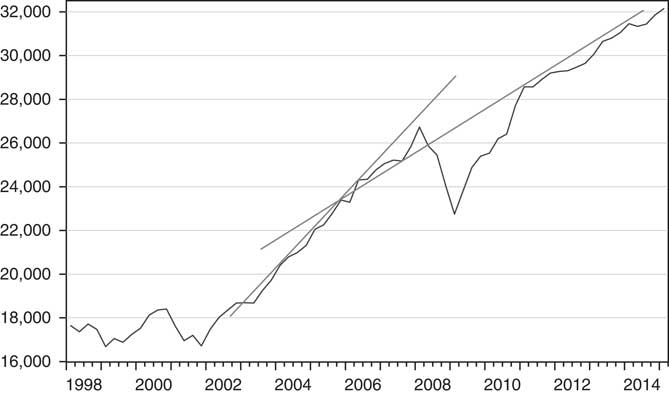
The slowing trend in the GDP was largely due to the slowdown in the industrial sector, which was argued, by some critics, to have been a consequence of the expansion in the construction sector.Footnote 14 A shift from the industrial sector to the construction sector can partly explain the slowdown in economic growth, owing to the lower productivity of the construction sector as compared to the industrial sector. Furthermore, unlike the industrial sector, which contributes to production both directly and indirectly by producing the means to produce other products, the construction sector’s contribution to total output is limited to the final good produced.Footnote 15 Hence, a transfer from the industrial sector to the construction sector was and is bound to lead to a slowdown in GDP growth.
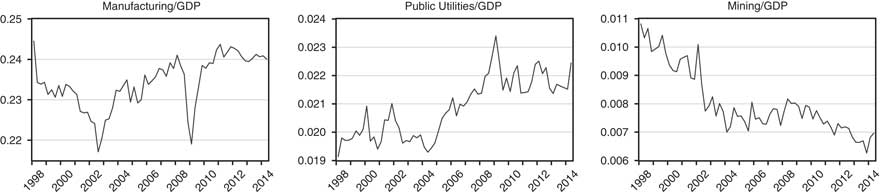
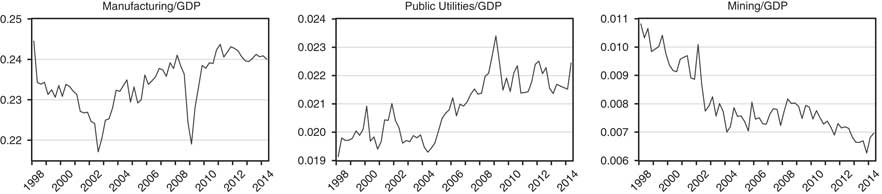
Figure 9 takes a closer look at the sub-components of the industrial sector—namely, manufacturing, public utilities (including electricity production and distribution as well as water purification and sewage systems), and mining—as a share of GDP. One can note that the overall trend of the industrial sector is driven by manufacturing, which is its largest component. Unfortunately, a finer breakdown within the manufacturing sector is not available, though it would allow us to see whether or not the production of intermediate goods for the construction sector has increased. Nevertheless, it is interesting to note that infrastructure spending, as captured in the public utilities category, follows the increase in the construction sector with a lag. Two years after the construction sector reached its peak during 2006–2007, the public utilities sector reached its peak during 2008–2009.
Sub-components of the Industrial Sector as a Fraction of GDP Source: Turkstat and authors’ calculations.
It has been argued that excessive rents are available in the construction sector for whoever can secure inroads to the state bureacucracy and obtain favorable government contracts and/or building permits (cf. Figure 1), which attracts industrialists to the construction sector to seek and find such rents. While government officials have noted that growth in the construction sector has been following normal trends, it has also been admitted that regulatory changes did indeed cause excessive rents. Former Deputy Prime Minister Ali Babacan expressed his concerns about these issues, noting that “there is excessive rent in the construction sector, which reduces interest in the industrial sector,” and that the priority would be to reintroduce transparency and thereby avoid rent-based shifts in the industrial sector toward construction.Footnote 16
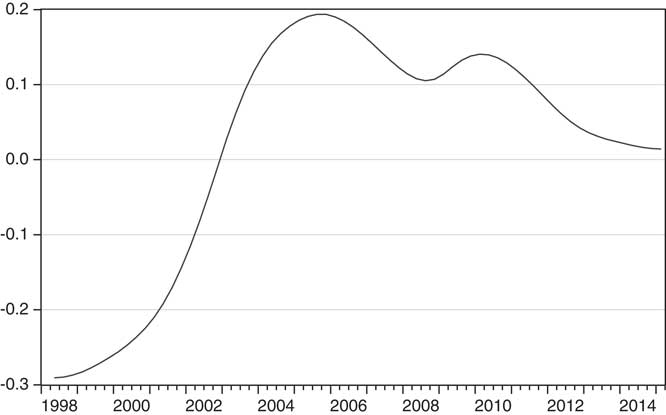
In this section, we will analyze these claims formally and investigate whether the slowdown in GDP growth is indeed connected to the relationship between the construction sector and the industrial sector. Simple growth charts give no information about causal relationships or any spillover that may exist among different sectors. Therefore, further analysis is necessary in order to test the claim that the slowdown in industrial growth could be at least partially attributed to the excessive rent generated in the construction sector. With this purpose in mind, we will first document the declining trend in the industrial sector. Figure 5, as mentioned above, had plotted the Hodrick-Prescott time trend of the industrial sector’s share in the GDP, highlighting the slowdown in this trend. Figure 10, on the other hand, illustrates the growth rate of this trend in order to better illustrate the slowdown.
Growth Rate of Industry/GDP Trend Source: Turkstat and authors’ calculations.
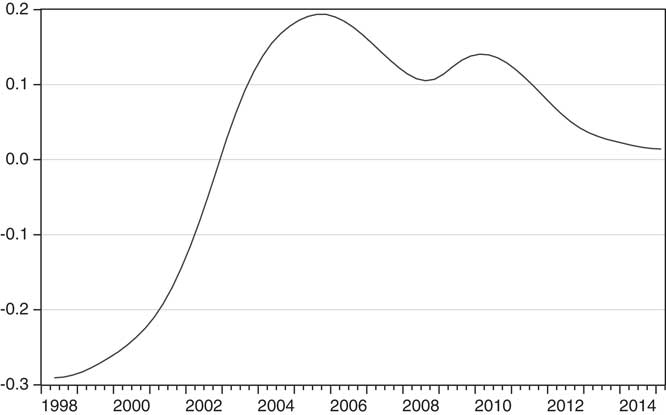
The average growth rate in the trend of the industry-to-GDP ratio declines from 0.15 in the 2003–2006 period to 0.08 during the post-2006 period, where the difference is statistically significant (not shown).Footnote 17 The question, then, is whether or not the construction sector is at least partly responsible for this decline. If the popular claims are true, then the excessive rents in construction projects may have caused shifts from the industrial sector to the construction sector. In such a case, the decline in the share of industry could be at least partially explained by transfers from the industrial sector to the construction sector, as an attempt to exploit such rents.
In order to test this claim formally, we consider the following regression:
 $$\eqalignno{ \log (Trend_{t} ^{{{{Industry} \over {GDP}}}} )\,{\equals}\,\alpha {\plus}\beta _{1} \,Industry_{{t{\minus}1}} {\plus}\beta _{2} \,Construction_{{t{\minus}1}} ^{{Private}} \cr{\plus}\beta _{3} \,Construction_{{t{\minus}1}} ^{{Public}} {\plus}\beta _{4} \,\matrix{ {Agriculture_{t} _{{{\minus}1}} } \hfill \cr } {\plus}\beta _{5} \,Services_{t} _{{{\minus}1}} {\plus}{\epsilon}_{t} $$
The dependent variable is the growth rate of the industry-to-GDP trend, as plotted in Figure 10. t is the quarter index. The right-side variables are the components of real GDP (in billions of TL), as measured in 1998 prices provided by Turkstat. All GDP components are seasonally adjusted.Footnote 18
If part of the slowdown in the growth rate of the industrial sector is due to transfers to the construction sector, then we would expect the coefficient associated with the construction sector to be negative. Specifically, if the rise in the construction sector in the previous quarter (Construction
t–1) is associated with a decline in the trend of the industrial sector in the current quarter
 $(Trend_{t} ^{{{{Industry} \over {GDP}}}} )$
, then β
2<0 (for private construction) and/or β
3<0 (for public construction).
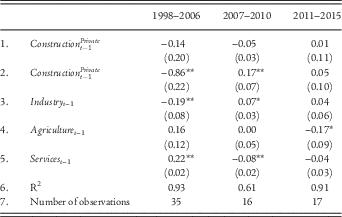
Table 3 shows the regression results. It is observed that an increase in public construction in the previous quarter reduced the industry-to-GDP trend in the period before 2006 (row 2, column 1). This finding is consistent with the claim that the excessive rents generated in the construction sector led to transfers from the industrial sector to the public construction sector, thereby slowing down the growth rate in the industrial sector. Turning to the second column, it is observed that the public construction sector actually supported the industrial sector in the crisis environment, when the construction sector was deliberately supported by the government so as to provide such a boost. Nevertheless, any feedback from the construction sector into the industrial sector disappears in the last sample, as the share of construction slows, as shown in Figure 5. This finding suggests that the declining trend in the industrial sector observable in the post-crisis era cannot be explained by transfers to the construction sector, even though the rapid increase in construction during the pre-crisis period had a negative effect on industrial growth. Acemoğlu and Üçer attribute the slowdown in the period after 2007 to deterioration in economic and political institutions, as well as to the absence of structural and economic reforms during this period.Footnote 19
Trend Growth in Industry/GDP

HAC standard errors and covariance are reported under coefficient estimates in parenthesis. ** indicates significance at 99 percent level of confidence, * indicates significance at 95 percent level of confidence. The regression model includes a constant.
As for the remaining coefficients, there is negative serial correlation in the industrial sector during the period before 2006, as shown by the significant coefficient during that timeframe (column 1). While there is no feedback from the agricultural sector into the industrial sector for the first two periods, the service sector contributed positively in the first period and negatively in the second period.
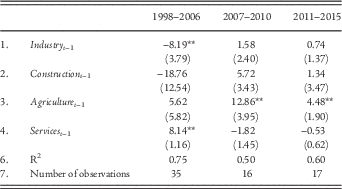
Table 4 provides a mirror-image exercise similar to Table 3. Here, we have put under the magnifying glass the trend growth in the share of construction (as our dependent variable) to see if an acceleration in the growth of the construction sector is associated with a decline in the industrial sector in the previous quarter. If the increase in construction’s share is at least partly due to transfers to this sector from industry, then we should observe a negative coefficient associated with the industrial sector in the previous quarter. The first column in Table 4 reflects that this was indeed the case for the first sample period, thus supporting our findings in Table 3. Also similar to Table 3, this effect disappears in the next two sub-samples. In other words, the results suggest that there was indeed a shift from the industrial sector to the construction sector during the period before 2006, when the construction sector grew quite rapidly. However, this evidence disappears in the post-crisis era, when construction growth slowed.
Trend Growth in Construction/GDP

HAC standard errors and covariance are reported under coefficient estimates in parenthesis. ** indicates significance at 99 percent level of confidence. The regression model includes a constant.
The political costs of Turkey’s urban development
Turkey went through a dramatic urban development, particularly in the period from 2002 to 2006, although this development was achieved through excessively centralized and clientelistic means. While some of the economic costs of this construction boom declined after 2006, political concerns remained insofar as the sector continued to be under the influence of the clientelistic relations between a highly interventionist state and its allies in the private sector, with little transparency, checks and balances, or deliberation.
A major concern regarding Turkey’s real estate development arises from the fact that it has significantly increased state influence on the distribution of land rents.Footnote 20 Over the past decade, we have witnessed how a strong government administration—one that enjoys single-party rule, control over the legislative branch, and the absence of rival institutions—has used the powers in its discretion to further consolidate its control. In this context, the changes and amendments made to property development laws over the past decade have expanded the administration’s role in the creationFootnote 21 and distribution of land rents.Footnote 22 Under these circumstances, the government can create new land rents, either by commodifying more public land or by relaxing building permits for already commodified lands. Weakness in terms of democratic procedures enables state institutions to avoid consulting citizens during commodification and other decisions related to the usage of public land. In addition, the limitations on transparency and on the checks and balances among institutions create a large space within which the administration can maneuver to influence the distribution of the land rents generated through these developments. While land sales are conducted through public tenders, which are regulated through laws passed in 2002, recent amendments to the law have decreased the power of regulatory institutions, thus challenging fair competition.Footnote 23 As a result, some actors enjoy noncompetitive access to land rents. This, as Ali Babacan has noted, makes for “excessive rents” (ölçüsüz rantlar) thanks to these actors’ ability to build inroads to the state bureaucracy and obtain favors. However, according to the Chamber of Civil Engineers, numerous competent construction companies remain unable to receive such rents.Footnote 24 This situation prevents institutionalization, limits free and fair competition, and decreases efficiency.
Turkey’s state-controlled property development also has implications for the process of democratization. Both older and more recent studies on modernization suggest that economic development contributes to democratization.Footnote 25 In this theory lies the assumption that an independent bourgeois class can play a positive role in democratization.Footnote 26 Among the many reasons for this, the most significant is that an independent bourgeoisie can balance political authority by demanding political representation in return for its economic contributions through taxation. Nevertheless, this democratizing effect of economic development may be more limited or even absent in clientelistic societies where the bourgeoisie is dependent on state favors.Footnote 27 Members of the bourgeoisie are then “contingent democrats” who support democracy only when their economic interests are relatively independent from state support.Footnote 28 Therefore, to the extent that property development in Turkey takes place through noncompetitive and clientelistic means, this constitutes an obstacle for democratization. In the real estate market—where the careers of real estate developers largely depend on their ability to secure cheap land, profitable government contracts, and/or favorable construction permits—they become dependent on the state thanks to their privileged connections with the government bureaucracy, which in turn hinders the democratic potential of this entrepreneurial class. This becomes a particularly important problem when competitors for government contracts, public land, or exceptional construction permits include actors who have a particular need to maintain an objective stance toward the government, such as the owners of media companies. Over the past decade in Turkey, the majority of media patrons—among them Çalık Holding, the Kalyon Group, the Albayrak Group, and Çukurova Holding—have been able to count themselves among the winners of billion-dollar government contracts in the real estate sector. In the eyes of the public, this situation has given rise to significant doubts concerning their objectivity.
The combination of political centralization and neoliberalism in Turkey’s urban renewal policy also erodes ordinary citizens’ “right to the city” in that decisions on urban development are made largely between the state and private developers.Footnote 29 The changes made to the law, described in the previous sections, centralized urban development and weakened the power of local and elected actors. As a result, citizen participation in the making of urban policy has eroded considerably. Under these circumstances, the rent value of land has come to dominate over its social value, shared public space has declined dramatically, and high-rise buildings have replaced lower buildings, all of which has caused major negative externalities to be incurred by citizens—who may in fact never have asked for such developments in the first place. In the absence of checks and balances among institutions and with a lack of participatory decision making, cities transform too rapidly, and the transformation proceeds according to the interests of the state and its partners in the private sector, rather than the interests of ordinary citizens.Footnote 30
In order to overcome the challenges described above, Turkey needs an urban reform that would promote decentralization and checks and balances among those institutions responsible for the regulation of property development, as well as instituting transparency and citizen participation in urban planning.Footnote 31 Such reforms would, firstly, need to limit the excessive powers and exemptions enjoyed by the HDA, and subject the HDA’s activities to the supervision of regulating institutions such as the Court of Accounts, administrative courts, and the PPA. Secondly, the LMM and other municipal laws need to be reformed in such a way as to decentralize municipal administrations so as to increase the decision-making power of local municipalities in developing city plans. Any such reforms should also increase transparency and deliberation during the making of city plans, and should enable residents to have access to these decisions both directly and indirectly, through locally elected city council members. Thirdly, the PPA needs to be reformed, with exemptions to the PPL being lifted, PPA procedures being tightened so as to ensure transparency, and restrictions being placed on media patrons’ participation in public procurements (as was originally suggested in 2002 by Kemal Derviş, who was serving as the Minister of Economic Affairs during the drafting of the PPL).
Conclusion
In this article, we have analyzed recent developments in the construction sector in Turkey and considered their economic and political significance. Our analysis has shown that, between 2002 and 2006, the construction sector grew rapidly, supported by state interventions occurring mainly in the form of legal reforms as well as economic incentives. The growth in private sector construction has returned to regular trends in the post-2007 period, although public sector construction has continued to rise.
One concern in this regard is that the excessive rents that can be generated in the construction sector provide incentives to leave the industrial sector in favor of construction. Our findings provide evidence of such transfers occurring for the period before 2006, although the construction sector does not seem to be responsible for the declining trend of the industrial sector in the post-crisis period.
The state-led rise of the construction sector has also had important political consequences, which have remained significant even in the post-crisis period when growth in the sector has slowed. The central role of the government administration and opaqueness in terms of the distribution of land rents and other incentives continue to increase the private sector’s dependence on the state, to challenge fair competition, and to erode ordinary citizens’ influence on urban development. These problems need to be addressed urgently through reforms in urban policy. Any such reforms need to decentralize property development, to restore checks and balances among the institutions that regulate the relevant processes, to increase citizens’ access to urban policy decisions, and to ensure transparency and competitiveness in the distribution of land rents.