Introduction
Depression is a growing public health issue with more than 300 million cases estimated worldwide (WHO, 2017). It was ranked as the second leading cause of global burden of disease in 2010 and expected to be first by 2030 (Ferrari et al., Reference Ferrari2013). Prevalence estimates for 2010 were 298 million cases of major depressive disorder and 106 million of dysthymia (milder, chronic form of depression lasting for 2 or more years) (Ferrari et al., Reference Ferrari2013). Furthermore, the global prevalence of major depressive disorder of greater than 3 months duration increased by 17% from 2005 to 2015 (GBD 2015 Disease and Injury Incidence and Prevalence Collaborators, 2016). Prevalence of depressive symptoms is highest in older adults (WHO, 2017) and believed to be underdiagnosed and undertreated (WHO, 2016; Arokiasamy et al., Reference Arokiasamy2017). As the 2015 global older adult population of 901 million is expected to increase by 56% to 1.4 billion by 2030 and by over 100% to near 2.1 billion in 2050 (United Nations, 2015), the global burden of depression in this cohort will increase substantially.
While there are effective treatments for depression, the number receiving treatment is below 50% globally and less than 10% in many countries (WHO, 2017). Lack of resources and trained healthcare providers, social stigma, and misdiagnosis have been suggested as barriers to effective care (WHO, 2017). Considering the low level of treatment and the rapidly increasing prevalence of depression in older adults globally (GBD 2015 Disease and Injury Incidence and Prevalence Collaborators, 2016), it is essential to identify large-scale modifiable factors that can impact on the risk of depressive symptoms in this population.
Socio-ecological models emphasize the importance of environmental influences on the physical and mental health of entire populations (Sallis et al., Reference Sallis, Cervero, Ascher, Henderson, Kraft and Kerr2006). The neighborhood environment is particularly important for older adults who typically spend more time in their local area than younger age groups and experience increased physical dysfunction and limited mobility due to visual and hearing impairment, musculoskeletal diseases, and other chronic health problems (WHO, 2012).
The neighborhood environment exerts its influence on depressive symptoms through various pathways. Adverse neighborhood conditions increase the risk of depression in all age groups by intensifying levels of stress and reactivity to negative events (Cutrona et al., Reference Cutrona, Wallace and Wesner2006), and acting as deterrents to engagement in behaviors such as socializing (Dassopoulos and Monnat, Reference Dassopoulos and Monnat2011) and being physically active (Kerr et al., Reference Kerr2016), which have been associated with better mental (Kim, Reference Kim2008; Richardson et al., Reference Richardson, Westley, Gariépy, Austin and Nandi2015), cognitive (Wu et al., Reference Wu, Prina and Brayne2014), and physical health (Diez Roux and Mair, Reference Diez Roux and Mair2010). Neighborhood attributes that facilitate an active lifestyle are also deemed to reduce the risk of depressive symptoms in late life by lowering the risk of chronic health conditions associated with depression, including cardiovascular disease (Lépine and Briley, Reference Lépine and Briley2011; van Marwijk et al., Reference van Marwijk, van der Kooy, Stehouwer, Beekman and van Hout2015), stroke (Hornsten et al., Reference Hornsten, Lövheim and Gustafson2013), cancer (Weiss et al., Reference Weiss Wiesel2015), hypertension (Kuo and Pu, Reference Kuo and Pu2011), and visual and hearing impairments (Chou and Chi, Reference Chou and Chi2004; Hsu et al., Reference Hsu2016). The neighborhood environment is deemed to affect older adults’ health and functioning (e.g. depressive mood) by interacting with their personal physical and social competencies and yielding adaptive or maladaptive responses (Glass and Balfour, Reference Glass, Balfour, Kawachi and Berkman2003; Julien et al., Reference Julien, Richard, Gauvin and Kestens2012). For example, older adults with impaired mobility (personal competency) may be at higher risk of developing depression (poor functioning) when living in a neighborhood with environmental barriers (e.g. traffic and road hazards) because they find it difficult to walk (Barnett et al., Reference Barnett2016) and spend time in their local environment which, in turn, leads to social isolation (maladaptive response).
Neighborhood environmental characteristics can be categorized into two broad categories: physical and social (including demographics). Physical neighborhood characteristics encompass attributes such as walkability (Cerin et al., Reference Cerin, Conway, Saelens, Frank and Sallis2009), footpath quality, traffic safety, aesthetics and access to parks, shops, and services (Van Dyck et al., Reference Van Dyck2013).
There is evidence that physical aspects of the neighborhood environment can affect older adults’ physical and social activities that may reduce the risk of depression (Issac et al., Reference Isaac, Stewart, Artero, Ancelin and Ritchie2009; Bauman et al., Reference Bauman, Merom, Bull, Buchner and Fiatarone Singh2016; Cerin et al., Reference Cerin, Nathan, van Cauwenberg, Barnett and Barnett2017). For example, the presence and diversity of recreational facilities and commercial destinations in the neighborhood were found to be predictive of more walking and other forms of physical activity in the elderly (Chad et al., Reference Chad2005; Cerin et al., Reference Cerin2013a). Perceived neighborhood traffic-related safety was positively related to older adults’ physical activity (Wilcox et al., Reference Wilcox, Bopp, Oberrecht, Kammermann and McElmurray2003). Neighborhoods may support older adults’ engagement in physical activity by facilitating socializing with friends (Chaudhury et al., Reference Chaudhury, Campo, Michael and Mahmood2016). For example, access to public transport, services, and amenities in the neighborhood provides older people opportunities for an active social lifestyle (Richard et al., Reference Richard, Gauvin, Gosselin and Laforest2009; Levasseur et al., Reference Levasseur, Gauvin, Richard, Kestens, Daniel and Payette2011). On the other hand, adverse physical neighborhood conditions, such as noise, littering, and heavy traffic may make it difficult for older adults to participate in community activities and interact with neighbors (Schieman and Meersman, Reference Schieman and Meersman2004). There is some evidence that physical neighborhood attributes are also directly related to depressive symptoms in the general population. Indeed, neighborhood noise levels and lack of green spaces or community facilities were found to be negatively associated with mental health (including indicators of depressive symptoms) in adults (Guite et al., Reference Guite, Clark and Ackrill2006; Annerstedt et al., Reference Annerstedt, Östergren, Björk, Grahn, Skärbäck and Währborg2012; Zhang et al., Reference Zhang, van Dijk, Tang and van den Berg2015). Also, the neighborhood built environment quality was negatively related to depression in women (Galea et al., Reference Galea, Ahern, Rudenstine, Wallace and Vlahov2005).
As to older adults, the most recent review on associations between neighborhood characteristics and depressive mood, encompassing studies up to mid-2011, reported mixed findings with respect to physical environment attributes (Julien et al., Reference Julien, Richard, Gauvin and Kestens2012). Three out of seven studies found no significant associations, three found associations in the expected diretion, and one study in the opposite direction than expected. Expected associations were found for neighborhood walkability and indicators of neighborhood problems (e.g. noise, run-down houses, and littering) (Schieman and Meersman, Reference Schieman and Meersman2004; Berke et al., Reference Berke, Gottlieb, Moudon and Larson2007; Bierman, Reference Bierman2009). Yet, two of the three studies measured environmental characteristics using self-reports (Schieman and Meersman, Reference Schieman and Meersman2004; Bierman, Reference Bierman2009), the responses of which may be affected by one's depressive state and may not correspond to reality (Mair et al., Reference Mair, Diez Roux and Galea2008). Thus, although a link between neighborhood physical characteristics and depressive symptoms in older adults is theoretically justified, the most recent review published in 2012 revealed a general dearth of empirical data on this topic (Julien et al., Reference Julien, Richard, Gauvin and Kestens2012).
Social aspects of the neighborhood environment encompass neighborhood demographic composition (e.g. percentage of older adults), socio-economic status (SES) or deprivation (e.g. median household income or percentage unemployment) and social processes (e.g. social cohesion, crime, and disorder). The social characteristics of a neighborhood are deemed to foster individual's adaptiveness to adverse affective conditions (including depression) by enhancing health-related behaviors (social or physical activities), and affecting mechanisms regulating stress levels through the buffering effects of social support and social links (Diez Roux and Mair, Reference Diez Roux and Mair2010; Blair et al., Reference Blair, Ross, Gariepy and Schmitz2014).
In line with the above propositions, studies have found higher levels of neighborhood safety to be predictive of more physical (Cerin et al., Reference Cerin, Lee, Barnett, Sit, Cheung and Chan2013c) and social activities (Levasseur et al., Reference Levasseur2015) and fewer depressive symptoms in older adults (Bierman, Reference Bierman2009). The same has been observed with respect to social cohesion (Echeverria et al., Reference Echeverría, Diez-Roux, Shea, Borrell and Jackson2008; Ahern and Galea, Reference Ahern and Galea2011; Stafford et al., Reference Stafford, McMunn and De Vogli2011; Buffel et al., Reference Buffel, De Donder, Phillipson, Dury, De Witte and Verté2014; Van Cauwenberg et al; Reference Van Cauwenberg2014) and SES (Bowling and Stafford, Reference Bowling and Stafford2007; Menec et al., Reference Menec, Shooshtari, Nowicki and Fournier2010; Cerin et al., Reference Cerin2013b). In their review on the neighborhood environment and depressive mood in older adults, Julien et al. (Reference Julien, Richard, Gauvin and Kestens2012) found 18 studies on neighborhood social characteristics. Most of the studies focused on the effects of neighborhood-level SES and demographics, while a few considered neighborhood crime and social capital variables. Neighborhood disorder and high levels of crime were positively correlated with depression, while neighborhood social capital and SES showed negatively associations with depressive symptoms in half of the cases. Of the examined demographic characteristics, neighborhood racial/ethnic composition was the most consistent correlate, indicating the need to study the effects of neighborhood characteristics by ethnicity or culture. Yet, only two out of 18 studies were conducted in a non-English speaking region (Taiwan), making it impossible to ascertain the generalizability of the observed associations across cultures.
Acknowledging the importance of the social and physical neighborhood environments as sources of influence on health (Yen et al., Reference Yen, Michael and Perdue2009; Renalds et al., Reference Renalds, Smith and Hale2010; Schüle and Bolte, Reference Schüle and Bolte2015), the number of studies on neighborhood characteristics associated with depression-related behaviors (e.g. physical activity) and depressive symptoms has been rapidly growing internationally. Expanding on the earlier review of Julien et al. (Reference Julien, Richard, Gauvin and Kestens2012), this paper systematically reviewed the literature to date to identify neighborhood social and physical environmental correlates of depression and depressive symptoms, with the aim of informing future directions in the field. To address the somewhat subjective nature of interpretation of findings from systematic reviews, we also statistically quantified the strength of evidence by incorporating a recently-developed meta-analytic approach considering article quality, sample size information, as well as moderators of associations where appropriate (Cerin et al., Reference Cerin, Nathan, van Cauwenberg, Barnett and Barnett2017).
Methods
Search strategy, article selection, and inclusion/exclusion criteria
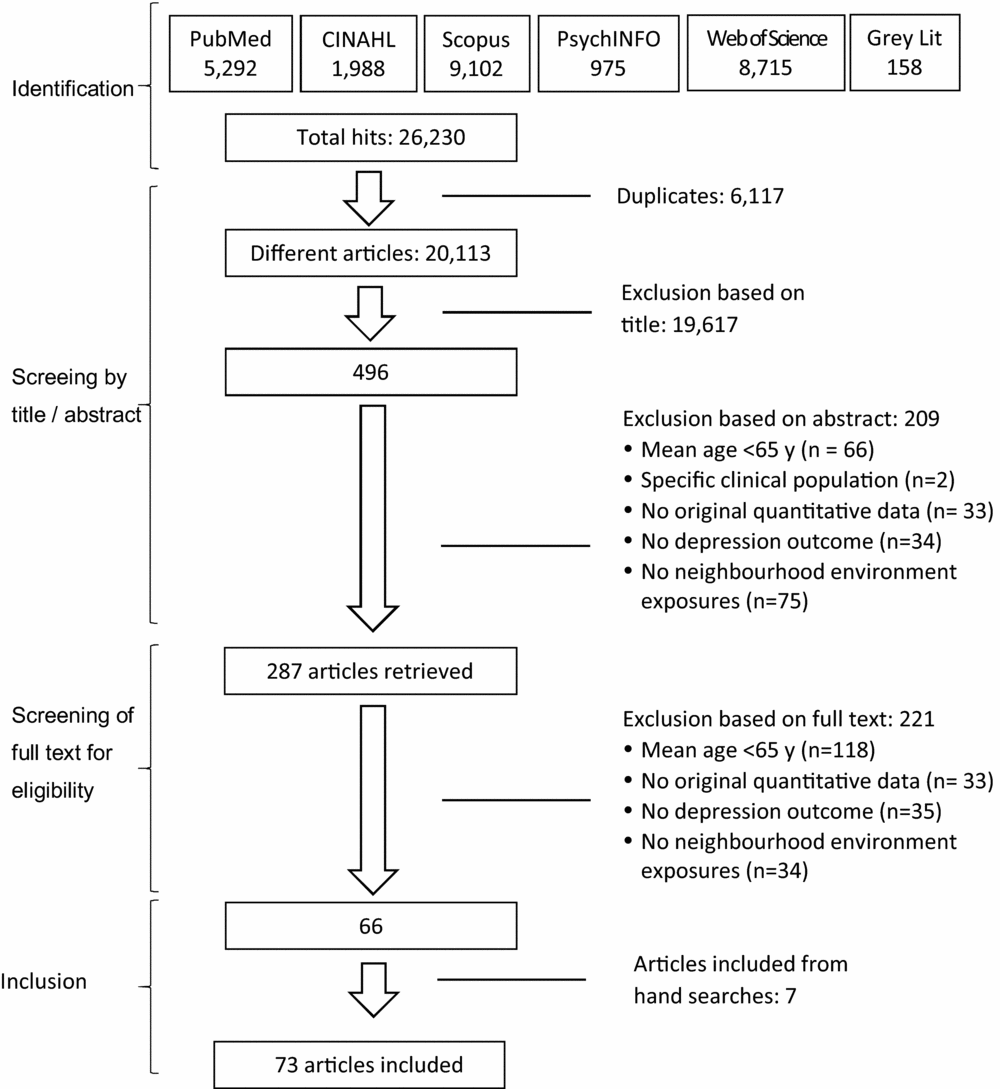
Systematic searches of CINAHL, PubMed, Scopus, PsychINFO, and Web of Science databases were undertaken using combinations of keywords as listed under Figure 1. Database filters applied varied based on options available in the database. The searches were limited to articles published between 1 January 1900 (or later if limited by the database) and 4 January 2017. Potential sources of grey literature (New York Academy of Medicine, Grey Open, Active Living Research) were also searched using depression as the search term. Relevant extant reviews, reference lists of selected articles and authors’ personal archives were manually screened.
Systematic review PRISMA flow chart. Search terms with filters used in PubMed (filter options vary across databases; search terms with filters for all databases are available in Table S5: (environment OR environmental OR built OR neighborhood* OR neighborhood* OR neighbors OR neighbors OR county OR counties OR “built form” OR urban OR facilit* OR walkability OR aesthetics OR safety OR parks OR parkland OR “green space” OR “green spaces” OR greenness OR “physical attributes” OR “physical characteristics” OR “built environment” OR equipment OR “open space”) AND (mental OR “mental health” OR “psychological health” OR depression OR depressive) AND (old* OR elder* OR aged OR aging OR senior* OR pensioner* OR geriatric*) NOT (intervention OR comment OR disabled OR patients OR institutionalized) Filters: Language: English; Date; 01/01/1900 to 31/12/2017; Article type: books and documents, case reports, congresses, government publications, journal article, meta-analysis, observational study, review, systematic reviews, technical report; Text availability: abstract. Species: human; Search fields: Title/Abstract.

Two reviewers independently screened article titles and abstracts for further consideration, and verified each other's work. Any discrepancies were resolved by discussion with a third reviewer. The full text of remaining articles was screened for eligibility using the procedure above. Articles were included if: (1) the sample population or an analyzed subsample had a mean age of ≥65 years, and (2) the association between any objective or perceived attribute of the neighborhood physical or social environment and a depression outcome was quantitatively investigated. We also included studies examining differences in depression outcomes between urban and rural areas, as they represent distinctly different neighborhood environments. Articles were excluded if they (1) solely examined associations of depression using a composite measure combining various poorly correlated aspects of the neighborhood environment, for example, “collective efficacy” and “adequacy of facilities and services,” (2) exclusively focused on a specific clinical population (i.e. only disabled or institutionalized participants), or (3) included hospitalized participants. The systematic literature search, following PRISMA guidelines, is depicted in Figure 1. We also conducted a “Title, Abstract, and Keywords” search of the Cochrane Database of Systematic Reviews using the word “depression.” No relevant reviews were found.
Data extraction, validity assessment, and categorization
From each article, we extracted the following: (1) name of study which the analyzed data was from, if applicable, (2) first author and publication year, (3) sample characteristics (total sample size; urban, rural or mixed sample; age; gender; response rate or proof of representativeness of sample; community dwellers or not; geographical location, ethnicity), (4) study design (cross-sectional, longitudinal or experimental; sampling method for clusters and individuals; stratification by environment attributes; neighborhood definition), (5) covariates included in the analysis, (6) outcome measures (depression outcome; instrument; validity; and continuous/categorical outcome), (7) environmental exposure variables (environmental variables, their type (objective or subjective) and, to assist compilation of the summary table, their classification into environmental categories), (8) moderators, (9) analytical approach (analytical approach; adjustment for clustering; appropriateness (distributional assumptions; moderation analyses) and presentation), (10) findings (main effects or moderating effects), (11) comments important for the assessment or interpretation of the study.
Environmental variables were categorized based on their description in the article. Information on the generic (in red) and associated article-specific variable (highlighted in yellow) definitions for each article are available in the findings column of (Table S1, available as supplementary material attached to the electronic version of this paper at www.journals.cambridge.org/jid_IPG). Depression outcomes were categorized as depressive symptoms (continuous outcome), possible depression (categorical outcome), or clinical depression (clinically based diagnosis). Due to the wide range of categorical cut points used within instruments gauging depression outcomes, to be conservative, we used the term possible rather than probable depression.
Coding and quantification of associations
Environmental variable – depression outcome associations were categorized as statistically significantly positive (P), significantly negative (N), or not statistically significant (Ø). Where articles presented multiple regression models, preference was given to associations adjusted for socio-demographics and residential self-selection, but not other environmental factors. If single articles had more than one distinct environmental variable falling in the same category (e.g. SES), they could contribute more than one association to a specific combination of environmental attribute and depression outcome.
Environmental variable – depression outcome associations that were moderated by another variable were reported as main effects if the associations across all examined values of the moderator were consistent in direction and statistical significance. When not, associations at each examined level of the moderator were given proportional fractional weights, with the sum of all weights totaling 1. For example, Gerst et al. (Reference Gerst, Miranda, Eschbach, Sheffield, Peek and Markides2011) found a negative association between social/demographic heterogeneity and depressive symptoms in Mexican American males, but not in females. As 38% of the samples were males, the negative association was given a weighting of 0.38, while the nil association in women was given a weighting of 0.62. For continuous moderators, a weight of 0.60 was given to associations computed at the average value of the moderator, and a weight of 0.20 was given to values of the moderator at 1 standard deviation above or below the mean, as suggested by Cerin and colleagues (Reference Cerin, Nathan, van Cauwenberg, Barnett and Barnett2017). While these weighting methods were used to estimate environmental variable – depression outcome main effects, moderators of associations were examined in separate analyses.
Quality and sample size assessment
Ten criteria were used to assess article quality. These were (1) study design; (2) recruitment stratification by key environmental attributes to maximize variability in exposures and outcomes (Cerin et al., Reference Cerin, Sit, Cheung, Ho, Lee and Chan2010; Kerr et al., Reference Kerr2013); (3) response rate ≥60% or sample shown to be representative of the population to assess risk of selection bias (Ogilvie et al., Reference Ogilvie2007); (4) depression outcome shown to be valid or commonly used (Ogilvie et al., Reference Ogilvie2007); (5) adjustment for socio-demographic covariates (at least age, gender, education, or similar) to account for confounding (Ogilvie et al., Reference Ogilvie2007); (6) adjustment for bias associated with residential self-selection (Ewing and Cervero, Reference Ewing and Cervero2010); (7) analysis accounting for clustering (if needed) (Cerin Reference Cerin2011); (8) analytical approach appropriately accounting for distributional assumptions; (9) analyses conducted and presented correctly (e.g. formal testing of moderators; presentation of point estimates, and p values, 95% CIs); (10) did not (inappropriately) categorize continuous environmental exposures (Lamb and White, Reference Lamb and White2015). Item 1 was assigned a score out of 3 (cross-sectional = 0, longitudinal = 1, quasi-experimental = 2), items 2–6 and 10 a score of 1 and, to avoid overstating the importance of statistical issues relative to other methodological aspects, 7–9 a score of 1/3 each. Scores were summed to obtain a study quality score ranging from 0 to 9. Studies with scores in the range of less than 4.5 were considered to be low quality, 4.5–6.9 moderate quality, and 7–9 high quality.
Stratification by key environmental variables was used as a study quality criterion because this type of sampling maximizes the variance in the environmental variables of interest and thus allows more accurate quantification of dose-response relationships between neighborhood attributes and depression outcomes. For example, stratification by area-level SES is needed to assess relationships between area-level SES and related attributes (personal/crime-related safety, neighborhood disorder/problems); stratification by urban/rural is needed to assess relationships between urbanization and population residential density with the outcomes; stratification by area-level race/ethnicity facilitates assessment of relationships between perceived social cohesion and depressive outcomes; stratification by dwelling density would increase variability in destination density or accessibility.
A score for sample size was assigned for each study using the following weights: 0.25 for a sample of ≤100 participants; 0.50 for 101–300 participants; 1.00 for 301–500 participants; 1.25 for 501–1,000 participants; 1.50 for 1,001–2,500 participants; and 1.75 >2,500 participants. Studies with 301–500 participants were given a weighting of 1.00 as this sample size is adequate to examine small-to-moderate associations (based on sample size calculations) (Cerin et al., Reference Cerin, Sit, Cheung, Ho, Lee and Chan2010). Capping of sample size categories at 2,501 + participants was based on the ability to detect a very small effect equivalent to 1% of outcome variance explained even in the presence of a substantial residual clustering effect (intra-class correlation of 0.10) (Cerin et al., Reference Cerin, Nathan, van Cauwenberg, Barnett and Barnett2017).
Data synthesis
Findings were summarized by the number of positive, negative, and statistically non-significant associations by each combination of environmental attribute – depression outcome. Associations were also compiled for all depression outcomes combined to provide a general conclusion of neighborhood environmental attribute associations with depression. To provide an objective interpretation of the findings, we used a meta-analytic approach (Cerin et al., Reference Cerin, Nathan, van Cauwenberg, Barnett and Barnett2017) to derive conservative estimates of p values for each environment variable – depression outcome combination, accounting for sample size, and study quality scores. Specific environment variable-depression outcome combinations had to be examined at least five times to be considered sufficiently studied (Higgins et al., Reference Higgins, Thompson and Spiegelhalter2009). Furthermore, if there were ≥3 studies reporting objective and ≥3 reporting perceived measures for the same environmental attribute and depression outcome, analyses by type of environmental measure (objective or perceived) were also conducted. Three sets of sensitivity analyses were also undertaken to assess the impact of the weighting method on the results of the meta-analyses. Specifically, we also conducted meta-analyses weighted for sample size scores only, quality scores only, and with no weighting. Two-tailed p values < 0.01were considered to represent strong evidence and p values <0.001 very strong evidence of associations (Bland, Reference Bland2000).
In the meta-analysis, we first assigned positive associations a z-value of 1.96 (just significant at a p level of 0.05), statistically non-significant associations a z-value of 0 and negative associations a z-value of –1.96. Exact z-values reported in articles were not used because the measures were too diverse to carry out a traditional meta-analysis with accurate estimation and averaging of effect sizes. By assigning the minimal z-value to each significant finding, the above approach underestimated the strength of associations in the majority of cases. Therefore, the conclusions reported in this review are conservative. We obtained a summary weighted z-value and the associated two-tailed p value for each combination of neighborhood environmental attribute and depression outcome by computing a summary two-tailed p value (Rosenthal, Reference Rosenthal1980). The summary weighted z-value was derived using the following formula:
 $$\begin{eqnarray*}
&& {\rm{Weighted}}\ Z = \ \frac{{\mathop \sum {\rm{weight}_{j}}{z_{j}}}}{{\sqrt {\mathop \sum {\rm{weight^{2}_{j}}}}}},\\
&& \qquad {\rm{where}}\;\text{`}j\text{'}\;{\rm{stands}}\;{\rm{for}}\;{\rm{finding}}\;\text{`}j\text{'}.
\end{eqnarray*}$$
Results
Following exclusion by title and abstract, the full text of 287 of the identified 20,113 articles were screened, with 66 meeting inclusion criteria. A further seven articles were identified via hand searches resulting in 73 articles for review (Figure 1).
Characteristics of selected articles
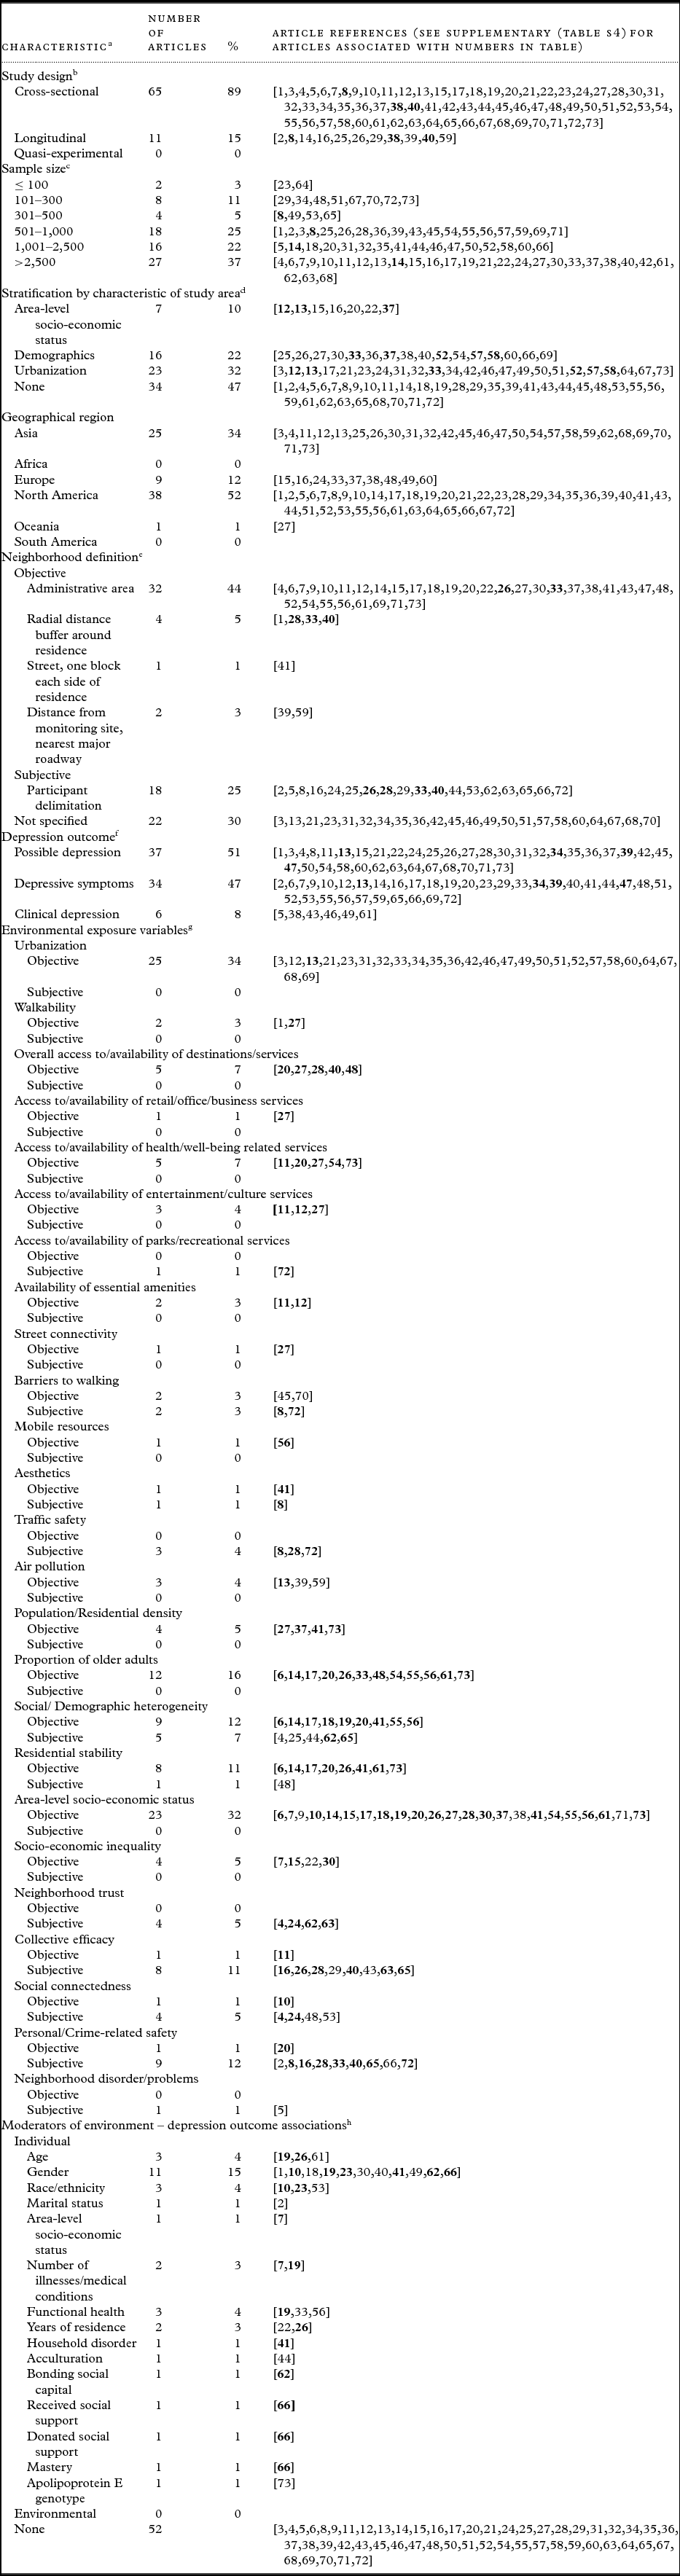
Characteristics of the included articles are summarized in Table 1 (detailed characteristics of each article in Table S1). For the purpose of this review, the term “project” refers to a distinct set of data collected in a scientific project, “article” refers to a published journal article based on data collected in a project (multiple articles can be based on the same project) and “study” refers to a distinct analysis presented in an article (an article may present multiple studies). Nine projects contributed from two to four articles to the review, with the remaining 52 articles based on data from 52 different projects. All neighborhood environment attribute associations with depression outcomes from the same project represented original analyses. Sixty-two articles reported cross-sectional, eight longitudinal, and three both cross-sectional and longitudinal studies. No quasi-experimental studies were found. Sample sizes ranged from 84 (Clayton et al., Reference Clayton1994) to 77,930 (Menec et al., Reference Menec, Shooshtari, Nowicki and Fournier2010) participants. Only 10 studies (14%) had 300 or fewer participants (considered to be a small sample size), whereas 37% had sample sizes >2,500, allowing detection of very small effects. Nine studies examined participants from minority race/ethnic groups (Okwumabua et al., Reference Okwumabua, Baker, Wong and Pilgram1997; Curyto et al., Reference Curyto, Chapleskim, Lichtenberg, Hodges, Kaczynski and Sobeck1998; Ostir et al., Reference Ostir, Eschbach, Markides and Goodwin2003; Brown et al., Reference Brown2009; Gerst et al., Reference Gerst, Miranda, Eschbach, Sheffield, Peek and Markides2011; Roh et al., Reference Roh, Jang, Chiriboga, Kwag, Cho and Bernstein2011; Kwag et al., Reference Kwag, Jang and Chiriboga2012; Kim et al., Reference Kim, Auh, Lee and Ahn2013; Hernandez et al., Reference Hernandez, Kershaw, Prohaska, Wang, Marquez and Sarkisian2015) and three were gender specific (Wilcox et al., Reference Wilcox, Bopp, Oberrecht, Kammermann and McElmurray2003; Saarloos et al., Reference Saarloos, Alfonso, Giles-Corti, Middleton and Almeida2011; Tanaka et al., Reference Tanaka, Tanaka, Suyama, Honda, Senjyu and Kozu2016).
Characteristics of included articles (N = 73)

Notes: aSome articles have more than one measure within category; hence the sum of the sub-categories may be greater than the number of articles and the sum of the percentages above 100%. These articles are represented in bold in the relevant category. bThree articles (in bold) reported both cross-sectional and longitudinal studies. cTwo articles (in bold) had two studies with different sample sizes. dSeven articles (in bold) stratified by characteristics from more than one category. eFour articles (in bold) used neighborhood definitions from more than one category. fFour articles (in bold) had more than one depression outcome. gThirty-four articles (in bold) examined environmental exposure variables from more than one category. hEight articles (in bold) examined the effect of more than one moderator.
A total of 96% of the scales used to determine possible depression and depressive symptoms were known to be validated. Depressive symptoms were operationalized as a continuous outcome (total score on a depression scale), while possible depression was operationalized as a dichotomous outcome (yes; no) based on validated cut-off values for specific depression scales. Clinical depression was determined using clinical assessments, diagnoses and/or hospitalization records. Possible depression was the outcome most frequently studied (51% articles), followed by depressive symptoms (47% articles), and then clinical depression (8% articles). The majority of articles focusing on non-clinical depression outcomes used one of the versions of the Center for Epidemiologic Studies Depression Scale (CES-D) or the Geriatric Depression Scale (GDS), with the most common being the GDS-15 (20 articles) and the 20-item CES-D (19 articles).
Participant recruitment in 39 articles was based on stratification by environmental attributes, with seven using more than one type of stratification. For example, Li et al. (Reference Li, Liu, Xu and Zhang2016) stratified by urbanization and gross domestic product. Urbanization was the most commonly used stratification variable (32%), followed by demographics (22%) and area-level SES (10%). Thirty-four studies did not use a stratified sampling strategy. Most articles reported findings from North American populations (52%), followed by Asian (34%) and European (12%), with only one study from Oceania and none from Africa and South America. Neighborhoods were most frequently defined objectively by administrative area (44%) or subjectively by participants (25%), while 22 studies (30%) did not define the study neighborhood.
Urbanization (25 articles, 34%) and SES (23 articles, 32%) were the most extensively examined neighborhood environment attributes. Other articles investigated environmental characteristics included social/demographic heterogeneity (19%), proportion of older adults (16%), personal/crime-related safety (13%), residential stability (12%), and collective efficacy (12%). All studied environment attributes are presented in Table 1.
The effects of a variety of individual moderators on neighborhood environmental associations with depression were examined in 21 articles, with moderation by gender (15%) the most frequently assessed. Effects of environmental moderators were not tested in any of the 73 articles.
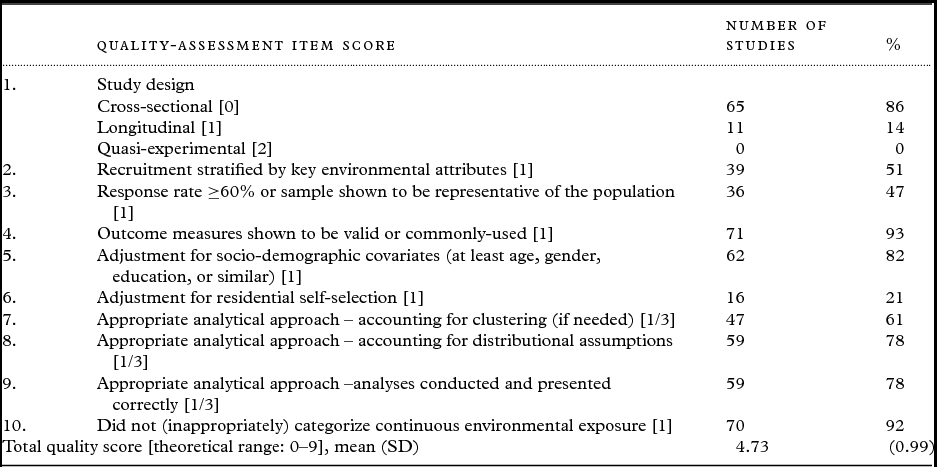
Quality assessment of included articles
A summary of quality assessment item scores is presented in Table 2. The mean total quality score was 4.73 (SD = 0.99). No studies were deemed to be of high quality with regard to assessment of associations between environmental attributes and depression outcomes, while 48 were considered of moderate quality. Most studies used a cross-sectional design. Approximately half of the studies did not stratify the sample by key environmental attributes and less than half had recruitment response rates deemed appropriate, i.e. ≥60%. Other relatively frequent methodological problems found in the reviewed studies were related to the use of inappropriate analytical approaches (22–39%) and the failure to account for residential self-selection bias. Valid outcome measures were used in 93% of the studies and 82% adjusted for socio-demographic covariates. Detailed quality assessments of each article, including a quality score, are available in Table S2.
Summary of article quality assessment (N = 76 studies in 73 articles)a

aAs three of the 73 articles had two study designs, there were 76 studies assessed for quality.
Associations of neighborhood environmental characteristics with depression outcomes
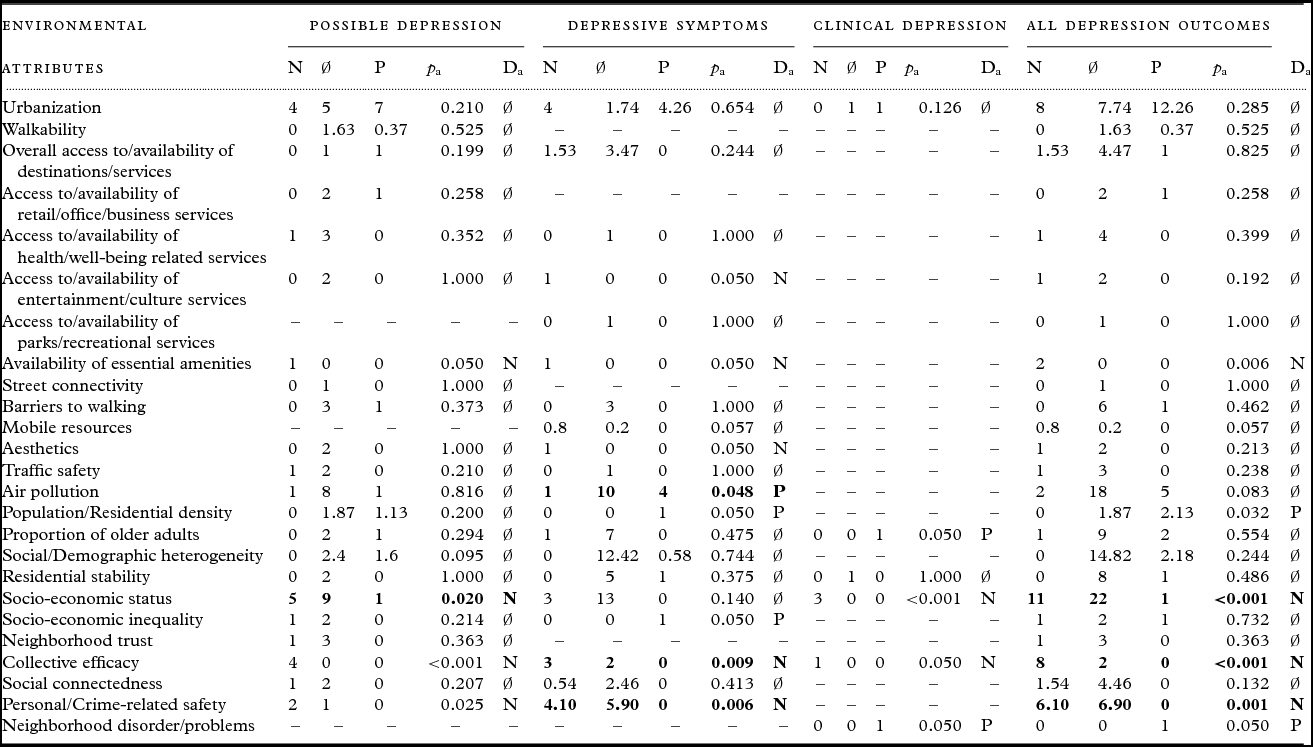
Table 3 summarizes the fully adjusted (accounting for sample size and study quality) associations of neighborhood characteristics with each depression outcome and all depressive outcomes combined. These associations are described below.
Summary of associations of neighborhood environmental correlates with depression outcomes in older adults

Notes: N = negative association; ∅ = null association; P = positive association; p = p value; D = direction of associations supported by the data; subscript ‘a’ = fully adjusted (for sample size and article quality). In bold: statistically significant evidence of associations when 5+ findings reported on specific combinations of environment - depression outcomes.
Only three environmental attributes were sufficiently studied (≥5 times) in association with possible depression. Based on 15 findings, SES was negatively related to possible depression (p = 0.02). Of the environmental correlates with fewer than five findings, we found very strong evidence of a negative relationships of possible depression with collective efficacy (p < 0.001) and some evidence of a negative association with personal/crime-related safety (p = 0.025). Availability of essential amenities was negatively associated with possible depression in a single study. Insufficient evidence of associations was found for the remaining 19 environmental characteristics.
For depressive symptoms, there was strong evidence of a negative association with collective efficacy (p = 0.009) based on five findings and personal/crime-related safety (p = 0.006) based on ten findings. Air pollution tended to be positively associated with depressive symptoms (p = 0.048). Insufficient evidence of associations was found for the other six correlates with five or more findings. The majority of the other correlates had only one finding.
Among the eight studies measuring clinical depression as an outcome variable, only SES was examined more than once. All three reported associations with SES were negative (p < 0.001).
When all three depression outcomes were combined, very strong evidence (p < 0.001) of negative associations was found for SES (34 findings) and collective efficacy (10 findings), while strong evidence (p = 0.001) was found for personal/crime-related safety (13 findings). For those studies with fewer than five findings, population/residential density and availability of essential amenities were, respectively, positively and negatively associated with all depression outcomes combined. The other 19 neighborhood characteristics, nine of which were sufficiently studied, were not associated with all three depression outcomes combined. With one exception, patterns of relationships for the three depression outcomes and all depression outcomes combined remained the same in meta-analyses adjusted only for sample size or article quality, or unadjusted. The association between air pollution and depressive symptoms remained positive when adjusted only for article quality, but not for sample size or when unadjusted (Table S3).
Moderators of associations of neighborhood environmental characteristics with depression outcomes
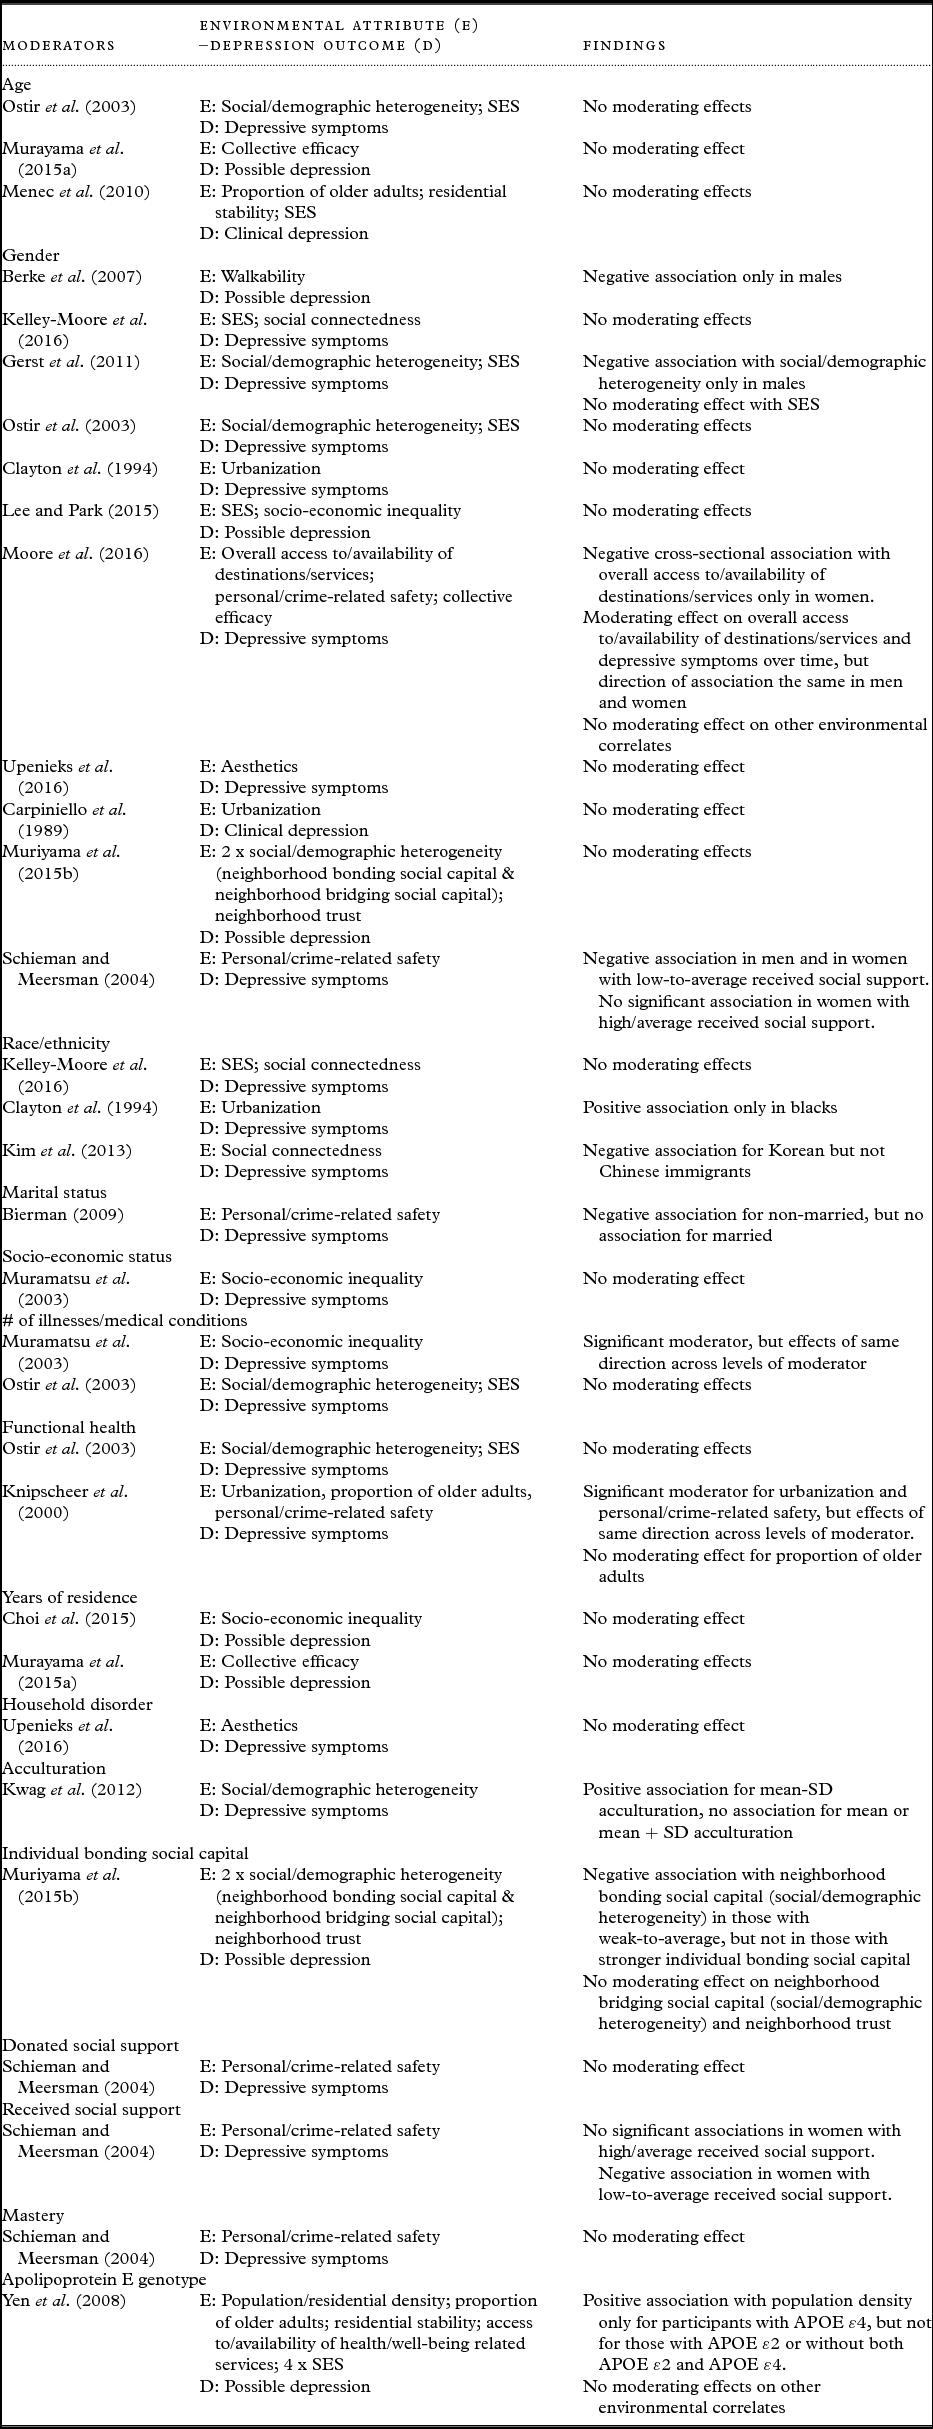
Of the 57 moderating effects examined, 33 were associated with studies of depressive symptoms, 20 with possible depression, and four with clinical depression (Table 4). Nine of the 15 moderators were only studied in single articles (Muramatsu, Reference Muramatsu2003; Schieman and Meersman, Reference Schieman and Meersman2004; Bierman, Reference Bierman2009; Yen et al., Reference Yen, Rebok, Yang and Lung2008; Kwag et al., Reference Kwag, Jang and Chiriboga2012; Murayama et al., Reference Murayama2015b; Upenieks et al., Reference Upenieks, Schafer and Iveniuk2016). Of the 73 articles, 52 did not examine any moderating effects.
Moderators of environmental correlates of depression outcomes in older adults

The moderating effects of gender on relationships between environmental characteristics and depression outcomes were studied in 11 articles. Cross-sectional studies found significant negative associations for walkability in men (Berke et al., Reference Berke, Gottlieb, Moudon and Larson2007) and for overall access to/availability of destinations/services in women only (Moore et al., Reference Moore, Hirsch, August, Mair, Sanchez and Diez Roux2016). While a study of Mexican-Americans observed a significant negative association for social/demographic heterogeneity in men only (Gerst et al., Reference Gerst, Miranda, Eschbach, Sheffield, Peek and Markides2011), another found no moderating effect of gender (Ostir et al., Reference Ostir, Eschbach, Markides and Goodwin2003), as did a study of Japanese (Murayama., Reference Murayama2015b). A longitudinal study found a moderating effect of gender on overall access to/availability of destinations/services and depressive symptoms over time, but the direction of association were the same (Moore et al., Reference Moore, Hirsch, August, Mair, Sanchez and Diez Roux2016). No moderating effects of gender were found for the environmental correlates SES (Ostir et al., Reference Ostir, Eschbach, Markides and Goodwin2003; Gerst et al., Reference Gerst, Miranda, Eschbach, Sheffield, Peek and Markides2011; Lee and Park, Reference Lee and Park2015; Kelley-Moore et al., Reference Kelley-Moore, Cagney, Skarupski, Everson-Rose and Mendes de Leon2016), urbanization (Carpiniello et al., Reference Carpiniello, Carta and Rudas1989; Clayton et al., Reference Clayton1994), social connectedness (Kelley-Moore et al., Reference Kelley-Moore, Cagney, Skarupski, Everson-Rose and Mendes de Leon2016), socio-economic inequality (Lee and Park, Reference Lee and Park2015), overall access to/availability of destinations/services (Moore et al., Reference Moore, Hirsch, August, Mair, Sanchez and Diez Roux2016), personal/crime-related safety (Moore et al., Reference Moore, Hirsch, August, Mair, Sanchez and Diez Roux2016), collective efficacy (Moore et al., Reference Moore, Hirsch, August, Mair, Sanchez and Diez Roux2016) and aesthetics (Upenieks et al., Reference Upenieks, Schafer and Iveniuk2016). A US study examining three-way interaction effects of gender by received social support by environmental attributes found a negative effect of personal/crime related safety on depressive symptoms in males and in females with low, but not average-to-high received social support (Schieman and Meersman, Reference Schieman and Meersman2004).
The three articles that examined moderation by age (Ostir et al., Reference Ostir, Eschbach, Markides and Goodwin2003; Menec et al., Reference Menec, Shooshtari, Nowicki and Fournier2010; Murayama et al., Reference Murayama2015a) found no moderating effect on all assessed environment attribute – depression outcome associations, including SES, residential stability, social/demographic heterogeneity, collective efficacy, and proportion of older adults environmental attributes. Associations between social connectedness and depressive symptoms were negative for Korean, but not Chinese, immigrants in Los Angeles County (Kim et al., Reference Kim, Auh, Lee and Ahn2013), whereas there was no moderating effect of race/ethnicity (black/non-black) on this association in Chicago community dwellers (Kelley-Moore et al., Reference Kelley-Moore, Cagney, Skarupski, Everson-Rose and Mendes de Leon2016). A positive association between urbanization and depressive symptoms was found in black, but not white, centenarians in Georgia (Clayton et al., Reference Clayton1994).
Discussion
This systematic review and meta-analysis synthesized findings from studies on neighborhood environmental correlates of depression outcomes. Despite a large increase in number of articles evaluated (73 articles, 49 examining environmental attributes other than urbanization) in comparison to the previous review on this topic (19 articles; studies examining only urbanization were excluded) (Julien et al., Reference Julien, Richard, Gauvin and Kestens2012), the number of studies examining specific environmental attributes was small. Of the 25 environmental attributes reviewed, only 12 were sufficiently studied, i.e. examined in five or more studies (Higgins et al., Reference Higgins, Thompson and Spiegelhalter2009). This indicates that there is still a dearth of information on neighborhood environmental determinants of depression in older adults. This trend is at odds with the acknowledged importance of creating age-friendly communities promoting health and well-being in ageing populations, and with population ageing and urbanization being identified by the WHO as major forces shaping the 21st century (WHO, 2007). The lack of sufficient evidence was manifest for physical environment-specific attributes, with 10 of the 14 correlates investigated by fewer than five studies. This is despite the physical environment being associated with higher levels of physical (Cerin et al., Reference Cerin, Nathan, van Cauwenberg, Barnett and Barnett2017) and social activities (Bowling and Stafford, Reference Bowling and Stafford2007; Levasseur et al., Reference Levasseur, Gauvin, Richard, Kestens, Daniel and Payette2011), both of which have been shown to be protective factors for depression (Buffel et al., Reference Buffel, De Donder, Phillipson, Dury, De Witte and Verté2014; Schuch et al., Reference Schuch2016). In contrast to the physical environment, six of the eight social environment attributes were sufficiently studied. This is likely due to social factors being considered stronger, more proximal determinants of depression than physical factors (Gidlow et al., Reference Gidlow, Cochrane, Davey, Smith and Fairburn2010). Yet, physical attributes of the neighborhood environment, especially micro-scale attributes (e.g. provision of benches for sitting, well-maintained footpaths), are more amenable to change than social attributes (collective efficacy or neighborhood-level SES). Also, a change in these attributes may improve depression outcomes via their impact on physical activity (Cerin et al., Reference Cerin, Nathan, van Cauwenberg, Barnett and Barnett2017) as well as by providing more opportunities for social contacts (Bowling and Stafford, Reference Bowling and Stafford2007). Hence, the lack of information on the potential effects of neighborhood physical environmental attributes remains an important knowledge gap to be addressed in future studies.
We found very strong evidence of a negative association between area-level SES, the most-frequently assessed environmental attribute (34 findings, Table 3), and depression outcomes. Longitudinal studies reported two negative (Wilson et al., Reference Wilson, Chen, Taylor, McCracken and Copeland1999; Murayama et al., Reference Murayama2015a) and two null (Wight et al., Reference Wight, Cummings, Karlamangla and Aneshensel2009) findings. Neighborhood SES is thought to impact on depressive symptoms through modulating the exposure to environmental stressors (e.g. crime) and the availability of physical and social resources (Kubzansky et al., Reference Kubzansky, Subramanian, Kawachi, Fay, Soobader and Berkman2005). The only study to examine moderators of SES-depression associations, found no effect of socio-economic inequality on this relationship (Ostir et al., Reference Ostir, Eschbach, Markides and Goodwin2003). This review provides support for the notion that living in low SES neighborhoods may be an important contributor to depression in later life. Yet, the mechanisms through which this occurs and the factors that moderate the association remain unclear.
With eight negative and two null associations, very strong evidence of a negative association was also found between collective efficacy, defined as “perception of mutual trust and willingness to help each other” (Cohen et al., Reference Cohen, Inagami and Finch2008) and depression outcomes. The majority of these studies used self-report measures of collective efficacy. This implies a risk of reverse causality in cross-sectional associations was likely, whereby participants’ depressive mood may affect their perceptions of these environmental exposures (Oakes, Reference Oakes2004). However, of the four longitudinal studies assessing the temporality of the association between collective efficacy and depression outcomes, three found a negative relationship (Brown et al., Reference Brown2009; Stafford et al., Reference Stafford, McMunn and De Vogli2011; Murayama et al., Reference Murayama2015a) and one no relationship (Moore et al., Reference Moore, Hirsch, August, Mair, Sanchez and Diez Roux2016), suggesting the absence of reverse causality and supporting the notion that higher neighborhood collective efficacy may reduce the risk of depression. As previously shown in adults (Herrero and Gracia, Reference Herrero and Gracia2007), Brown et al. (Reference Brown2009) found a cross-lagged effect of collective efficacy on depression in Hispanic older adults, but no significant cross-lagged effect of depression on collective efficacy, indicating an absence of reverse causality. Only two studies tested the influence of socio-demographic moderators on the associations between collective efficacy and depression and found no effects of age, gender, or years of residence (Murayama et al., Reference Murayama2015a; Moore et al., Reference Moore, Hirsch, August, Mair, Sanchez and Diez Roux2016). Neighborhood collective efficacy may be associated with lower levels of depression due to a buffering effect on the relationship between stress and depression (Murayama et al., Reference Murayama2015a). It may also affect depression via facilitation of healthier behaviors and improvements in health-related local services and amenities, and generation of individual efficacy within the neighborhood (Kim, Reference Kim2008).
The only other sufficiently studied environment attribute associated with depression was personal/crime-related safety, for which we found strong support for a negative relationship. While neighborhood SES and collective efficacy are social environment attributes, measures of personal/crime-related safety can comprise a range of physical and/or social characteristics (Knipscheer et al., Reference Knipscheer, Broese van Groenou, Leene, Beekman and Deeg2000; Saelens et al., Reference Saelens, Sallis, Black and Chen2002; Kubzansky et al., Reference Kubzansky, Subramanian, Kawachi, Fay, Soobader and Berkman2005). This results in a wide range of diverse measures of this attribute across studies. As for collective efficacy, the majority of these studies used self-report measures of personal/crime-related safety, implying a risk of reverse causality in cross-sectional associations was likely (Oakes, Reference Oakes2004). Only three studies assessed personal/crime-related safety – depression associations longitudinally. Bierman (Reference Bierman2009) found a negative association and Moore et al. (Reference Moore, Hirsch, August, Mair, Sanchez and Diez Roux2016) no association. In their longitudinal analysis, Hernadez et al. (Reference Hernandez, Kershaw, Prohaska, Wang, Marquez and Sarkisian2015) noted that the point estimate of the regression coefficient was very similar to that seem in the cross-sectional analysis and suggestive of a negative association with a wide confidence interval marginally crossing the null estimate, possibly due to a relatively small sample size and only 19 cases of incident depression. A potential limitation of this study was the cohort of participants having been recruited for a randomized controlled trial, engagement in which may have influenced the longitudinal outcomes (Hernadez et al., Reference Hernandez, Kershaw, Prohaska, Wang, Marquez and Sarkisian2015).
Six moderators of personal/crime-related safety-depression associations were studied once each. While gender, donated social support, mastery, and functional health were found to have no moderating effect (Knipscheer et al., Reference Knipscheer, Broese van Groenou, Leene, Beekman and Deeg2000; Schieman and Meersman, Reference Schieman and Meersman2004; Moore et al., Reference Moore, Hirsch, August, Mair, Sanchez and Diez Roux2016), marital status (Bierman, Reference Bierman2009), and the interaction of gender and received social support (Schieman and Meersman, Reference Schieman and Meersman2004) did, and are briefly discussed below. There are a number of possible mechanisms for the observed negative association between personal/crime-related safety and depression. First, safety concerns may increase stress (Booth et al., Reference Booth, Ayers and Marsiglia2012). Second, they may lead to isolation due to older adults spending more time at home, and, therefore, more likely to become depressed. An effect of isolation is supported to some extent by two studies showing that circumstances protecting against isolation moderate the association between personal/crime-related safety and depression. A longitudinal study (Bierman, Reference Bierman2009) found that marriage moderated the relationship of personal/crime-related safety with change in depression whereby negative associations were observed only in non-married participants. A cross-sectional study (Schieman and Meersman, Reference Schieman and Meersman2004) reported a negative association for old women with low-to-average, but not average-to-high social support. Isolation may also negatively affect health behaviors such as exercise and visits to medical practitioners (Roh et al., Reference Roh, Jang, Chiriboga, Kwag, Cho and Bernstein2011), both known to reduce depression (Gillies et al., Reference Gillies, Buykx, Parker and Hetrick2015; Schuch et al., Reference Schuch2016). In summary, research to date suggests efforts to ensure high levels of neighborhood safety should be encouraged as a population-level approach to reducing the prevalence of depression.
Urbanization was an extensively studied environmental attribute with the combined result of the 28 findings suggesting a null association with depression. However, a closer examination of the distribution of findings with over 20 significant associations (out of 28) indicates that urbanization is a likely important contributor to depression. However, the direction of its effect appears to depend on the geographical/cultural context studied. Different mechanisms of influence may act in different contexts yielding contrasting findings. Compared to their rural counterparts, highly urbanized areas tend to have lower levels of social involvement, smaller/weaker social networks (Greiner et al., Reference Greiner, Li, Kawachi, Hunt and Ahluwalia2004; Wanless et al., Reference Wanless, Mitchell and Wister2010), and higher levels of traffic noise (Korte and Grant, Reference Korte and Grant1980), crime and social isolation in relation to neighborhood deprivation (Buffel et al., Reference Buffel, Phillipson and Scharf2013). These factors negatively influence social behavior, increasing the risk of depression. Yet, urban areas differ and those with activity-friendly features (walkable neighborhoods) may enhance a sense of community (du Toit et al., Reference du Toit, Cerin, Leslie and Owen2007; Leyden, Reference Leyden2003) and protect residents from depression. Cultural factors, changes in socio-demographics, and differences in specific environmental characteristics may also be responsible for contrasting findings. Unfortunately, only one of the reviewed studies examined possible mechanisms responsible for differences in depressive symptoms between urban and rural areas via mediation analyses (Li et al., Reference Li, Liu, Xu and Zhang2016).
For the countries with three or more findings, only China showed consistent results, with all five urbanization–depression associations being negative (Li et al., Reference Li, Pang, Chen, Song, Zhang and Zheng2011; Su et al., Reference Su2012; Tian et al., Reference Tian, Chen, Zhu and Liu2015; Li et al., Reference Li, Liu, Xu and Zhang2016). Li et al. (Reference Li, Liu, Xu and Zhang2016) found that individual, household and neighborhood-level SES accounted for nearly 85% of the urban–rural differences in depressive symptoms, while other potential mediators, including healthcare access, health status, social support, and participation in social activities showed only minimal contributions. In contrast to China, USA, and South Korean studies reported a larger percentage of positive associations, suggesting urban areas may be associated with higher levels of depression in these countries (Clayton et al., Reference Clayton1994; Curyto et al., Reference Curyto, Chapleskim, Lichtenberg, Hodges, Kaczynski and Sobeck1998; Goins and Mitchell, Reference Goins and Mitchell1999; Kim et al., Reference Kim, Shin, Yoon and Stewart2002; Schulman et al., Reference Schulman, Gairola, Kuder and McCulloch2002; Kim et al., Reference Kim, Stewart, Shin, Yoon and Lee2004; Evans, Reference Evans2009; Park et al., Reference Park2012). However, two of the positive associations reported by USA studies were related to American Indian older adults who may have cultural-specific reasons for exhibiting higher levels of depression when living in urban areas (Curyto et al., Reference Curyto, Chapleskim, Lichtenberg, Hodges, Kaczynski and Sobeck1998). These influences may include isolation from families, tribes, and connections with land and becoming acculturated into urban lifestyles (Curyto et al., Reference Curyto, Chapleskim, Lichtenberg, Hodges, Kaczynski and Sobeck1998).
Only a few studies examined moderators of urbanization–depression associations. A study based in the USA found a moderating effect of race/ethnicity on urbanization in a small sample of centenarians, with a positive association in blacks but not whites (Clayton et al., Reference Clayton1994). This study and one other (Carpiniello et al., Reference Carpiniello, Carta and Rudas1989) found no moderating effect of gender. Another found functional health to be a significant moderator. Specifically, urbanization was more strongly positively associated with depressive symptoms in older adults with low levels of functional health (Knipscheer et al., Reference Knipscheer, Broese van Groenou, Leene, Beekman and Deeg2000).
Weaknesses of available evidence and avenues for future research
Due, in part, to many new articles and broader selection criteria, we reviewed 73 articles compared to the 19 included in the most recent previous review on the topic. Despite the greater number of articles, there is a noticeable lack of information on physical environmental attributes. In addition, more than half of the environmental attributes examined to date have not been sufficiently studied to draw robust conclusions. Also, from a global perspective, the distribution of studies was uneven. A total of 86% of the reviewed studies were undertaken in North America and Asia, compared with only one study in Oceania and none in South America and Africa (Table 1).
One of the main methodological weaknesses of the reviewed studies pertains to their cross-sectional nature, making them unable to determine the direction of effects. As well as depressive states possibly influencing perceptions of neighborhood characteristics, residential self-selection into neighborhoods is another potential source of reverse causality in studies examining the effects of the neighborhood environment on depression (Oaks, Reference Oakes2004). Specifically, it has been suggested that poor mental health may result in underemployment or unemployment which may, in turn, limit one's choice of residence to socio-economically disadvantaged areas typified by lower safety and resources (Aneshensel, Reference Aneshensel2009). Recent studies have, however, shown that residential self-selection yielded downward rather than upward biased associations between neighborhood SES and health outcomes (Grafova et al., Reference Grafova, Freedman, Lurie, Kumar and Rogowski2014; James et al., Reference James, Hart, Arcaya, Feskanich, Laden and Subramanian2015). Irrespective of the direction of bias, whenever possible, the use of modern statistical methods, such as instrumental variable analysis (Hernán and Robins, Reference Hernán and Robins2006) and the difference-in-difference method (Woolridge, Reference Woolridge2002), and or stronger research designs (e.g. quasi-experiments or prospective studies of movers) that can more robustly estimate potential causal effects between the neighborhood environment and depression is recommended (McCormack and Shiell, Reference McCormack and Shiell2011; Grafova et al., Reference Grafova, Freedman, Lurie, Kumar and Rogowski2014).
The majority of reviewed studies defined neighborhoods using administrative or statistical spatial boundaries (e.g. census units or postal districts) and operationalized neighborhood characteristics using readily available census-level data. Only four studies (Knipscheer et al., Reference Knipscheer, Broese van Groenou, Leene, Beekman and Deeg2000; Berke et al., Reference Berke, Gottlieb, Moudon and Larson2007; Ivey et al., Reference Ivey2015; Moore et al., Reference Moore, Hirsch, August, Mair, Sanchez and Diez Roux2016) defined neighborhoods as individual Geographic Information System-derived buffers around residential addresses. This type of individual-location neighborhood delineation yields more accurate, standardized, and comparable exposure measures than those based on administrative and statistical spatial boundaries (Adams et al., Reference Adams2014). The question still remains as to the most appropriate definition of neighborhood size in studying environmental influences on depression and related behaviors. Street-network buffers with radii ranging from 0.4 km to 1.0 km have been frequently used, with some evidence suggesting that smaller buffers may be more appropriate for older adults given their reduced physical capacity (Cerin et al., Reference Cerin2014). In this respect, it may be also helpful to define neighborhoods based on the distance that a specific person is capable of and willing to walk to from home, which is dependent on one's level of physical mobility and time budget (e.g. capacity and readiness to walk a certain distance from home) (Cerin et al., Reference Cerin, Nathan, van Cauwenberg, Barnett and Barnett2017). This approach would require the collection of mobility-related data (e.g. physical functionality) for neighborhood delineation purposes.
Over 50% of the reviewed articles did not report, or reported very low, response rates. This indicates sampling bias was a significant threat to reliability and validity of these findings (Fincham, Reference Fincham2008). In addition to reporting response rates, authors should provide information of the representativeness of the sample and any potential or identified pattern of selection bias. Most importantly, strategies for maximizing response and retention rates should be employed (Burton et al., Reference Burton2009). While the analytical approaches were generally acceptable, 29 studies did not account for the presence of clustering (i.e. participants recruited from a pre-selected sample of neighborhoods), thereby providing biased estimates of standard errors (Cerin, Reference Cerin2011). Other, but less frequent, unacceptable approaches included not properly accounting for distributional assumptions and not reporting exact, p values, standard errors or 95% confidence intervals of regression coefficients. Very few studies inappropriately categorized continuous environmental characteristics (Lamb and White, Reference Lamb and White2015).
Across articles a wide range of covariates were included with the majority adjusting for at least age and gender/sex. However, there was a noticeable lack of adjustment for some key individual risk factors for depression which may confound the associations between environmental exposures and depression. No articles adjusted for childhood adversity, shown to be associated with major adult depression (Kessler et al., Reference Kessler, Davis and Kendler1997), only one article adjusted for history of depression (Stafford et al., Reference Stafford, McMunn and De Vogli2011).
Also, two studies adjusted for current stressful events: illness or injury starting or worsening around assessment time (Ahern and Galea, Reference Ahern and Galea2011) and anticipated daily stressors (Murayama et al., Reference Murayama2015a). The adjustment for these risk factors for depression may increase the power to detect environment-depression outcomes due to the reduction in residual outcome variance. Future studies should include these covariates were possible.
Studies on environment-depression outcomes should also consider anti-depressant treatment as an indicator of depression because access to treatment may differ across neighborhoods. Ignoring this may yield biased estimates of associations. Only two studies considered the use of antidepressant medication. Participants on antidepressants in one study were classified as having depressive symptoms (Wang et al., Reference Wang2014) and, in the other; the CES-D score was adjusted using a non-parametric imputation (Moore et al., Reference Moore, Hirsch, August, Mair, Sanchez and Diez Roux2016).
The vast majority of studies did not examine individual-level moderators of associations and environmental moderators were not studied at all. Also, of the examined individual moderators, most were only studied once in relation to a specific environmental attribute. Similarly, very few studies examined potential mechanisms (mediators) responsible for the observed associations. Greater investigation of moderators and mediators would provide a better understanding of the influence of urban and rural environments on depression outcomes. For example, such may help explain the underlying mechanisms resulting in the large number of both negative and positive associations between urbanization and depression outcomes.
Strengths and weaknesses of systematic review and meta-analysis
Strengths of the review include undertaking a quantitative synthesis of selected articles using a conservative meta-analytic approach. We incorporated sample size and quality assessment information into the meta-analysis and sensitivity analyses their effect. To address possible publication bias, we searched both the published and grey literature for article selection, although no relevant grey literature was found. Limitations include not specifically looking at mediators of associations. The large variability in exposure measures of some environmental categories (e.g. personal/crime-related safety) may have limited the accuracy of quantified associations. The search for relevant articles was limited to work published in English, possibly leading to over-representation of studies from developed countries.
Conclusion
The outcomes of this review suggest public health interventions promoting high levels of collective efficacy and personal/crime-related safety and reducing socio-economic inequalities across neighborhoods may provide an effective, wide-reaching means of lowering the risk of depression, and depressive symptoms in older adults. We found a lack of studies examining associations between physical environment attributes and depression outcomes. As the physical environment is associated with physical and social activities, both of which have been shown to be protective factors for depression, further examination is warranted.
Conflict of interest
None.
Description of authors’ roles
A. Barnett, C. Zhang, and E. Cerin designed the study. E. Cerin conceptualized the review protocol and meta-analytic approach. A. Barnett and C. Zhang conducted all searches and screened for article eligibility. A. Barnett, C. Zhang, and E. Cerin analyzed the data from the selected articles and drafted the manuscript. All authors critically revised the manuscript for important intellectual content and approved the final version.
Acknowledgments
Ester Cerin is supported by an Australian Research Council Future Fellowship FT3 140100085. The funding body had no role no role in the design of the review, and meta-analysis, interpretation of the data, or writing of the manuscript.
Supplementary material
To view supplementary material for this article, please visit https://doi.org/10.1017/S104161021700271X