1 Introduction
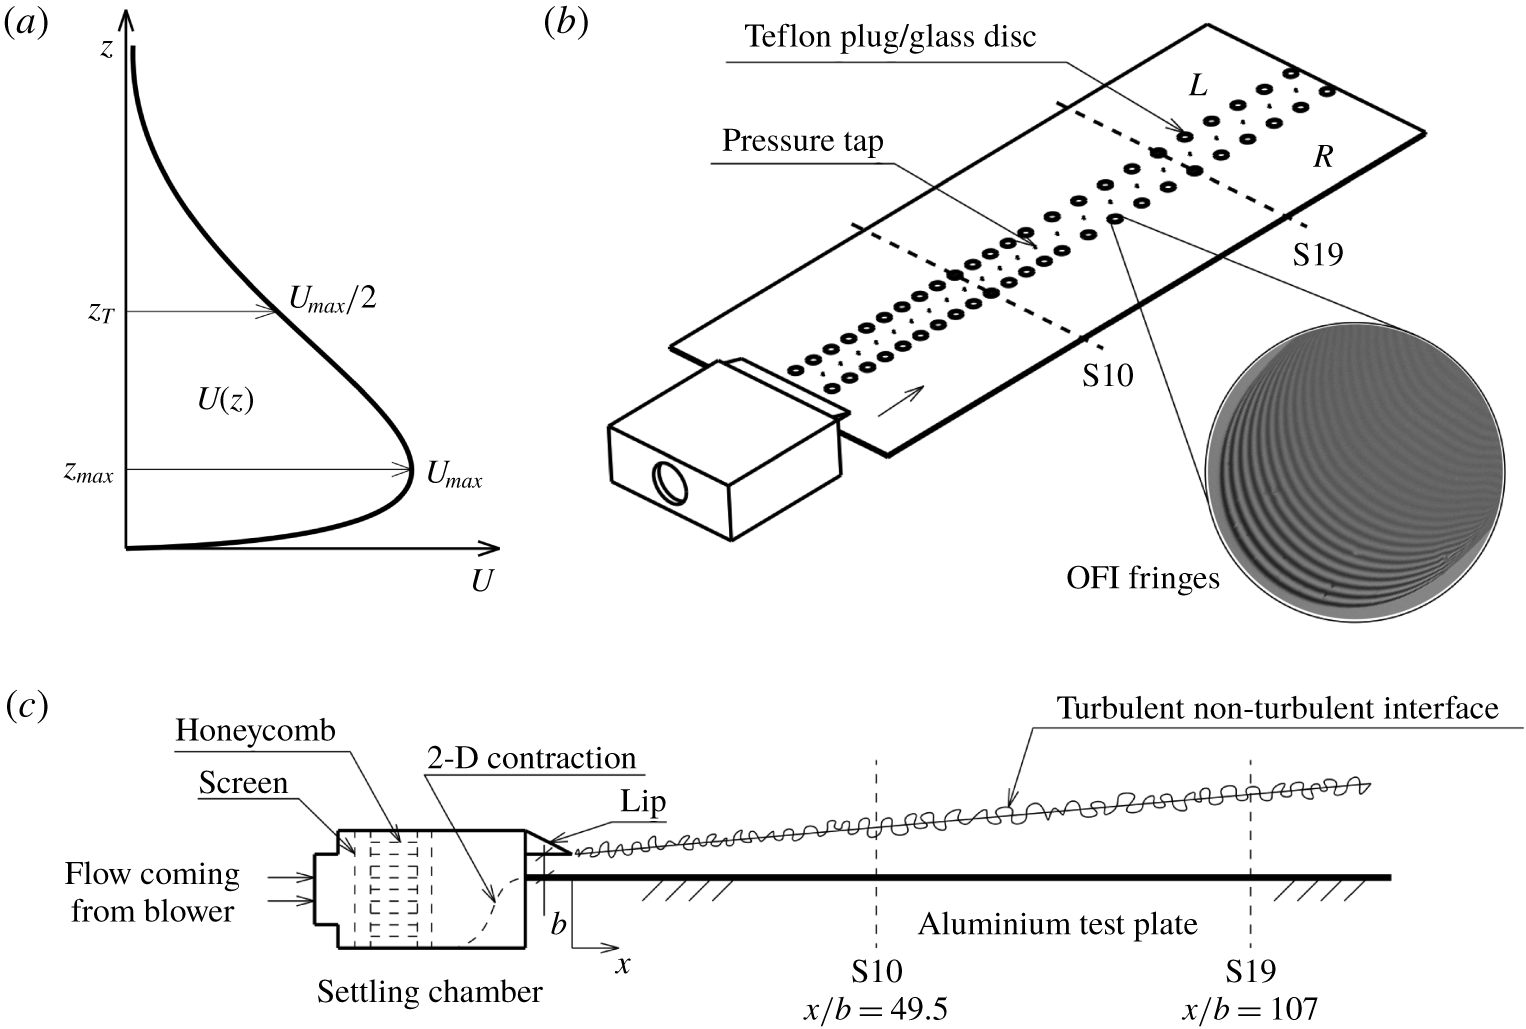
(a) Typical mean velocity profile in a turbulent wall jet with essential definitions. Schematic (b) isometric and (c) side views of the wall jet set-up at the Fluid Dynamics Laboratory (FDL), IITM, Pune. Region of interest (ROI) is from stations S10 to S19 where fully developed and nominally two-dimensional (2-D) mean flow is obtained. Zoomed view of the sample oil film interferometry (OFI) fringes obtained on an SF11 glass disc in the ROI is also shown in (b).  $L$ and
 $R$ respectively denote OFI locations on the left and right sides of the test-surface centreline.

Starting with the work of Glauert (Reference Glauert1956) in the mid-fifties, turbulent wall jets developing on flat surfaces have kept researchers engaged for quite some time. The studies range from experiments (Schwarz & Cosart Reference Schwarz and Cosart1961; Bradshaw & Gee Reference Bradshaw and Gee1962; Myers, Schauer & Eustis Reference Myers, Schauer and Eustis1963; Tailland & Mathieu Reference Tailland and Mathieu1967; Irwin Reference Irwin1973; Wygnanski, Katz & Horev Reference Wygnanski, Katz and Horev1992; Schneider & Goldstein Reference Schneider and Goldstein1994; Eriksson, Karlsson & Persson Reference Eriksson, Karlsson and Persson1998; Tachie, Balachandar & Bergström Reference Tachie, Balachandar and Bergström2002; Rostamy et al. Reference Rostamy, Bergstrom, Sumner and Bugg2011; Tang et al. Reference Tang, Rostamy, Bergstrom, Bugg and Sumner2015; Gnanamanickam et al. Reference Gnanamanickam, Bhatt, Artham and Zhang2019) to theoretical approaches (Glauert Reference Glauert1956; Irwin Reference Irwin1973; Narasimha, Narayan & Parthasarathy Reference Narasimha, Narayan and Parthasarathy1973; George et al. Reference George, Abrahamsson, Eriksson, Karlsson, Löfdahl and Wosnik2000; Afzal Reference Afzal2005; Barenblatt, Chorin & Prostokishin Reference Barenblatt, Chorin and Prostokishin2005; Gersten Reference Gersten2015) with some classic intermediate reviews (Launder & Rodi Reference Launder and Rodi1979, Reference Launder and Rodi1983) on the subject. With the increase in computing power, direct numerical simulations (DNS; see Ahlman, Brethouwer & Johansson (Reference Ahlman, Brethouwer and Johansson2007) and Naqavi, Tyacke & Tucker (Reference Naqavi, Tyacke and Tucker2018)) and large-eddy simulations (LES; see Dejoan & Leschziner (Reference Dejoan and Leschziner2005) and Banyassady & Piomelli (Reference Banyassady and Piomelli2014, Reference Banyassady and Piomelli2015)) at moderate Reynolds numbers have become possible in recent times. Wall jets, unlike other canonical wall-bounded turbulent flows, are characterized by a non-monotonic mean velocity profile with a velocity maximum occurring close to the surface. On either side of this maximum, velocity decreases in the wall-normal direction (see figure 1a). It is also known that a region of counter-gradient momentum diffusion occurs below the velocity maximum in these flows (Narasimha Reference Narasimha1990). Notwithstanding such unique features, advances in the understanding of wall jets have remained rather sporadic possibly due to fewer engineering applications – the two most prominent examples being (a) slot blowing used for separation control on the suction side of an aerofoil and (b) coolant flows in electronic devices and turbine blades (Launder & Rodi Reference Launder and Rodi1983). Unfortunately, another important application, relevant to atmospheric flows, appears to have gone largely unnoticed. In the mid-nineties, boundary-layer meteorologists pointed out that the so-called atmospheric low-level jets (LLJs) resemble, in the profiles of mean velocity and turbulence kinetic energy budget, laboratory wall jets (Smedman, Bergström & Högström Reference Smedman, Bergström and Högström1995). Since the representation of LLJ turbulence in weather prediction models requires modifications to boundary-layer parameterization (Hong Reference Hong2010; Hu, Klein & Xue Reference Hu, Klein and Xue2013), studies on laboratory wall jets could provide a rational basis for such developments.
Scaling mean velocity in two-dimensional, fully developed, turbulent wall jets (henceforth wall jets) has proved to be challenging and typically involves scaling: (i) streamwise variations of the velocity and length scales and (ii) velocity profiles  $U(z)$ using these scales. In this work,
 $x$,
 $y$ and
 $z$ respectively denote streamwise, spanwise and wall-normal coordinates. Experiments indicate that wall jets can be considered fully developed beyond
 $x/b\approx 30$ (Narasimha et al. (Reference Narasimha, Narayan and Parthasarathy1973), Eriksson et al. (Reference Eriksson, Karlsson and Persson1998), henceforth Reference Narasimha, Narayan and ParthasarathyNYP and Reference Eriksson, Karlsson and PerssonEKP, respectively);
 $b$ is the nozzle slot height. Note that all mean integral quantities such as length scales, velocity scales, etc., in a fully developed wall jet continue to ‘develop’ (vary) in the
 $x$ direction. This is to be contrasted with fully developed internal flows (pipes and channels) wherein mean-flow development is absent.
For a wall jet flow, the two important velocity scales of interest are the maximum velocity  $U_{max}$ (figure 1a) and the friction velocity
 $U_{\unicode[STIX]{x1D70F}}=\sqrt{\unicode[STIX]{x1D70F}_{w}/\unicode[STIX]{x1D70C}}$;
 $\unicode[STIX]{x1D70F}_{w}$ is the wall shear stress and
 $\unicode[STIX]{x1D70C}$ is the fluid density. Similarly, the height
 $z_{T}$ from the wall above the velocity maximum where the velocity equals
 $U_{max}/2$ (figure 1a) and the viscous length
 $\unicode[STIX]{x1D708}/U_{\unicode[STIX]{x1D70F}}$ are the two important length scales;
 $\unicode[STIX]{x1D708}$ is the fluid kinematic viscosity and
 $z_{T}$ represents the overall thickness of the flow. The ratio of these length scales is the local friction Reynolds number
 $Re_{\unicode[STIX]{x1D70F}}=z_{T}U_{\unicode[STIX]{x1D70F}}/\unicode[STIX]{x1D708}$. The choice of
 $z_{T}$ in lieu of
 $z_{max}$ (see Reference Narasimha, Narayan and ParthasarathyNYP) is motivated by the fact that the shape of the velocity profile is rather flat in the region around the velocity maximum. This makes
 $z_{max}$ more prone to measurement errors leading to larger data scatter that hampers testing of scaling laws. On the other hand,
 $z_{T}$ does not suffer from this drawback and is usually quite accurately obtained in experiments. Nozzle parameters such as the exit velocity
 $U_{j}$ (in the potential core), slot height
 $b$, Reynolds number
 $Re_{j}=U_{j}b/\unicode[STIX]{x1D708}$ and kinematic momentum rate per unit width (also sometimes referred to as the momentum flux)
 $M_{j}\sim U_{j}^{2}b$ constitute a set of initial conditions (ICs) for the wall jet flow.
In the case of the streamwise development of the length and velocity scales  $U_{max}$,
 $z_{T}$ and
 $U_{\unicode[STIX]{x1D70F}}$ (see point (i) above), most scaling approaches to date (Glauert Reference Glauert1956; Narasimha et al. Reference Narasimha, Narayan and Parthasarathy1973; George et al. Reference George, Abrahamsson, Eriksson, Karlsson, Löfdahl and Wosnik2000; Barenblatt et al. Reference Barenblatt, Chorin and Prostokishin2005) have used, in some form, one or more nozzle ICs as scaling parameters. Alternatively, in a more recent theoretical work, Gersten (Reference Gersten2015) has noted that, in certain (but not all) experimental configurations, the wall jet flow could asymptotically tend to a half-free jet as the Reynolds number tends to infinity (to be discussed later in some detail). Flow properties in this asymptotic state may be termed the far downstream conditions (FCs); Gersten (Reference Gersten2015) has proposed the momentum rate (
 $M_{\infty }$) of the asymptotic half-free jet as the relevant scaling parameter. These considerations lead to a fundamental question: Does a wall jet always ‘remember’ the ICs or ‘know’ the FCs throughout its development? An affirmative answer implies that truly self-similar development, controlled essentially by the local parameters, is not possible.
Possible influence of ICs (or FCs) on the scaling of mean velocity profile (see point (ii) above) can be briefly outlined as follows. In general, the structure of spatially developing turbulent wall-bounded flows consists of different layers, that follow different local (localized in the  $x$ direction) scalings, i.e. layer-wise self-similarity, but develop downstream at different rates. Such situations typically result in downstream increase of
 $Re_{\unicode[STIX]{x1D70F}}$, as for example in turbulent boundary layers (TBLs). In wall jets, there could be local
 $Re_{\unicode[STIX]{x1D70F}}$-dependence (non-universality) of the inner and outer mean velocity scaling laws and hence their overlap (as in George et al. (Reference George, Abrahamsson, Eriksson, Karlsson, Löfdahl and Wosnik2000)). The dependence of the length and velocity scales on ICs (or FCs), if any, then presents an additional but distinct complication that could render the velocity profile scaling in wall jets further dependent on the ICs (Barenblatt et al. Reference Barenblatt, Chorin and Prostokishin2005) or FCs (Gersten Reference Gersten2015) in addition to the local
 $Re_{\unicode[STIX]{x1D70F}}$-dependence.
In this work, we use data from our own experiments and the literature (§§ 2 and 3), and demonstrate that the streamwise variations of  $U_{max}$,
 $z_{T}$ and
 $U_{\unicode[STIX]{x1D70F}}$ better scale with the ‘local’ kinematic momentum rate
 $M=\int _{0}^{\infty }U^{2}\,\text{d}z$ (per unit width) and
 $\unicode[STIX]{x1D708}$, i.e. local conditions (LCs) than with ICs and FCs. In other words, there appears to be no dependence on ICs and FCs, and the basic requirement for self-similarity, namely the lack of imposed length and velocity scales, appears to be satisfied (§ 3). Next, it is shown that the wall jet flow comprises of universal (independent of both nozzle ICs/FCs and
 $Re_{\unicode[STIX]{x1D70F}}$) inner and outer scaling layers (§ 4.1) termed the wall layer and the full-free jet layer, respectively. Starting with this two-layer structure, theoretical arguments, free from any modelling assumptions, show that the overlap of these self-similar (universal) layers leads to a non-universal (
 $Re_{\unicode[STIX]{x1D70F}}$-dependent) power-law profile for mean velocity in the overlap layer (§§ 4.2 and 4.3). Analysis of DNS data reveals that the mean-velocity overlap layer corresponds quite well with the momentum-balance mesolayer in wall jets (§ 4.4) and this correspondence may be used to effectively absorb the
 $Re_{\unicode[STIX]{x1D70F}}$-dependence of the overlap layer into an intermediate variable which in turn leads to a universal power-law mean velocity profile in the overlap layer. Data also indicate that there is no inertial overlap between the inner and outer scaling regions for the range of Reynolds numbers considered here (§ 4.4).
2 Experimental details
Figures 1(b) and 1(c) show the wall jet set-up constructed at the Fluid Dynamics Laboratory (FDL), Indian Institute of Tropical Meteorology (IITM), Pune, India. A settling chamber, consisting of a honeycomb and a set of suitable screens, admits air from a well-balanced, high flow rate blower (Ametek Nautilair  $8.9^{\prime \prime }$ impeller diameter) and discharges it through a two-dimensional nozzle (width
 $L=300~\text{mm}$, height
 $b=10~\text{mm}$) tangentially onto the test surface. Blower speed may be adjusted using a pulse width modulation (PWM) controller and kept constant even under variable load conditions. For well-defined initial conditions, a sharp aluminium upper lip is fitted at the exit of the nozzle. A recent study (McIntyre et al. Reference McIntyre, Savory, Wu and Ting2019) focuses on the effect of the thickness of a blunt lip on the downstream development of wall jets and concludes that no significant effects of the lip thickness are observed on the profiles of various quantities beyond
 $x/b\approx 10$. However, McIntyre et al. have not discussed the effect of lip thickness on spanwise homogeneity of the mean flow. In our set-up, we have observed that use of a blunt upper lip results in significant spanwise variations of mean-flow quantities even at distances far downstream from the nozzle. However, it is observed, that a fair stretch of nominally two-dimensional flow (figure 2b) is obtained when one resorts to a sharp upper lip instead of a blunt one. The lower lip of the nozzle is carefully levelled with the test surface. Velocity profiles at nozzle exit are close to the top-hat profile (not shown) and uniform across the entire width except for small portions near the ends. The test surface is a flat, straight and polished aluminium plate (width 600 mm, length 1500 mm and thickness 6 mm). The size of the room is large enough for secondary flow effects to be minimal. Static pressure ports of 0.5 mm diameter are drilled in the brass bushes fitted along the longitudinal centreline of the test surface. Counterbore brass bushes are fitted on either side (
 $L$ and
 $R$ in figure 1b) of the longitudinal centreline and are used to mount the SF11 glass discs for OFI; unused bushes are fitted with Teflon plugs. It is ensured that all fittings are flush with the test surface.
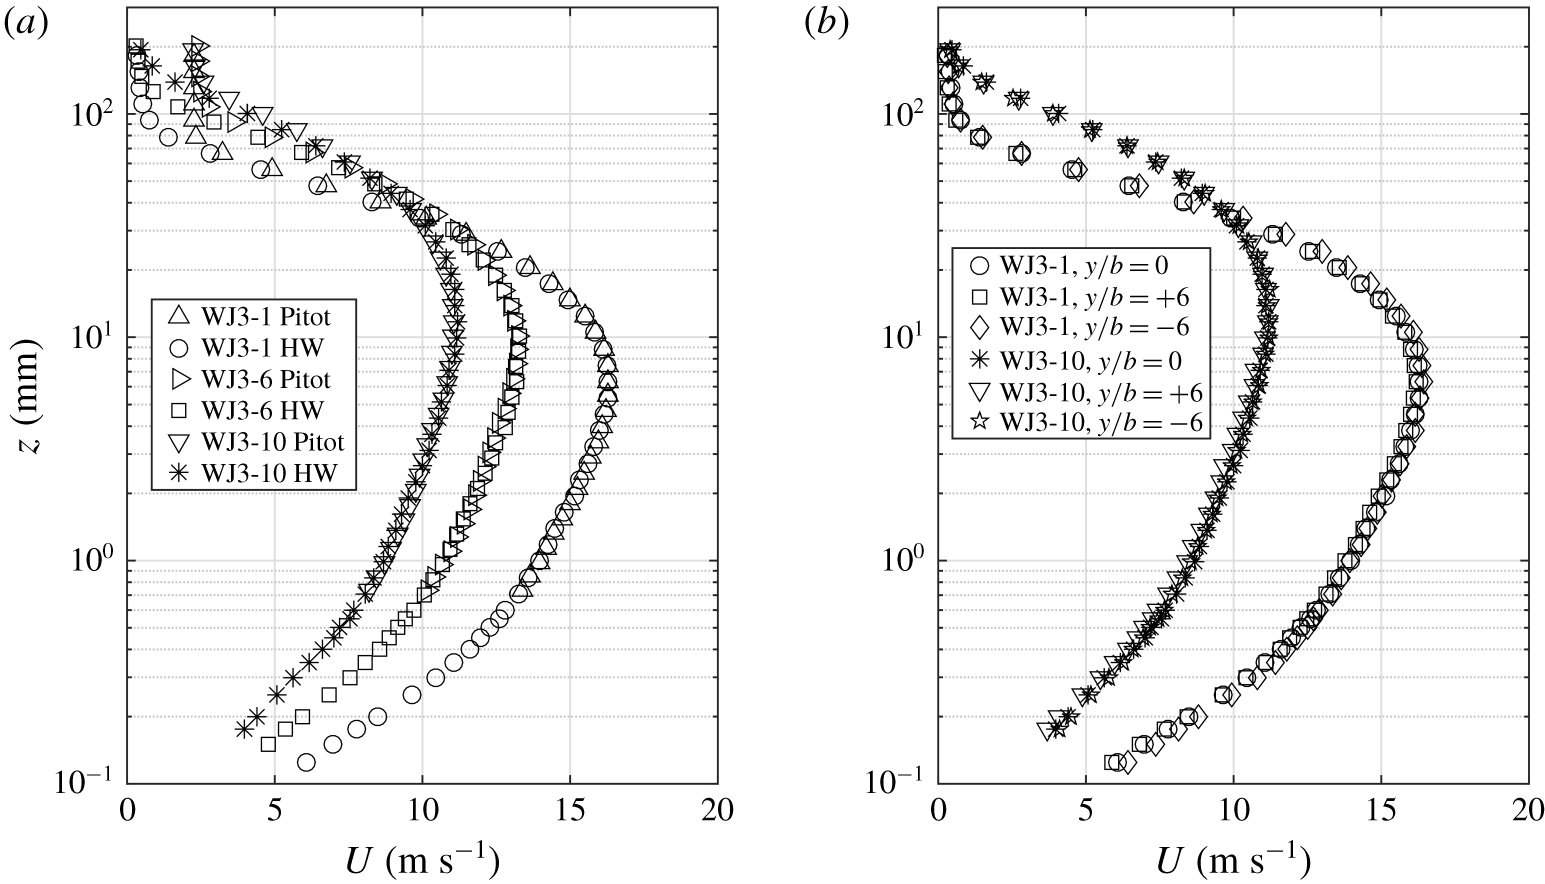
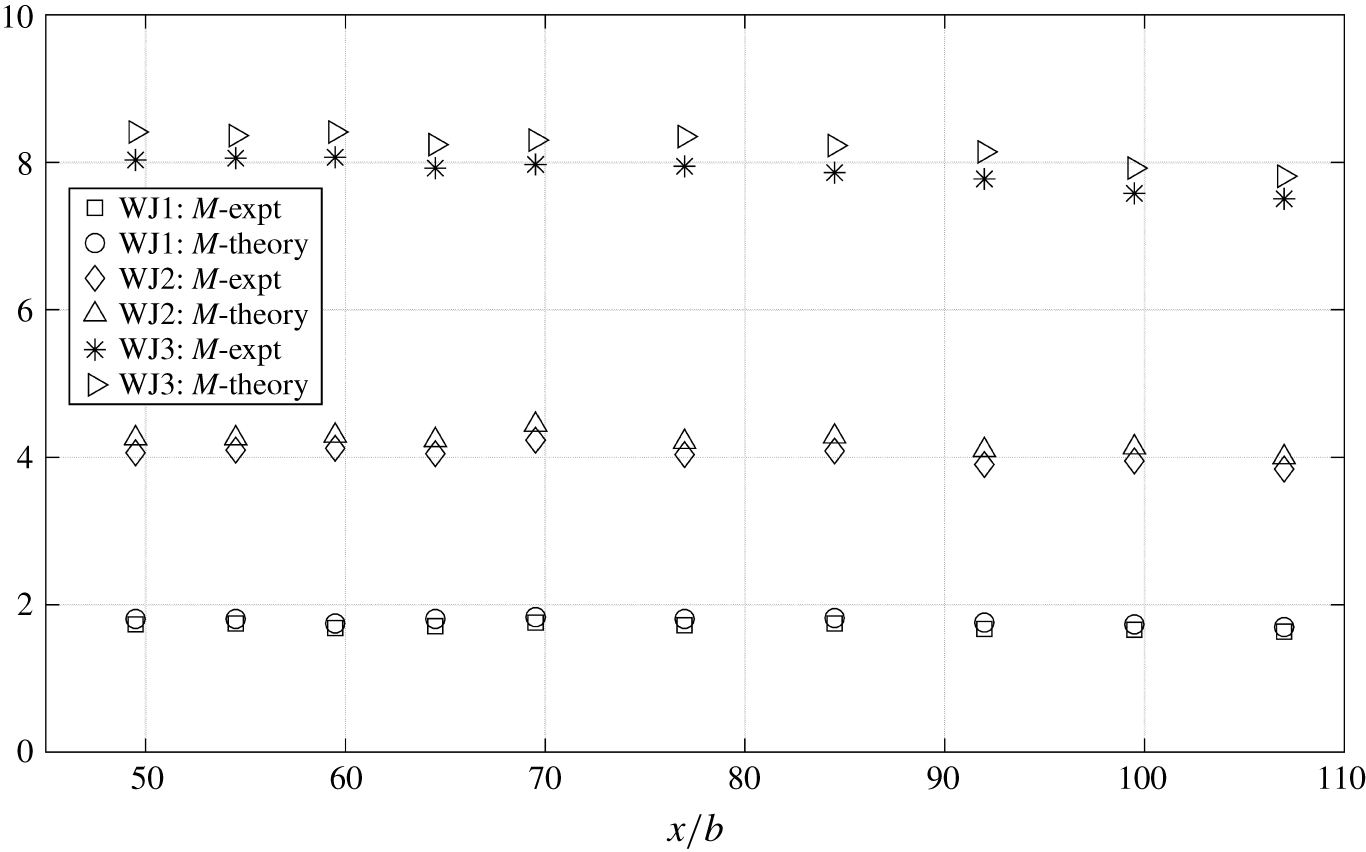
Mean-velocity data for  $Re_{j}=21\,228$. (a) Dimensional velocity profiles measured by Pitot tube and hot-wire (HW) probe at different streamwise stations along the plate centreline and (b) dimensional HW profiles at three spanwise stations and two streamwise stations.

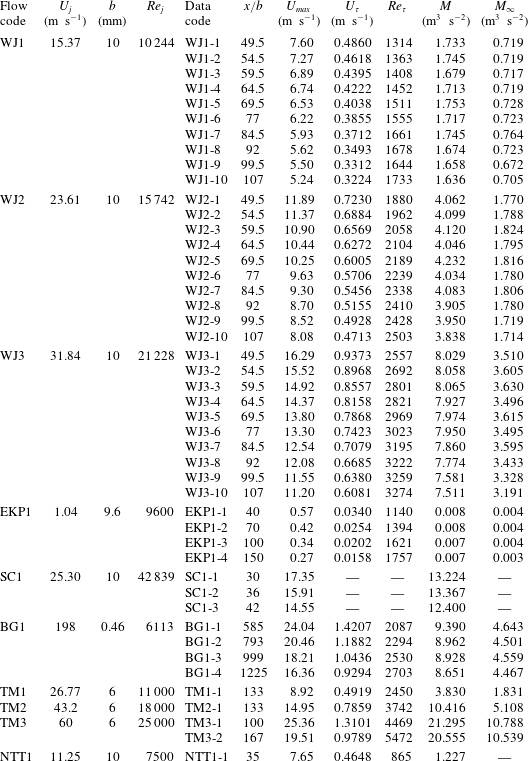
Important parameters for the data sets under consideration. WJ1, WJ2 and WJ3 are the present experimental data sets. EKP1, Eriksson et al. (Reference Eriksson, Karlsson and Persson1998); SC1, Schwarz & Cosart (Reference Schwarz and Cosart1961); BG1, Bradshaw & Gee (Reference Bradshaw and Gee1962); and TM1, TM2 and TM3, Tailland & Mathieu (Reference Tailland and Mathieu1967) are experimental data sets from the literature. NTT1, Naqavi et al. (Reference Naqavi, Tyacke and Tucker2018) is the recent DNS data set. The  $U_{\unicode[STIX]{x1D70F}}$ values for Reference Bradshaw and GeeBG and Reference Tailland and MathieuTM data sets have been corrected as discussed in § 3.4;
 $M_{\infty }$ is computed as per the procedure given in §8 of Gersten (Reference Gersten2015) which is further elaborated in appendix B;
 $M_{\infty }$ is not computed for Reference Schwarz and CosartSC data due to unavailability of
 $U_{\unicode[STIX]{x1D70F}}$ and Reference Naqavi, Tyacke and TuckerNTT data due to only a single data point.

Mean velocity profiles at different streamwise and spanwise stations are measured, using a Pitot tube and a single hot-wire probe, for three nozzle Reynolds numbers  $Re_{j}=U_{j}b/\unicode[STIX]{x1D708}=10\,244$, 15 742 and 21 228 (WJ1, WJ2 and WJ3, respectively, in table 1);
 $\unicode[STIX]{x1D708}=1.5\times 10^{-5}~\text{m}^{2}~\text{s}^{-1}$ is the kinematic viscosity of air at the room temperature prevalent during experiments. The Pitot tube has an outer diameter of 1.2 mm and an ethanol-based projection manometer having a least count of 0.1 mm of ethanol column is used to measure the pressure difference between the Pitot tube and a reference static pressure port on the test surface. It is verified that there is no gradient of mean static pressure in the
 $x$ direction. Near-wall Pitot readings are corrected using the procedure given by Bailey et al. (Reference Bailey, Hultmark, Monty, Alfredsson, Chong, Duncan, Fransson, Hutchins, Marusic and McKeon2013). The single hot-wire probe is custom made with prongs made of sharp stainless steel needles with a tip spacing of approximately 2.5 mm. The sensor is a silver cladded Pt–Rh Wollaston wire of core diameter
 $d=5~\unicode[STIX]{x03BC}\text{m}$. The wire is first soldered to the prongs and silver cladding in the central portion is etched away electrochemically using 10 % nitric acid solution to expose the Pt–Rh sensor element. The active length is
 $l\approx 0.9~\text{mm}$ so that
 $l/d\approx 180$ and
 $19\leqslant l_{+}\leqslant 56$ over the entire range of experiments;
 $l_{+}=lU_{\unicode[STIX]{x1D70F}}/\unicode[STIX]{x1D708}$ is the length of the sensor in wall units. The sensor is operated by the StreamLine Pro constant temperature anemometer from Dantec Dynamics, Denmark and the anemometer output is acquired at 10 kHz on a computer through National Instruments PCI-6143 card using Dantec’s StreamWare Pro software. Calibration of the sensor is performed in situ by recording the mean anemometer voltage
 $V$ (sampled at 10 kHz for 30 s) over a range of blower speeds, at a fixed height from the wall (near the velocity maximum); mean velocity
 $U$ at this height is measured by the Pitot tube. King’s law calibration equation of the form
 $V^{2}=\unicode[STIX]{x1D701}_{1}+\unicode[STIX]{x1D701}_{2}U^{0.45}$ is used to obtain calibration constants
 $\unicode[STIX]{x1D701}_{1}$ and
 $\unicode[STIX]{x1D701}_{2}$. Calibration is performed before and after each experiment and data with significant calibration drifts are discarded. It is ensured that the room temperature variations during the experiments are within
 $\pm 0.5\,^{\circ }\text{C}$ of the average temperature during the experiment. Data during the experiments are sampled at 10 kHz for 60, 90 and 120 s respectively for
 $Re_{j}=21\,228$, 15 742 and 10 244 in order to compensate for the lower overall flow speeds at lower Reynolds numbers. Figure 2(a) shows Pitot tube and hot-wire measurements agreeing quite well with each other, demonstrating measurement consistency. Pitot readings saturate to constant non-zero values away from the wall due to the insensitivity of the Pitot-tube–alcohol manometer system to small velocity variations. Hot-wire data, on the other hand, correctly show the velocities tending to zero far away from the wall. Figure 2(b) shows collapse of dimensional hot-wire profiles, demonstrating two-dimensionality of the mean flow over the streamwise–spanwise extent
 $49.5\leqslant x/b\leqslant 107$ and
 $-6\leqslant y/b\leqslant 6$.
Wall shear stress  $\unicode[STIX]{x1D70F}_{w}$ is directly measured at
 $y/b\approx \pm 4.5$ on either side of the plate centreline (see
 $L$ and
 $R$ in figure 1b) using the OFI technique. A small drop of silicone fluid is placed on an SF11 glass disc (blackened on its bottom side) fitted flush in the brass bush. Smearing of the drop due to the flow forms a film that thins down at a rate proportional to
 $\unicode[STIX]{x1D70F}_{w}$. When illuminated by a sodium vapour lamp (average wavelength of 589.3 nm), the reflected near-monochromatic light from the top and bottom interfaces of the film forms an interference pattern (figure 1b);
 $\unicode[STIX]{x1D70F}_{w}$ is related to the time rate of increase
 $\unicode[STIX]{x0394}x/\unicode[STIX]{x0394}t$ of the inter-fringe spacing (Chauhan, Henry & Marusic Reference Chauhan, Henry and Marusic2010). A computer-controlled DSLR camera (Nikon D5500) fitted with a prime macro lens (AF-S VR Micro-Nikkor 105 mm f/2.8G IF-ED) is used to capture the interference pattern at every 2 s interval. The camera is located well above the plate at a viewing angle
 $\unicode[STIX]{x1D703}$, which in turn is measured from a photograph of the set-up taken using another camera. Image sequences with significant dust contamination of the oil film are discarded. Each image is converted to grey scale and subjected to fast Fourier transform (FFT) analysis of pixel intensity using custom-written MATLAB codes. A robust estimate of the fringe spacing
 $\unicode[STIX]{x0394}x$ in each image is extracted by averaging over at least 50 pixel rows in the region where the fringes are straight and perpendicular to the overall flow direction. In order to ensure consistency and repeatability, silicone fluids of two different nominal viscosities (
 $\unicode[STIX]{x1D708}_{s}=100$ and 200 cSt) are used for all measurements. These fluids are calibrated for their density
 $\unicode[STIX]{x1D70C}_{s}$, refractive index
 $n_{s}$ and temperature dependence of kinematic viscosity
 $\unicode[STIX]{x1D708}_{s}$. Temperature of the thin film, just before and after each experiment, is measured with a hand-held infrared thermometer (Fluke 64 MAX); this allows appropriate calculation of
 $\unicode[STIX]{x1D708}_{s}$ under the experimental conditions. Relation (1) from Chauhan et al. (Reference Chauhan, Henry and Marusic2010) is used to compute
 $\unicode[STIX]{x1D70F}_{w}$ and
 $U_{\unicode[STIX]{x1D70F}}$. In each experimental run, values of
 $U_{\unicode[STIX]{x1D70F}}$ from both sides of the centreline and with both the silicone fluids are found to agree to within
 $\pm 2.5\,\%$ of the average of those four values; this average value is given in table 1. This reconfirms mean flow two-dimensionality. Table 1 lists important experimental parameters for all our data sets (WJ1, WJ2 and WJ3) used in this work.
3 Scaling streamwise variations of  $U_{max}$, $z_{T}$ and $U_{\unicode[STIX]{x1D70F}}$


First, we shall give a brief account of the existing scaling approaches based on ICs and FCs in addition to the present proposal based on LCs. To remind the reader, we have three kinematic momentum rates (per unit width) of significance for ICs, FCs and LCs (see § 1) and they are as follows: the nozzle momentum rate  $M_{j}=U_{j}^{2}b$, the far downstream momentum rate
 $M_{\infty }$ of the asymptotic half-free jet state and the local wall jet momentum rate
 $M=\int _{0}^{\infty }U^{2}\,\text{d}z$, respectively. Data sets selected from the literature will also be discussed briefly and the evaluation of various scaling approaches will be presented.
3.1 Approaches based on nozzle ICs
As noted by Reference Narasimha, Narayan and ParthasarathyNYP, early approaches have relied upon  $U_{j}$ and
 $b$ as the relevant scaling parameters, i.e. relations of the form
 $U_{max}/U_{j}=F(x/b)$, where
 $F$ is a universal function, should hold. However, after compiling a large amount of experimental data on wall jets in still air, Reference Narasimha, Narayan and ParthasarathyNYP have found that the data do not scale simply on
 $U_{j}$ and
 $b$. Based on the dynamical importance of the nozzle kinematic momentum rate
 $M_{j}$, Reference Narasimha, Narayan and ParthasarathyNYP have proposed the relevant scaling parameters to be
 $M_{j}$ (instead of
 $U_{j}$ and
 $b$ separately) and
 $\unicode[STIX]{x1D708}$. Reference Narasimha, Narayan and ParthasarathyNYP have showed that this
 $M_{j}$–
 $\unicode[STIX]{x1D708}$ scaling leads to better collapse of the data with relationships of the form
 $U_{max}\unicode[STIX]{x1D708}/M_{j}=f_{1}(xM_{j}/\unicode[STIX]{x1D708}^{2})$,
 $z_{T}M_{j}/\unicode[STIX]{x1D708}^{2}=f_{2}(xM_{j}/\unicode[STIX]{x1D708}^{2})$ etc. where
 $f_{1}$ and
 $f_{2}$ are supposed to be universal functions. Several further studies (Wygnanski et al. Reference Wygnanski, Katz and Horev1992; George et al. Reference George, Abrahamsson, Eriksson, Karlsson, Löfdahl and Wosnik2000) have used the Reference Narasimha, Narayan and ParthasarathyNYP scaling to present their data and found it to be reasonably robust.
More recently, Barenblatt et al. (Reference Barenblatt, Chorin and Prostokishin2005) – henceforth Reference Barenblatt, Chorin and ProstokishinBCP – have argued that the strong dependence on slot height  $b$ remains important and this leads to the so-called incomplete similarity in the dimensionless independent variables
 $\unicode[STIX]{x1D6F1}_{1}=z/b$,
 $\unicode[STIX]{x1D6F1}_{2}=x/b$ and
 $\unicode[STIX]{x1D6F1}_{3}=\sqrt{M_{j}b/\unicode[STIX]{x1D708}^{2}}$. Note that, in the Reference Barenblatt, Chorin and ProstokishinBCP framework, the governing (independent) parameters are taken to be
 $x$,
 $z$,
 $b$,
 $M_{j}$ and
 $\unicode[STIX]{x1D708}$, and
 $b$ and
 $\unicode[STIX]{x1D708}$ are used to make
 $x$,
 $z$ and
 $M_{j}$ dimensionless in accordance with Buckingham’s Pi theorem. Since
 $\unicode[STIX]{x1D6F1}_{3}$ is a measure of the nozzle Reynolds number
 $Re_{j}$, streamwise variations of all the length and velocity scales may be expressed as
 $U_{max}b/\unicode[STIX]{x1D708}=f_{3}(x/b,Re_{j})$,
 $z_{T}/b=f_{4}(x/b,Re_{j})$ etc. For complete similarity according to Reference Barenblatt, Chorin and ProstokishinBCP, this implies that the data from various experiments should collapse to universal curves in plots of
 $U_{max}b/\unicode[STIX]{x1D708}$ versus
 $x/b$,
 $z_{T}/b$ versus
 $x/b$ etc. as
 $Re_{j}\rightarrow \infty$. However, the results of Reference Narasimha, Narayan and ParthasarathyNYP indicate that the
 $z_{T}/b$ versus
 $x/b$ plot does not show such collapse. This observation could be taken to support the incomplete similarity hypothesis of Reference Barenblatt, Chorin and ProstokishinBCP.
As a side line, one may ask if there is any connection at all between these seemingly different approaches of Reference Narasimha, Narayan and ParthasarathyNYP and Reference Barenblatt, Chorin and ProstokishinBCP. To see this, consider choosing  $M_{j}$ and
 $\unicode[STIX]{x1D708}$ (instead of
 $b$ and
 $\unicode[STIX]{x1D708}$ but still remaining within the Reference Barenblatt, Chorin and ProstokishinBCP framework) to form the dimensionless groups. One then obtains
 $\unicode[STIX]{x1D6F1}_{1}^{\ast }=zM_{j}/\unicode[STIX]{x1D708}^{2}$,
 $\unicode[STIX]{x1D6F1}_{2}^{\ast }=xM_{j}/\unicode[STIX]{x1D708}^{2}$ and
 $\unicode[STIX]{x1D6F1}_{3}^{\ast }=\unicode[STIX]{x1D6F1}_{3}=\sqrt{M_{j}b/\unicode[STIX]{x1D708}^{2}}$. This choice leads to the scaling relations
 $U_{max}\unicode[STIX]{x1D708}/M_{j}=f_{3}^{\ast }(xM_{j}/\unicode[STIX]{x1D708}^{2},Re_{j})$,
 $z_{T}M_{j}/\unicode[STIX]{x1D708}^{2}=f_{4}^{\ast }(xM_{j}/\unicode[STIX]{x1D708}^{2},Re_{j})$ etc. Interestingly, Reference Narasimha, Narayan and ParthasarathyNYP have already shown that the data (accessible to them) collapse fairly well to near-universal curves, i.e. no
 $Re_{j}$-dependence, in plots of
 $U_{max}\unicode[STIX]{x1D708}/M_{j}$ versus
 $xM_{j}/\unicode[STIX]{x1D708}^{2}$,
 $z_{T}M_{j}/\unicode[STIX]{x1D708}^{2}$ versus
 $xM_{j}/\unicode[STIX]{x1D708}^{2}$, etc. This suggests complete similarity! In other words, simple change of repeating variables in the Reference Barenblatt, Chorin and ProstokishinBCP approach leads to the approach of Reference Narasimha, Narayan and ParthasarathyNYP which in turn supports complete similarity, i.e. the direct effect of slot height
 $b$, if any, appears to be negligibly small.
To summarize, the approach of Reference Narasimha, Narayan and ParthasarathyNYP appears to be the most appropriate amongst those that use nozzle ICs as scaling parameters.
3.2 Approach based on FCs
Recently, Gersten (Reference Gersten2015) has pointed out the need for a distinction between different wall jet configurations based on the geometry of the experimental set-up, i.e. whether (or not) the nozzle is located in a large wall perpendicular to the test surface. This distinction is motivated by the theoretical results for turbulent plane free jets by Schneider (Reference Schneider1985), wherein it is shown that the kinematic momentum flux  $M$ at large distances (
 $x\rightarrow \infty$) from the nozzle – (i) asymptotically vanishes (
 $M\rightarrow 0$) if the nozzle is located in a large plane wall perpendicular to the jet exit velocity vector and (ii) remains constant (
 $M=M_{j}$) for nozzles without any such wall. Extending this idea to wall jets, Gersten (Reference Gersten2015) has hypothesized that the asymptotic state far downstream (as Reynolds number tends to infinity) would be a half-free jet with finite momentum rate
 $M_{\infty }$ (we denote this by FC; see § 1) if the nozzle in the wall jet set-up is not located in a wall perpendicular to the test surface. With this, the wall jet flow could be considered as a perturbation of the limiting half-free jet state and therefore Gersten (Reference Gersten2015) has proposed
 $M_{\infty }$ as the scaling parameter for the streamwise coordinate
 $x$. This leads to the definition of a local Reynolds number
 $Re_{x}=\sqrt{(x-x_{0})M_{\infty }}/\unicode[STIX]{x1D708}$ (
 $x_{0}$ is the adjustment for the virtual origin effect) and all the other dimensionless parameters are then expected to be universal functions of
 $Re_{x}$. Consistent with the current presentation, the expected universal relationships involving
 $M_{\infty }$ and
 $\unicode[STIX]{x1D708}$ may be written as
 $U_{max}\unicode[STIX]{x1D708}/M_{\infty }=f_{5}(xM_{\infty }/\unicode[STIX]{x1D708}^{2})$,
 $z_{T}M_{\infty }/\unicode[STIX]{x1D708}^{2}=f_{6}(xM_{\infty }/\unicode[STIX]{x1D708}^{2})$, etc.
3.3 The present approach based on LCs
As outlined in § 1, if indeed wall jet flow evolves downstream in a self-similar fashion, then the local kinematic momentum rate  $M=\int _{0}^{\infty }U^{2}\,\text{d}z$ and
 $\unicode[STIX]{x1D708}$ (i.e. LCs) could very well be the candidate scaling parameters. Some support for this proposal may be derived from the work of Reference Narasimha, Narayan and ParthasarathyNYP who have suggested ‘A similar correlation using local momentum flux
 $M$ is implied by (3)
 $\ldots$ but clearly
 $M$ is less convenient than
 $M_{j}$’. In case of self-similar development, data should show better collapse with LCs than with ICs or FCs. Therefore, according to our present proposal of ‘local’ scaling, we expect universal relationships of the form
 $U_{max}\unicode[STIX]{x1D708}/M=f_{7}(xM/\unicode[STIX]{x1D708}^{2})$,
 $z_{T}M/\unicode[STIX]{x1D708}^{2}=f_{8}(xM/\unicode[STIX]{x1D708}^{2})$, etc.
3.4 Wall jet data sets from the literature
In order to evaluate the scaling approaches mentioned above, we have selected, apart from our own experimental data (§ 2), five well-documented studies from the literature. These are briefly described below with necessary parameters given in table 1.
The main constraints on the selection of the data sets are the availability of measured mean velocity profiles and an accurate estimate of the wall shear stress  $\unicode[STIX]{x1D70F}_{w}$. The former is necessary to evaluate the local momentum rate
 $M$ and the latter is crucial for testing the scaling of skin friction. Accurate measurement of
 $\unicode[STIX]{x1D70F}_{w}$ poses serious challenges in wall jets (Launder & Rodi Reference Launder and Rodi1979). Computation of
 $\unicode[STIX]{x1D70F}_{w}$ from the mean velocity gradient in the linear viscous sublayer is accurate only with non-heat transfer techniques such as laser Doppler velocimetry (LDV). Hot-wire data are known to yield spurious large values of velocity in the near-wall region due to strong conduction heat transfer to the wall (Durst, Zanoun & Pashtrapanska Reference Durst, Zanoun and Pashtrapanska2001), the so-called wall proximity effect. This could result in reduction in the estimated values of the velocity gradient at the wall, leading to lower-than-actual values of
 $\unicode[STIX]{x1D70F}_{w}$ (and hence
 $U_{\unicode[STIX]{x1D70F}}$). Use of impact tube devices such as the Stanton tube relies on the universality of the mean velocity profile over the wall-normal extent of the device. Usually such devices are calibrated in a canonical flow such as a fully developed channel or a zero-pressure-gradient TBL and then used in wall jets to measure skin friction (Bradshaw & Gee Reference Bradshaw and Gee1962). However, it has been reported that the linear velocity profile in the sublayer of wall jets extends only up to
 $z_{+}\approx 3$ in contrast to the celebrated
 $z_{+}\approx 5$ in canonical TBLs, pipes and channels (Eriksson et al. Reference Eriksson, Karlsson and Persson1998). As we shall see later, such a reduction in the thickness of the linear sublayer is consistent with the strong influence of the outer jet flow on the inner wall flow. In view of these difficulties, one may consider applying some judiciously estimated corrections to
 $\unicode[STIX]{x1D70F}_{w}$ values measured in wall jets using the hot-wire mean velocity gradient and impact tubes. These corrections are discussed further in the relevant places. In our experiments described in § 2, we have used OFI that does not suffer from these drawbacks and allows direct, reliable measurement of
 $\unicode[STIX]{x1D70F}_{w}$.
The first data set is from Reference Eriksson, Karlsson and PerssonEKP and the data measured for  $Re_{j}=9600$ at four different streamwise locations are selected for the present purpose. These are available in the ERCOFTAC Classic Collection Database. The working fluid is water and the nozzle is located in a vertical wall perpendicular to the test surface. Mean velocity has been measured using high-resolution LDV and
 $\unicode[STIX]{x1D70F}_{w}$ has been computed from the velocity gradient in the linear viscous sublayer. There is reverse flow above the wall jet in this set-up due to the vertical wall above the nozzle exit extending all the way to the free surface of water.
The second set of data come from Schwarz & Cosart (Reference Schwarz and Cosart1961) – henceforth Reference Schwarz and CosartSC – and have been measured at different nozzle Reynolds numbers of which the  $Re_{j}=42\,839$ data have been digitized from figure 2 given in Reference Schwarz and CosartSC. The working fluid is air and nozzle is not located in a wall perpendicular to the test surface. Mean velocity has been measured using hot-wire anemometry and
 $\unicode[STIX]{x1D70F}_{w}$ has not been measured in these experiments.
The third data set is from the extensive measurements by Bradshaw & Gee (Reference Bradshaw and Gee1962) – hereafter Reference Bradshaw and GeeBG. These are also air-based experiments with  $Re_{j}=6113$ (see table 1) and four representative hot-wire mean velocity profiles have been digitized from the figures 2, 3 and 6 in Reference Bradshaw and GeeBG. The nozzle is not located in a wall perpendicular to the test surface and
 $\unicode[STIX]{x1D70F}_{w}$ has been measured using a Stanton tube (Bradshaw & Gregory Reference Bradshaw and Gregory1961; Bradshaw & Gee Reference Bradshaw and Gee1962) made typically from a 0.002 inch (
 $z_{+}\approx 3.5$ to 6 for Reference Bradshaw and GeeBG data) thick steel blade; the Stanton tube has been calibrated in a channel flow and used to measure
 $\unicode[STIX]{x1D70F}_{w}$ in the wall jets. However, as mentioned before, the linear sublayer extends only up to
 $z_{+}\approx 3$ in wall jets (see figure 10 of Reference Eriksson, Karlsson and PerssonEKP) as against
 $z_{+}\approx 5$ in channel flows. Therefore, the Stanton tube
 $U_{\unicode[STIX]{x1D70F}}$ values in the Reference Bradshaw and GeeBG data sets require corrections that may be estimated using the Reference Eriksson, Karlsson and PerssonEKP near-wall profile as follows. Figure 10 of Reference Eriksson, Karlsson and PerssonEKP shows that the near-wall profile in wall jets is described well by
 $U_{+}=z_{+}+C_{4}z_{+}^{4}$, where
 $C_{4}=-0.0004$ (Eriksson et al. Reference Eriksson, Karlsson and Persson1998) represents the maximum departure of the profile from linear variation. Now, a Stanton tube is expected to respond to the dynamic pressure exerted by the average flow velocity in the gap between the test surface and the chamfered sharp leading edge of the steel blade. Therefore, one may compute the inner-scaled average velocity
 $U_{avg+}$ in a wall jet over the thickness of the blade using the above-mentioned wall jet inner layer profile. Similarly,
 $U_{avg+}$ may be computed using the linear velocity profile, which is typical of the channel flow calibration of a Stanton tube. For the same value of
 $U_{avg}$, one may then compute the ratio of these two inner-scaled average velocities to obtain the ratio of actual
 $U_{\unicode[STIX]{x1D70F}}$ value in the wall jet to that read by the Stanton tube as per its channel flow calibration. For the four flows of Reference Bradshaw and GeeBG (BG1-1 to BG1-4), these ratios respectively turn out to be 1.0172, 1.0102, 1.007 and 1.005. Therefore, the
 $U_{\unicode[STIX]{x1D70F}}$ values for Reference Bradshaw and GeeBG data listed in table 1 have been corrected by multiplying the original
 $U_{\unicode[STIX]{x1D70F}}$ values by these enhancement factors.
The fourth data set belongs to the well-cited experiments of Tailland & Mathieu (Reference Tailland and Mathieu1967) – henceforth Reference Tailland and MathieuTM. These are air-based experiments with three different nozzle Reynolds numbers ( $Re_{j}=11\,000$, 18 000 and 25 000) as seen in table 1. Four representative hot-wire mean velocity profiles have been digitized from figure 2 in Reference Tailland and MathieuTM. The nozzle is not located in a wall perpendicular to the test surface and
 $\unicode[STIX]{x1D70F}_{w}$ has been measured using the velocity gradient in the near-wall region. It is known that the
 $\unicode[STIX]{x1D70F}_{w}$ values in Reference Tailland and MathieuTM are 20 % to 35 % lower than the consensus impact tube data (Launder & Rodi Reference Launder and Rodi1979), which is most likely due to the wall proximity effect of hot-wires described above. In view of this, we have corrected the skin friction values in the Reference Tailland and MathieuTM data sets using an enhancement of 10 % in
 $U_{\unicode[STIX]{x1D70F}}$ (i.e. 20 % in
 $\unicode[STIX]{x1D70F}_{w}$).
Finally, the fifth data set is taken from the recent DNS of Naqavi et al. (Reference Naqavi, Tyacke and Tucker2018) – henceforth Reference Naqavi, Tyacke and TuckerNTT – having  $Re_{j}=7500$. The nozzle is not located in a wall perpendicular to the test surface because a co-flow velocity (6 % of
 $U_{j}$) has been used as the inlet boundary condition above the nozzle as well as the outer boundary condition. The flow used in the present analysis corresponds to
 $x/b=35$, which is the farthest downstream station from the nozzle exit free from the domain end effects. Since the wall jet flow attains fully developed state beyond
 $x/b=30$ as mentioned before, we have not used the data for
 $x/b<35$ from this DNS study. In addition to the mean velocity profile data at
 $x/b=35$, we have also used the Reynolds shear stress profile to investigate the layered structure of wall jet flow based on the mean momentum balance (§ 4.4).
There have been some recent water-based wall jet experiments (Tachie et al. Reference Tachie, Balachandar and Bergström2002; Rostamy et al. Reference Rostamy, Bergstrom, Sumner and Bugg2011; Tang et al. Reference Tang, Rostamy, Bergstrom, Bugg and Sumner2015) that have used a facility similar to the Reference Eriksson, Karlsson and PerssonEKP facility and covered a similar range of Reynolds numbers. However, we have noticed a certain peculiar behaviour of this facility. Upon coming out of the nozzle, the kinematic momentum rate  $M$ of the wall jet has been initially found to increase downstream up to
 $x/b\approx 50$ and to reach a maximum value of
 $M/M_{j}\approx 1.25$ (see Tachie Reference Tachie2001). Beyond this point, the momentum rate starts reducing in the downstream direction. Although there has been some explanation provided for this anomalous increase of momentum rate in this facility (Tachie Reference Tachie2001), no other wall jet studies have reported such a behaviour. Our contention is that this mean flow acceleration could be related to the secondary flow set up in the tank above the main wall jet flow. Since our scaling approach crucially hinges on the correctness of the local kinematic momentum rate
 $M$, these data sets had to be excluded from our analysis.
3.5 Scaling results
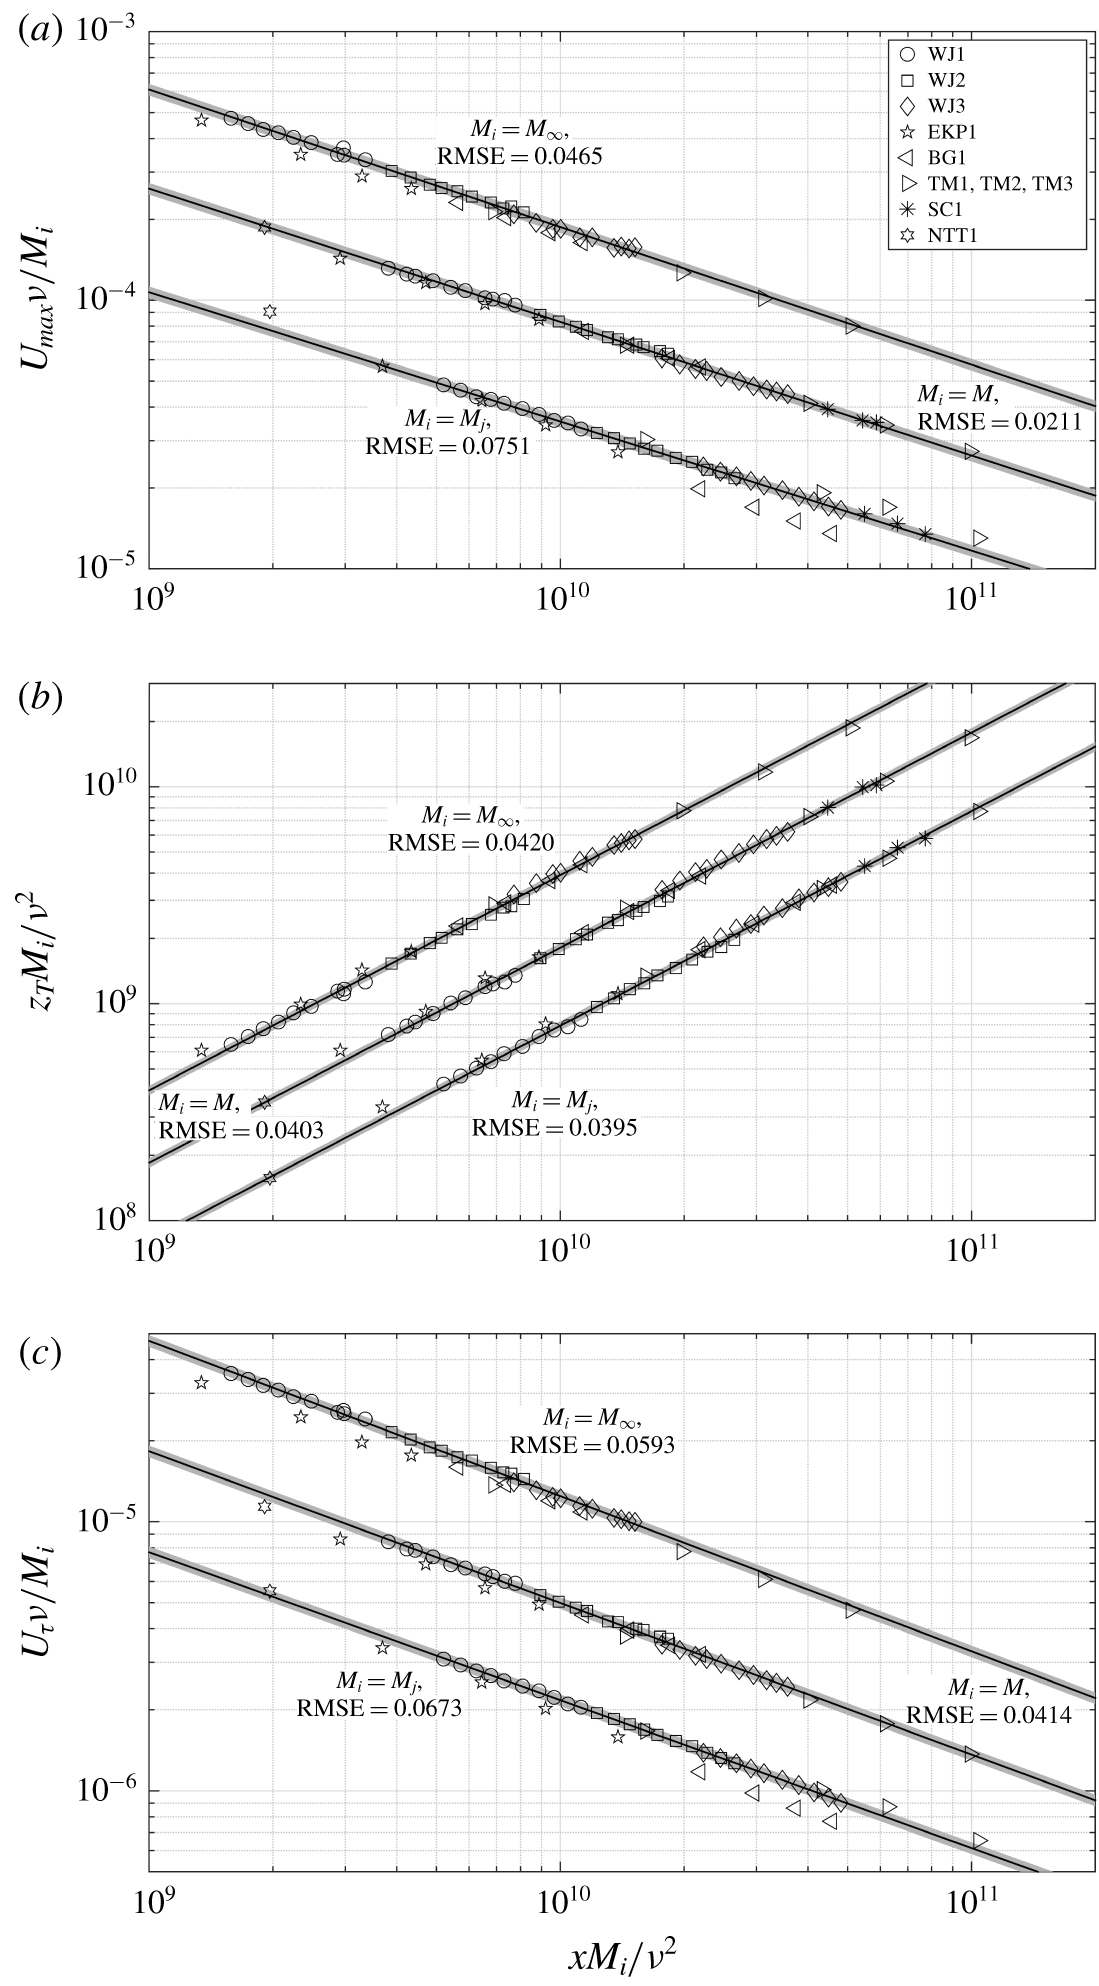
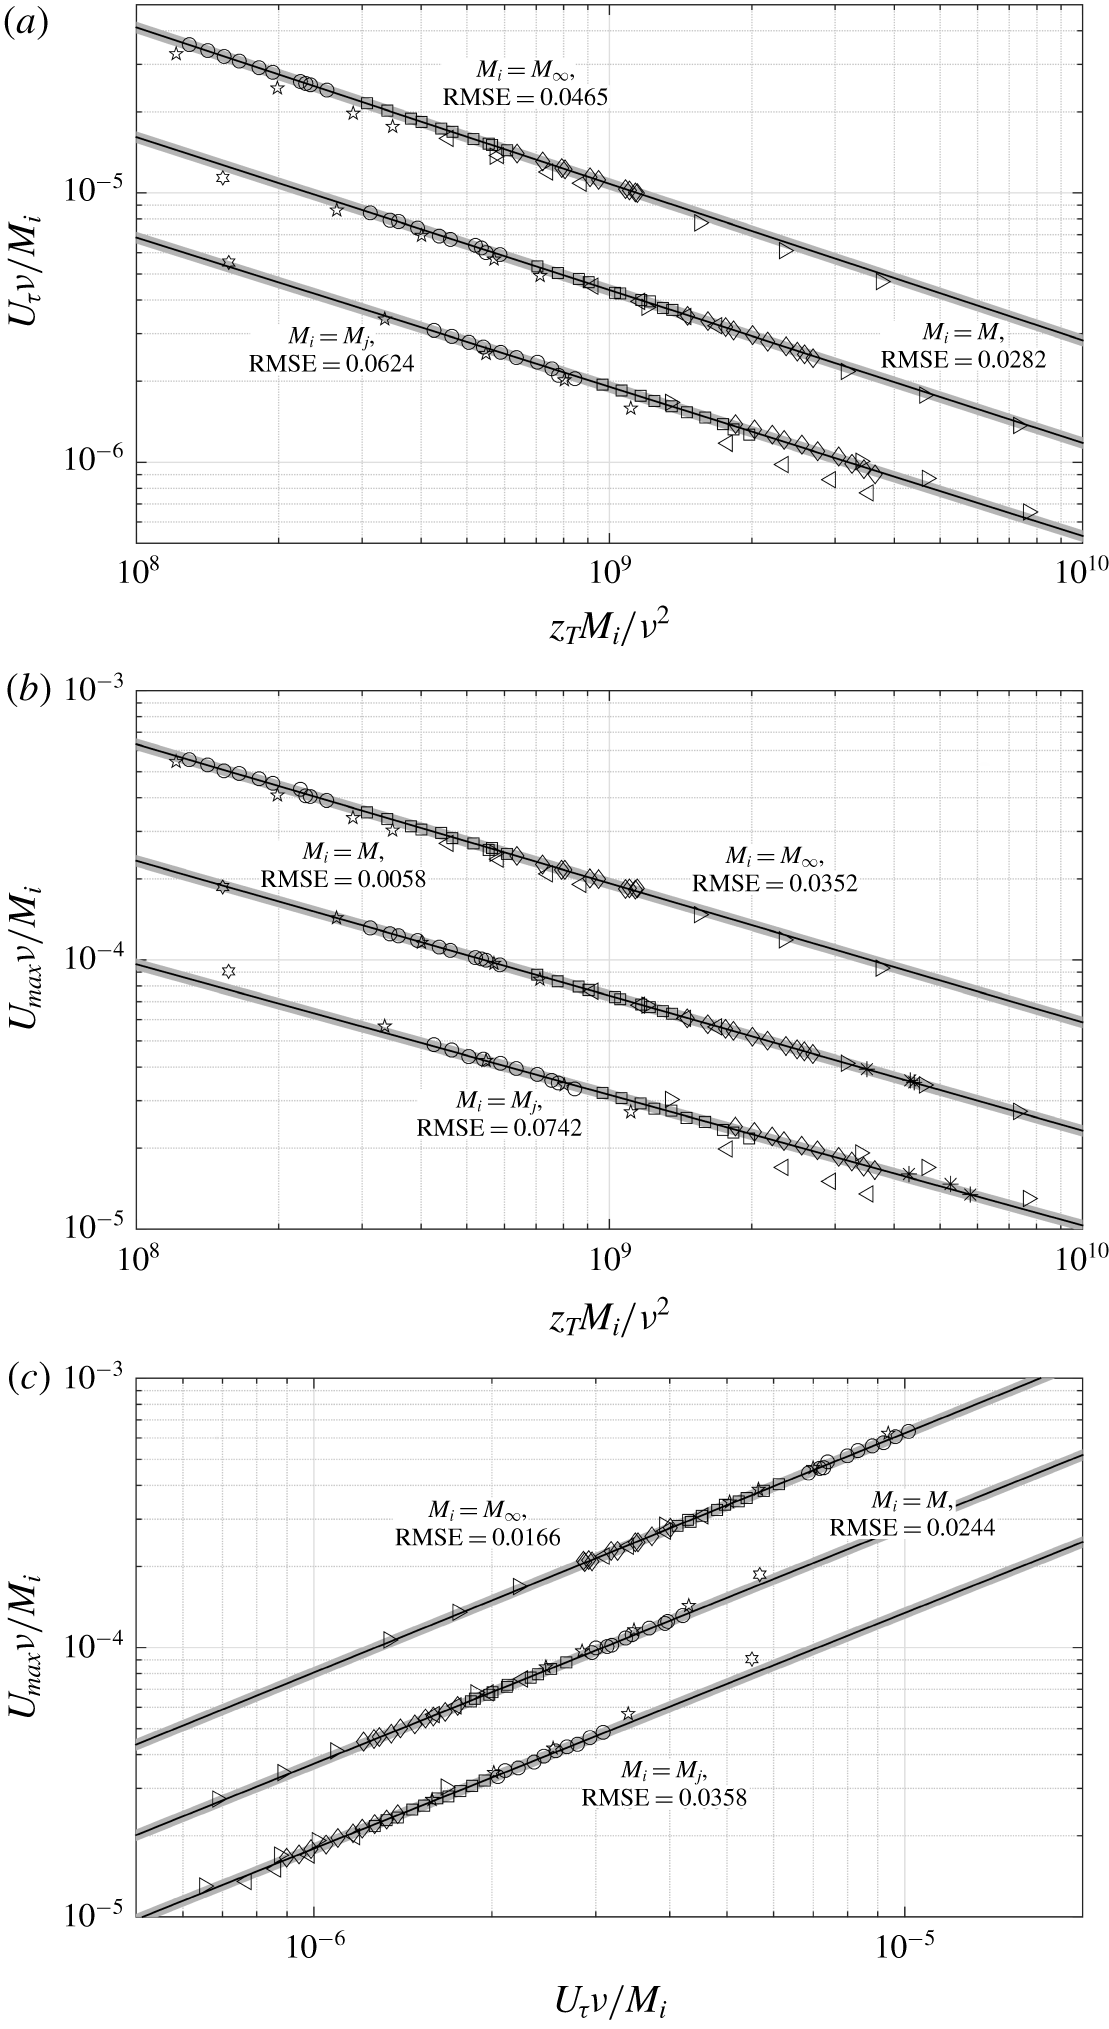
Figure 3(a) shows the plot of  $U_{max}$ as a function of
 $x$ for the data of table 1; note that
 $x$ is measured from the nozzle exit in each case and no adjustment for the virtual origin has been made. Three scaling approaches using
 $M_{j}$,
 $M$ and
 $M_{\infty }$ (ICs, LCs and FCs of §§ 3.1, 3.3 and 3.2, respectively) are shown. Note that
 $M_{\infty }$ has been computed using the procedure given in §8 of Gersten (Reference Gersten2015) which is further elaborated here in appendix B. Also note that
 $xM_{\infty }/\unicode[STIX]{x1D708}^{2}$ is equivalent to the
 $Re_{x}^{2}$ recommended by Gersten (Reference Gersten2015). Solid line in each case, shows the least-squares power-law curve fit to our experimental data (WJ1, WJ2 and WJ3 in table 1) and the shading shows the
 $\pm 5\,\%$ band around the curve fit (and also for subsequent curve fits) to enable visual aid for assessing data collapse. To quantify the quality (goodness) of scaling with each approach, the normalized root-mean-squared error (RMSE) of all the data points is computed with respect to the corresponding curve fit. This RMSE value is mentioned alongside each curve fit; the lower the RMSE value the better is the scaling quality. It is clear that the a much better data collapse is seen with our local scaling approach (
 $M$–
 $\unicode[STIX]{x1D708}$), i.e. with the LCs. Scaling using ICs (
 $M_{j}$–
 $\unicode[STIX]{x1D708}$) clearly shows larger data scatter. Scaling with FCs (
 $M_{\infty }$–
 $\unicode[STIX]{x1D708}$) also shows some data scatter but, more importantly, this approach has limitations since it does not apply to all flows due to the nozzle being located in a perpendicular wall (Gersten Reference Gersten2015) in some cases, such as the Reference Eriksson, Karlsson and PerssonEKP data; these data are, however, included in the plot for completeness. Our approach (using LCs) does not suffer from this limitation and is applicable to all flows. Figures 3(b) and 3(c) respectively show plots of
 $z_{T}$ and
 $U_{\unicode[STIX]{x1D70F}}$ as functions of
 $x$. While
 $M_{j}$,
 $M$ and
 $M_{\infty }$ all give almost similar data collapse for
 $z_{T}$ (almost identical RMSE values in figure 3b),
 $U_{\unicode[STIX]{x1D70F}}$ clearly favours the
 $M$–
 $\unicode[STIX]{x1D708}$ scaling (figure 3c). Also, contrary to the expectation of Reference Narasimha, Narayan and ParthasarathyNYP, our data indicate that
 $M/M_{j}$ is not a universal function of
 $xM_{j}/\unicode[STIX]{x1D708}^{2}$ (not shown). Further,
 $M_{\infty }/M_{j}$ is also not a universal constant (Gersten Reference Gersten2015). Therefore
 $M$ cannot be expressed in terms of either
 $M_{j}$ or
 $M_{\infty }$, and hence may be considered as an independent scaling parameter. Figure 4 shows the data of figure 3 cross-plotted by eliminating the explicit dependence on the streamwise distance
 $x$ (similar to George et al. Reference George, Abrahamsson, Eriksson, Karlsson, Löfdahl and Wosnik2000). These plots also support the broad conclusion that the LCs (
 $M$–
 $\unicode[STIX]{x1D708}$) lead to better data collapse than the ICs or FCs.
Streamwise variations of (a)  $U_{max}$, (b)
 $z_{T}$ and (c)
 $U_{\unicode[STIX]{x1D70F}}$ in the
 $M_{j}$–
 $\unicode[STIX]{x1D708}$ scaling of Reference Narasimha, Narayan and ParthasarathyNYP, the presently proposed ‘local’
 $M$–
 $\unicode[STIX]{x1D708}$ scaling and the
 $M_{\infty }$–
 $\unicode[STIX]{x1D708}$ scaling of Gersten (Reference Gersten2015). Data come from the experiments and simulations listed in table 1. Each solid line shows the least-squares power-law fit to our data (WJ1, WJ2 and WJ3 in table 1). To avoid clutter in each plot, data points and the fitted curve in categories
 $M_{i}=M$ and
 $M_{i}=M_{\infty }$ have been shifted upward using suitable arbitrary multiplying factors. Shading shows the
 $\pm 5\,\%$ band around each curve fit. For each scaling alternative, the RMSE of all data points with respect to the curve fit is also shown.

Cross-plots of (a)  $U_{\unicode[STIX]{x1D70F}}$ and
 $z_{T}$, (b)
 $U_{max}$ and
 $z_{T}$, and (c)
 $U_{max}$ and
 $U_{\unicode[STIX]{x1D70F}}$ for the data of figure 3. Each solid line shows the least-squares power-law fit to our data (WJ1, WJ2 and WJ3 in table 1). To avoid clutter in each plot, data points and fitted curve in categories
 $M_{i}=M$ and
 $M_{i}=M_{\infty }$ have been shifted upward using suitable arbitrary multiplying factors. Shading shows the
 $\pm 5\,\%$ band around each curve fit. For each scaling alternative, the RMSE of all data points with respect to the curve fit is also shown.

In summary, the streamwise variations of  $U_{max}$,
 $z_{T}$ and
 $U_{\unicode[STIX]{x1D70F}}$ exhibit robust scaling behaviour in the local
 $M$–
 $\unicode[STIX]{x1D708}$ framework irrespective of the facility, working fluid and whether the nozzle is located in a wall perpendicular to the test surface or not. Thus, the basic condition for self-similarity, i.e. lack of any imposed length or velocity scales, is met.
4 Scaling mean velocity profiles
Having demonstrated that the wall jet development is essentially governed by the local scaling parameters, we now proceed to the scaling of mean velocity profiles. Since ICs and FCs are not involved, the only possible complication that could now arise is the dependence of the velocity profile on local  $Re_{\unicode[STIX]{x1D70F}}$ (see § 1).
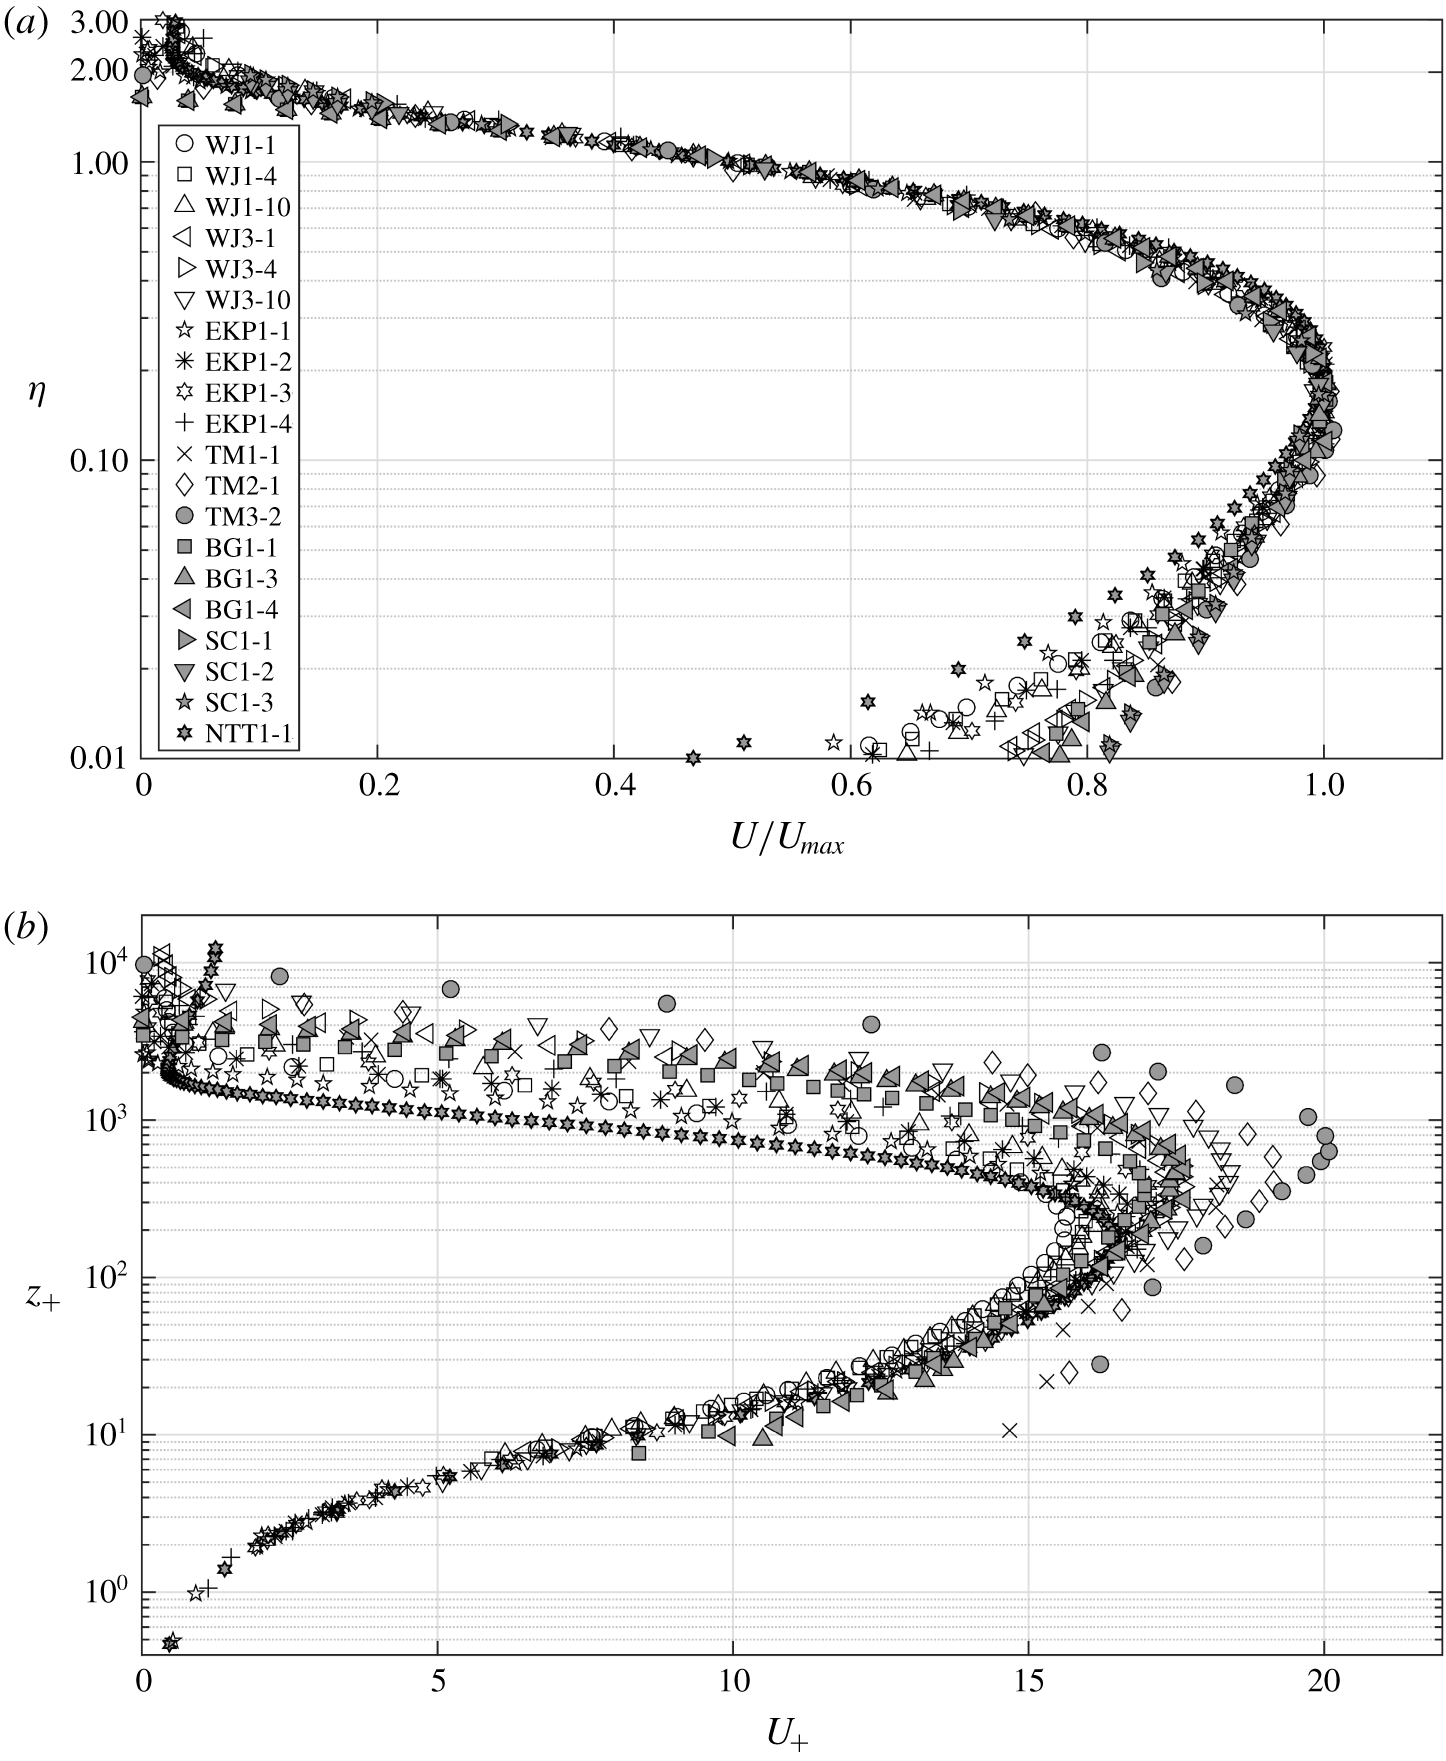
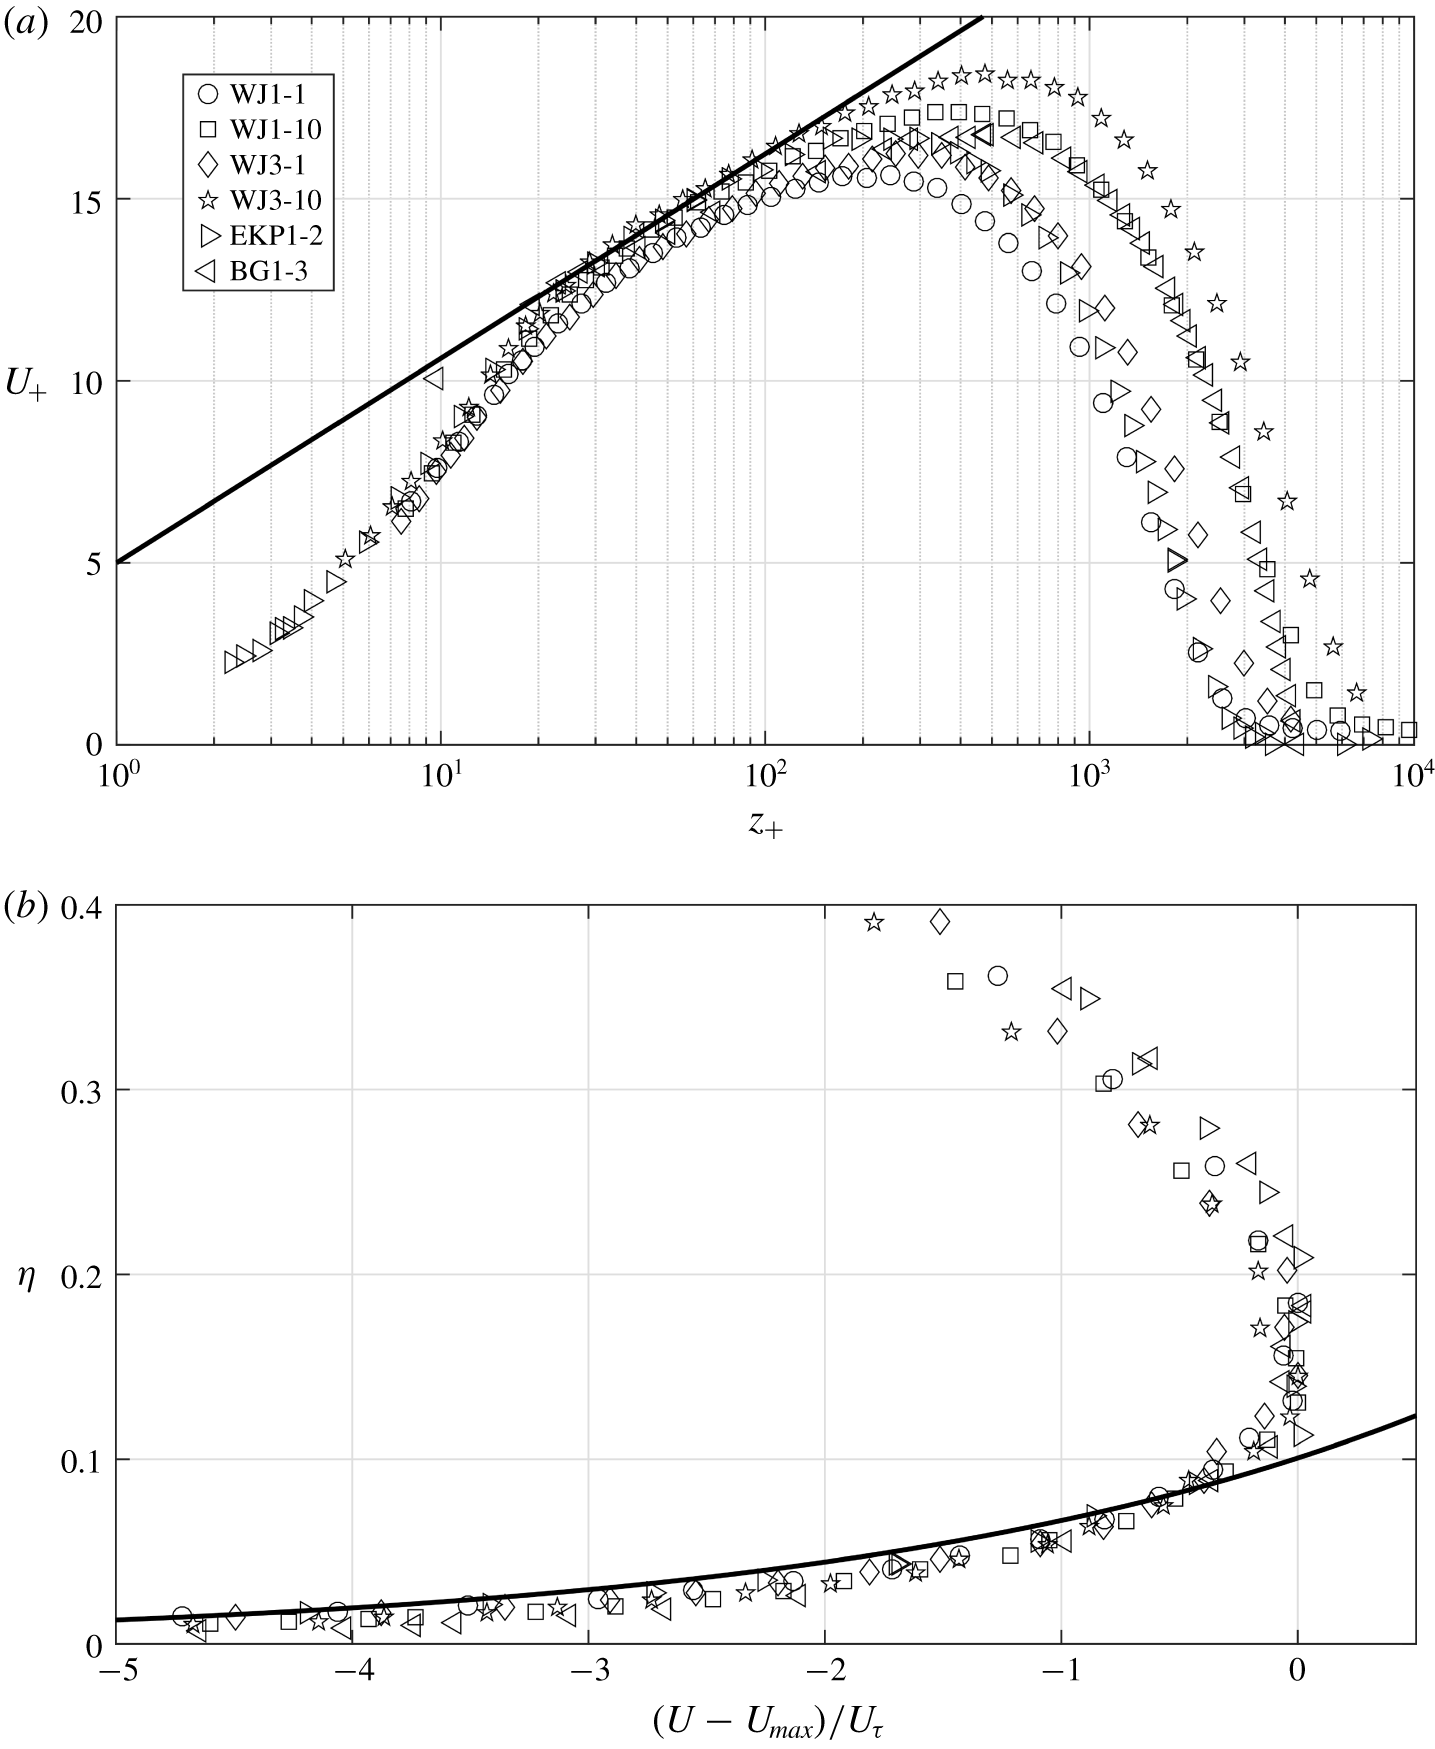
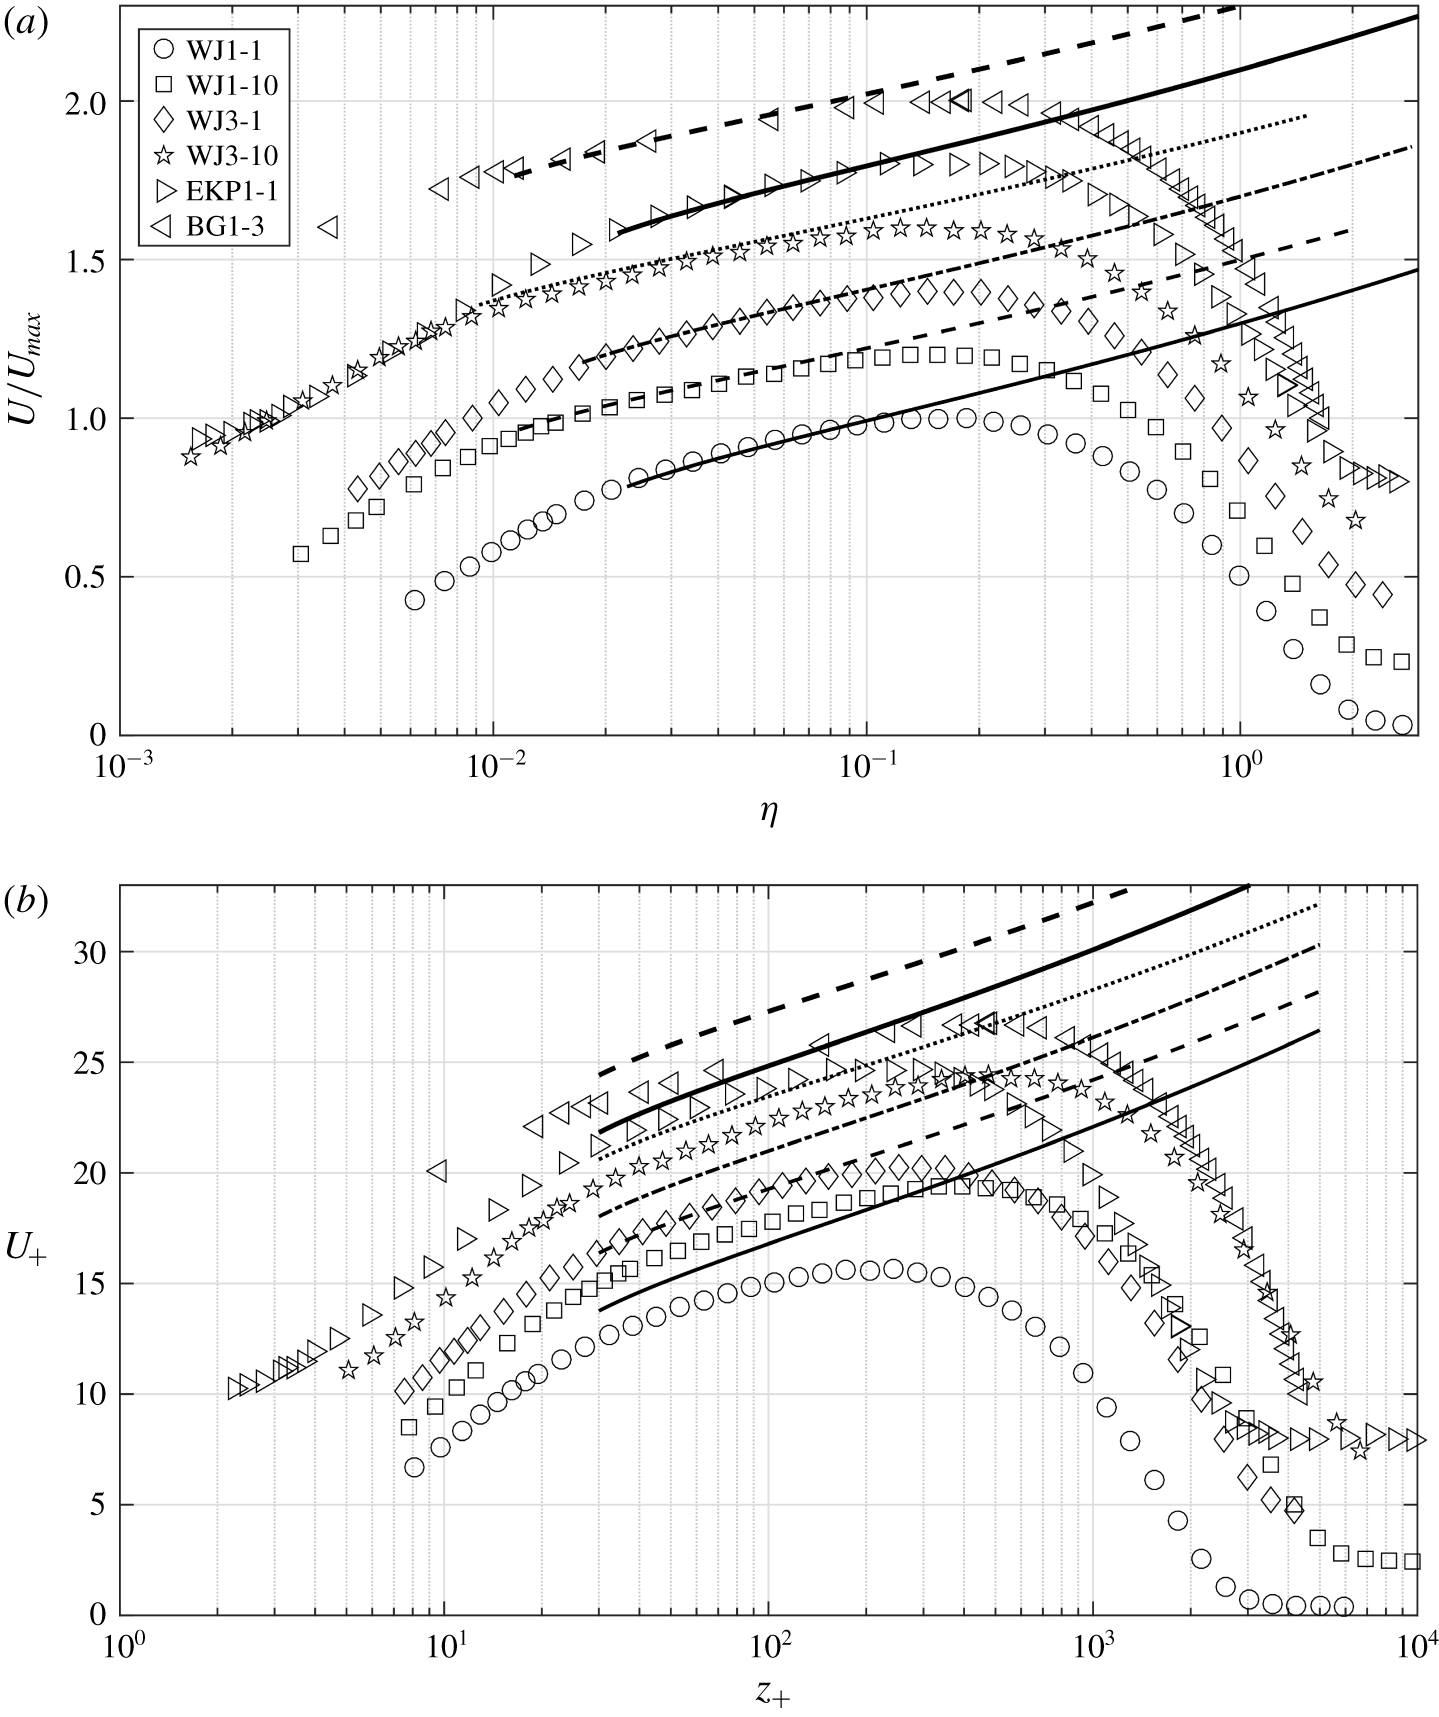
Mean velocity profiles for the data sets listed in table 1 in (a) outer and (b) inner coordinates. Panel (b) does not contain Reference Schwarz and CosartSC data since  $U_{\unicode[STIX]{x1D70F}}$ was not measured in those experiments.

4.1 Self-similar inner and outer regions
We first plot mean velocity profiles in classical outer or jet ( $U/U_{max}$ versus
 $\unicode[STIX]{x1D702}$, figure 5a) and inner or wall (
 $U_{+}$ versus
 $z_{+}$, figure 5b) coordinates to look for any meaningful scaling;
 $\unicode[STIX]{x1D702}=z/z_{T}$,
 $U_{+}=U/U_{\unicode[STIX]{x1D70F}}$ and
 $z_{+}=zU_{\unicode[STIX]{x1D70F}}/\unicode[STIX]{x1D708}$. For the entire range of Reynolds numbers covered here, figure 5(a) shows that all the data exhibit excellent scaling (self-similarity) in the outer region, including the velocity maximum and a small extent below it. The observation that the outer (jet) scaling holds even below the velocity maximum, suggests that the outer flow is in fact akin to a full-free jet rather than a half-free jet as contended by many other studies; this will be discussed later in § 4.4 in some detail. Note that the outer-scaled profiles show some scatter in the region close to the edge of the wall jet (see figure 7 of George et al. (Reference George, Abrahamsson, Eriksson, Karlsson, Löfdahl and Wosnik2000), also). This could be due to the differences in the outer boundary condition such as reverse flow in the Reference Eriksson, Karlsson and PerssonEKP set-up or co-flow in the Reference Naqavi, Tyacke and TuckerNTT data (see § 3.4) as well as larger uncertainties in hot-wire measurements due to low velocities near the edge (Deo, Mi & Nathan Reference Deo, Mi and Nathan2008). Figure 5(b) shows the same data in the inner (wall) coordinates. Reference Bradshaw and GeeBG and Reference Tailland and MathieuTM data clearly show the wall proximity effect affecting the first few near-wall points in the hot-wire profiles; the effect is very severe in the Reference Tailland and MathieuTM profiles, leading to spuriously high values of
 $U_{+}$. Reference Schwarz and CosartSC data are not plotted because
 $U_{\unicode[STIX]{x1D70F}}$ has not been measured in their experiments. Notwithstanding these difficulties, remarkably robust scaling is evident for all the other data in the near-wall region (figure 5b). Thus, the mean velocity data support classical inner and outer scalings (self-similarity) respectively of the form
 $$\begin{eqnarray}\displaystyle & \displaystyle U_{+}=f(z_{+}), & \displaystyle\end{eqnarray}$$
 $$\begin{eqnarray}\displaystyle & \displaystyle U/U_{max}=g(\unicode[STIX]{x1D702}), & \displaystyle\end{eqnarray}$$
where  $f$ and
 $g$ are universal functions independent of
 $Re_{\unicode[STIX]{x1D70F}}$ (at least to the lowest order).
4.2 Overlap layer analysis
Figures 5(a) and 5(b) indicate that the overlap of outer and inner scalings in wall jets is expected to occur below the velocity maximum. Matching  $U$ and
 $\unicode[STIX]{x2202}U/\unicode[STIX]{x2202}z$ from the inner (4.1) and outer (4.2) descriptions in the overlap layer leads to
 $$\begin{eqnarray}\frac{\text{d}\ln f}{\text{d}\ln z_{+}}=\frac{\text{d}\ln g}{\text{d}\ln \unicode[STIX]{x1D702}}.\end{eqnarray}$$
Note that (4.3) is only superficially similar to (8.3) from George et al. (Reference George, Abrahamsson, Eriksson, Karlsson, Löfdahl and Wosnik2000); the main difference is that, within the framework of George et al.,  $f$ and
 $g$ essentially depend on
 $Re_{\unicode[STIX]{x1D70F}}$ whereas in (4.3) they are independent of
 $Re_{\unicode[STIX]{x1D70F}}$ (due to (4.1) and (4.2)). Next, it is known that the solution to (4.3) is invariant under the transformation
 $z\rightarrow z+\unicode[STIX]{x1D6FC}$, where
 $\unicode[STIX]{x1D6FC}$ is an arbitrary shift in the origin for
 $z$ (see George et al. Reference George, Abrahamsson, Eriksson, Karlsson, Löfdahl and Wosnik2000). Alternatively, we note that (4.3) also permits the transformation
 $U\rightarrow U+\unicode[STIX]{x1D6FD}$, where
 $\unicode[STIX]{x1D6FD}$ is an arbitrary shift in the origin for
 $U$. Physically, either of these shifts accounts for a finite slip velocity at the wall since the overlap layer profile cannot satisfy the inner (no-slip) boundary condition due to matching of the inner layer with the outer layer. In what follows, we replace
 $U$ by
 $\widetilde{U}=U+\unicode[STIX]{x1D6FD}$, so that
 $\widetilde{f}=\widetilde{U}/U_{\unicode[STIX]{x1D70F}}=f+\unicode[STIX]{x1D6FD}_{+}$ and
 $\widetilde{g}=\widetilde{U}/U_{max}=g+\left(\unicode[STIX]{x1D6FD}/U_{max}\right)$. Since the left and right sides of (4.3) are purely functions of
 $z_{+}$ and
 $\unicode[STIX]{x1D702}$, respectively, each side must be equal to a universal constant, say
 $A$. Integrating
 $\text{d}\ln \widetilde{f}/\text{d}\ln z_{+}=A$ leads to
 $\ln \widetilde{f}=A\ln z_{+}+B^{\prime }$ in the overlap layer. Note that while
 $B^{\prime }$ must be constant with respect to
 $z_{+}$ in the overlap layer, mathematically, nothing precludes it from being a function of the local Reynolds number
 $Re_{\unicode[STIX]{x1D70F}}$. Physically, this is closely related to the mesolayer discussed in detail in § 4.4. Rewriting
 $B^{\prime }=A\ln B+\ln D$ yields
 $$\begin{eqnarray}\widetilde{f}=Dz_{+}^{A}B^{A},\end{eqnarray}$$
where  $B(Re_{\unicode[STIX]{x1D70F}})$ and
 $D(Re_{\unicode[STIX]{x1D70F}})$ are unknown functions still to be determined. Similarly,
 $\text{d}\ln \widetilde{g}/\text{d}\ln \unicode[STIX]{x1D702}=A$ leads to
 $$\begin{eqnarray}\widetilde{g}=E\unicode[STIX]{x1D702}^{A}C^{A},\end{eqnarray}$$
where  $E(Re_{\unicode[STIX]{x1D70F}})$ and
 $C(Re_{\unicode[STIX]{x1D70F}})$ are functions unknown as yet. Clearly, (4.4) and (4.5) do not scale the mean velocity profiles at different
 $Re_{\unicode[STIX]{x1D70F}}$ in the overlap layer in classical inner and outer coordinates (figures 5a and 5b). However, if one rearranges (4.4) and (4.5) as
 $$\begin{eqnarray}\displaystyle & \displaystyle (\widetilde{f}/D)=(z_{+}B)^{A}, & \displaystyle\end{eqnarray}$$
 $$\begin{eqnarray}\displaystyle & \displaystyle (\widetilde{g}/E)=(\unicode[STIX]{x1D702}C)^{A}, & \displaystyle\end{eqnarray}$$
then  $\widetilde{f}/D$ and
 $\widetilde{g}/E$ could become universal functions of
 $z_{+}B$ and
 $\unicode[STIX]{x1D702}C$, respectively. In order to proceed further with this contention, the functional forms of
 $B,C,D$ and
 $E$ are required to be determined.
Note that  $z_{+}B$ and
 $\unicode[STIX]{x1D702}C$ are both akin to the so-called intermediate variable that is commonly used in the asymptotic analysis of multiscale problems (Kevorkian & Cole Reference Kevorkian and Cole2013). Physically, the role of function
 $B$(
 $C$) is to ‘rescale’
 $z_{+}(\unicode[STIX]{x1D702})$ appropriately so that the overlap region remains in focus, i.e.
 $z_{+}B(\unicode[STIX]{x1D702}C)$ remains of
 $O(1)$ although
 $z_{+}\rightarrow \infty (\unicode[STIX]{x1D702}\rightarrow 0)$ as
 $Re_{\unicode[STIX]{x1D70F}}\rightarrow \infty$. Therefore, by the definition of an intermediate variable,
 $z_{+}B\sim \unicode[STIX]{x1D702}C$. Next, if one assumes power-law functional forms
 $B\sim Re_{\unicode[STIX]{x1D70F}}^{m}$ and
 $C\sim Re_{\unicode[STIX]{x1D70F}}^{n}$, then the condition
 $z_{+}B\sim \unicode[STIX]{x1D702}C$ leads to the constraint
 $1+m=n$ on the constants
 $m$ and
 $n$. In order to estimate the individual values of
 $m$ and
 $n$, we need additional information. Towards this, we note that since
 $Re_{\unicode[STIX]{x1D70F}}$ assumes importance in the mean-velocity overlap layer in wall jets (through functions
 $B$ and
 $C$ in (4.6) and (4.7), respectively), this layer could correspond to the mesolayer that is studied extensively in the literature on mean momentum balance in wall-bounded flows (George et al. Reference George, Abrahamsson, Eriksson, Karlsson, Löfdahl and Wosnik2000; Wei et al. Reference Wei, Fife, Klewicki and McMurtry2005); it will be demonstrated later (§ 4.4) from DNS data that this indeed is the case. The momentum-balance mesolayer in canonical wall-bounded flows occurs around the location of maximum Reynolds shear stress where the Reynolds stress gradient term in the mean momentum equation loses its dynamical significance (Afzal Reference Afzal1982; Sreenivasan & Sahay Reference Sreenivasan, Sahay and Panton1997; Wei et al. Reference Wei, Fife, Klewicki and McMurtry2005) and this location scales as
 $z_{+}\sim \sqrt{Re_{\unicode[STIX]{x1D70F}}}$. As we shall see later, DNS data show the existence (very similar to other wall-bounded flows) of a momentum-balance mesolayer in wall jets as well. Therefore, assuming that the mean-velocity overlap layer in the present analysis coincides with the momentum-balance mesolayer in wall jets, one has
 $z_{+}\sim \sqrt{Re_{\unicode[STIX]{x1D70F}}}$ in the mean-velocity overlap layer. Since
 $z_{+}B\sim O(1)$ in the mean-velocity overlap layer, it follows that
 $B\sim 1/\sqrt{Re_{\unicode[STIX]{x1D70F}}}$, i.e.
 $m=-1/2$ and, consequently, the constraint
 $1+m=n$ yields
 $n=1/2$, i.e.
 $C\sim \sqrt{Re_{\unicode[STIX]{x1D70F}}}$.
Since  $z_{+}B\sim \unicode[STIX]{x1D702}C$ and
 $A$ is a universal constant, (4.6) and (4.7) imply
 $(\widetilde{f}/D)\sim (\widetilde{g}/E)$. Physically, functions
 $D$ and
 $E$ represent
 $Re_{\unicode[STIX]{x1D70F}}$-dependent modulation of the inner and outer velocity scales, respectively. For wall jets without an external stream, the jet momentum is expected to overwhelm the drag at the surface as
 $Re_{\unicode[STIX]{x1D70F}}\rightarrow \infty$ (Gersten Reference Gersten2015) with the asymptotic state being a half-free jet (see § 4.4). Therefore, the effect of the wall in the overlap region on the outer velocity scale (
 $Re_{\unicode[STIX]{x1D70F}}$ dependence) may be expected to be very weak and enter only in the length scale. Therefore, to the lowest order, it is reasonable to assume
 $E(Re_{\unicode[STIX]{x1D70F}})\approx \text{const.}$ in the overlap layer. With this,
 $D(Re_{\unicode[STIX]{x1D70F}})\sim \widetilde{f}/\widetilde{g}\sim U_{max}/U_{\unicode[STIX]{x1D70F}}$ and the velocity profile ((4.6) and (4.7)) in the overlap layer scales according to either of the two equivalent relations
 $$\begin{eqnarray}\displaystyle & \displaystyle \widetilde{f}/D=K_{i}(z_{+}/\sqrt{Re_{\unicode[STIX]{x1D70F}}})^{A}, & \displaystyle\end{eqnarray}$$
 $$\begin{eqnarray}\displaystyle & \displaystyle \widetilde{g}=K_{o}(\unicode[STIX]{x1D702}\sqrt{Re_{\unicode[STIX]{x1D70F}}})^{A}, & \displaystyle\end{eqnarray}$$
where  $K_{i}$,
 $K_{o}$ and
 $A$ are universal constants. We shall now focus on (4.9). Note that
 $\widetilde{g}=g+(\unicode[STIX]{x1D6FD}/U_{max})$, where
 $\unicode[STIX]{x1D6FD}$ is constant for a given profile. Therefore
 $\unicode[STIX]{x1D6FD}/U_{max}$ could be a function of
 $Re_{\unicode[STIX]{x1D70F}}$. However, the same arguments that led to
 $E\left(Re_{\unicode[STIX]{x1D70F}}\right)\approx \text{const.}$, indicate that, to the lowest order, one may expect
 $\unicode[STIX]{x1D6FD}/U_{max}\approx \text{const}$. With this, (4.9) simplifies to
 $$\begin{eqnarray}\frac{U}{U_{max}}=K_{o}(\unicode[STIX]{x1D702}\sqrt{Re_{\unicode[STIX]{x1D70F}}})^{A}-\frac{\unicode[STIX]{x1D6FD}}{U_{max}},\end{eqnarray}$$
indicating that the mean velocity profiles in the overlap region scale (collapse) in the coordinates  $U/U_{max}$ versus
 $\unicode[STIX]{x1D702}\sqrt{Re_{\unicode[STIX]{x1D70F}}}$.
4.3 Overlap scaling in the experimental data
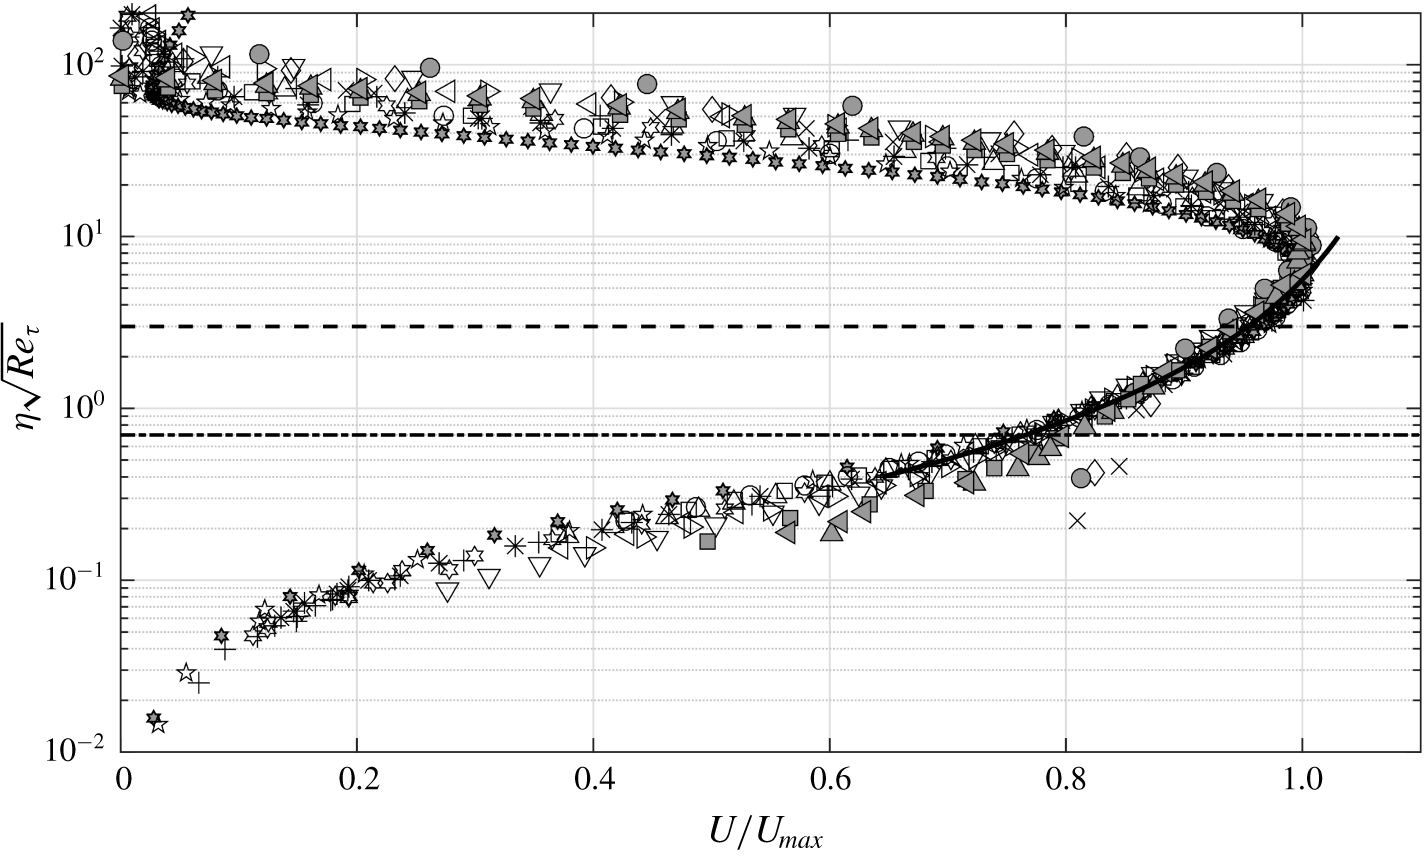
Figure 6 shows all the data in table 1 (except the Reference Schwarz and CosartSC data) plotted in coordinates  $U/U_{max}$ versus
 $\unicode[STIX]{x1D702}\sqrt{Re_{\unicode[STIX]{x1D70F}}}$ as suggested by (4.10). Indeed, all the data collapse remarkably well in the region where overlap is expected to occur. The collapse extends over the range
 $0.7\leqslant \unicode[STIX]{x1D702}\sqrt{Re_{\unicode[STIX]{x1D70F}}}\leqslant 3$, i.e. 42 % of a decade in
 $\unicode[STIX]{x1D702}\sqrt{Re_{\unicode[STIX]{x1D70F}}}$; the extent of this region is decided empirically by observation. Least-squares fit of (4.10) to all of the data of figure 6 over this range, yields the values for the universal constants as
 $K_{o}=-0.2879$,
 $A=-0.5346$ and
 $\unicode[STIX]{x1D6FD}/U_{max}=-1.1145$. More data from future high-Reynolds-number experiments on wall jets would help accurate determination of these universal constants.
Mean velocity profiles for the data sets listed in table 1 (except for the Reference Schwarz and CosartSC data) in the overlap layer scaling. Ordinate is the intermediate variable  $\unicode[STIX]{x1D702}\sqrt{Re_{\unicode[STIX]{x1D70F}}}$ or
 $z_{+}/\sqrt{Re_{\unicode[STIX]{x1D70F}}}$. Solid line is the least-squares curve fit of (4.10) to all data between the dashed line and the dashed-dotted line (
 $0.7\leqslant \unicode[STIX]{x1D702}\sqrt{Re_{\unicode[STIX]{x1D70F}}}\leqslant 3$). The curve is extended beyond these limits for visual aid. For symbols, refer to the legend of figure 5(a).

Note that the position and extent of the mean-velocity overlap are fixed in  $\unicode[STIX]{x1D702}\sqrt{Re_{\unicode[STIX]{x1D70F}}}$ or
 $z_{+}/\sqrt{Re_{\unicode[STIX]{x1D70F}}}$ and not in
 $\unicode[STIX]{x1D702}$ or
 $z_{+}$. In fact, with increasing Reynolds number, the position of the overlap layer is expected to shift towards the wall and its extent is expected to reduce in the
 $\unicode[STIX]{x1D702}$ coordinate; the opposite is expected to be true for the
 $z_{+}$ coordinate. We shall come back to this point in the next section.
4.4 Layered structure
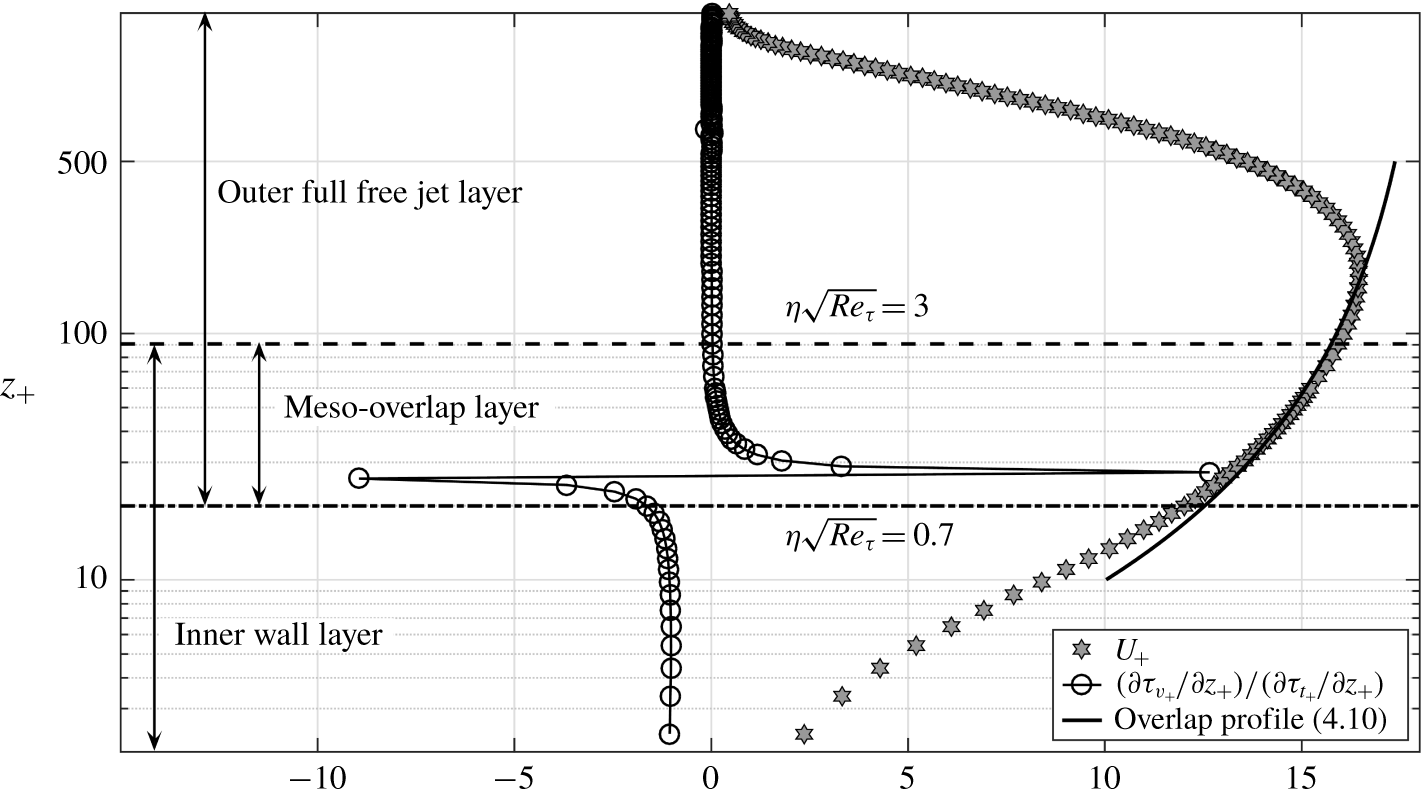
Correspondence between the mean-velocity overlap layer and the momentum-balance mesolayer in wall jets. Inner-scaled profiles are shown for the mean velocity and the ratio of viscous stress gradient to the Reynolds shear stress gradient for the flow NTT1-1 (DNS data) of table 1. Dashed and dashed-dotted lines respectively denote the outer and inner limits  $\unicode[STIX]{x1D702}\sqrt{Re_{\unicode[STIX]{x1D70F}}}=3$ and
 $\unicode[STIX]{x1D702}\sqrt{Re_{\unicode[STIX]{x1D70F}}}=0.7$ of the mean-velocity overlap layer for
 $Re_{\unicode[STIX]{x1D70F}}=865$. These limits have been fixed empirically in figure 6. Sharp flip in the stress gradient ratio is characteristic of the momentum-balance mesolayer.

In order to gain insight into the layered structure of wall jet flow, we plot in figure 7 the profile of the ratio of viscous stress gradient ( $\unicode[STIX]{x2202}\unicode[STIX]{x1D70F}_{v+}/\unicode[STIX]{x2202}z_{+}=\unicode[STIX]{x2202}^{2}U_{+}/\unicode[STIX]{x2202}z_{+}^{2}$) to the Reynolds shear stress gradient (
 $\unicode[STIX]{x2202}\unicode[STIX]{x1D70F}_{t+}/\unicode[STIX]{x2202}z_{+}=\unicode[STIX]{x2202}(-\overline{u_{+}^{\prime }w_{+}^{\prime }})/\unicode[STIX]{x2202}z_{+}$) for the DNS data (flow NTT1-1 in table 1) of Naqavi et al. (Reference Naqavi, Tyacke and Tucker2018);
 $u^{\prime }$ and
 $w^{\prime }$ are velocity fluctuations in the streamwise and wall-normal directions, respectively, and overbar denotes time average. Also plotted alongside are the mean velocity profile and the overlap layer profile (4.10). We observe that, as far as the mean momentum balance is concerned, the layered structure of a wall jet is qualitatively very similar to that of channels and TBLs (Wei et al. Reference Wei, Fife, Klewicki and McMurtry2005). This suggests that the momentum-balance approach does not distinguish between the jet or wake character of the outer layer in these flows, a fact that is not surprising given the nonlinear character of the Navier–Stokes equations and differences in boundary conditions in these flows. The innermost region is characterized by the balance of viscous and Reynolds shear stress gradients (ratio
 ${\approx}-1$) with advection being negligibly small. In the outer region, advection balances the Reynolds shear stress gradient with the viscous stress gradient being negligibly small (ratio
 ${\approx}0$). The sharp flip in the ratio
 $(\unicode[STIX]{x2202}\unicode[STIX]{x1D70F}_{v+}/\unicode[STIX]{x2202}z_{+})/(\unicode[STIX]{x2202}\unicode[STIX]{x1D70F}_{t+}/\unicode[STIX]{x2202}z_{+})$ from large negative to large positive values indicates the mesolayer where the Reynolds shear stress reaches a maximum and viscous effects dominate the dynamics even at distances much further away from the viscous sublayer. The extent of the mean-velocity overlap layer for this flow is shown by horizontal dashed and dashed-dotted lines in figure 7. It is clear that the mean-velocity overlap layer, whose extent is decided empirically from the mean-velocity data (figure 6), matches quite well with the momentum-balance mesolayer. This a posteriori justifies the assumption
 $z_{+}\sim \sqrt{Re_{\unicode[STIX]{x1D70F}}}$ for the mean-velocity overlap layer in wall jets and provides a dynamical basis for the matching arguments of § 4.2. Despite the fact that the DNS flow might still not have reached the fully developed state (largest
 $x/b$ is
 $35$ only) and the flow Reynolds number is also relatively low (
 $Re_{\unicode[STIX]{x1D70F}}=865$ only), the mean velocity profile in the overlap layer in figure 7 is quite close to the curve of (4.10).
Two important quantitative differences, however, exist when one compares wall jets with canonical channel and TBL flows. First, it may be noted that, for channel and TBL flows, the location of the Reynolds shear stress maximum (or the location of the flip in the stress gradient ratio and hence the mesolayer) moves outwards from the wall in inner coordinates with increasing Reynolds number. For  $Re_{\unicode[STIX]{x1D70F}}\approx 590$, the maximum is located at
 $z_{+}\approx 45$ for channel flow DNS data (see figure 1 of Wei et al. (Reference Wei, Fife, Klewicki and McMurtry2005)). Similarly for
 $Re_{\unicode[STIX]{x1D70F}}\approx 650$, the maximum is located at
 $z_{+}\approx 55$ for TBL DNS data (see figure 3 of Wei et al. (Reference Wei, Fife, Klewicki and McMurtry2005)). For the wall jet data NTT1-1 of table 1 and figure 7, however, the Reynolds shear stress maximum occurs much closer to the wall, i.e. below
 $z_{+}=30$ at
 $Re_{\unicode[STIX]{x1D70F}}=865$. This observation is consistent with a thinner linear sublayer in wall jets compared to canonical flows (see § 3.4) and clearly shows that, for the same Reynolds number, the influence of the outer full-jet flow penetrates deeper into the near-wall region in wall jets than the influence of the outer wake flow in the case of channels and TBLs. Second, the width of the mesolayer in channels and TBLs in the
 $z_{+}$ coordinate is approximately equal to
 $\sqrt{Re_{\unicode[STIX]{x1D70F}}}$ (Wei et al. Reference Wei, Fife, Klewicki and McMurtry2005). For wall jets, on the other hand, the width of the mean-velocity overlap layer is approximately
 $2.3\sqrt{Re_{\unicode[STIX]{x1D70F}}}$ in the
 $z_{+}$ coordinate (see figure 6). Thus the mean-velocity overlap layer in wall jets appears to be wider than the mesolayer in channels and TBLs.
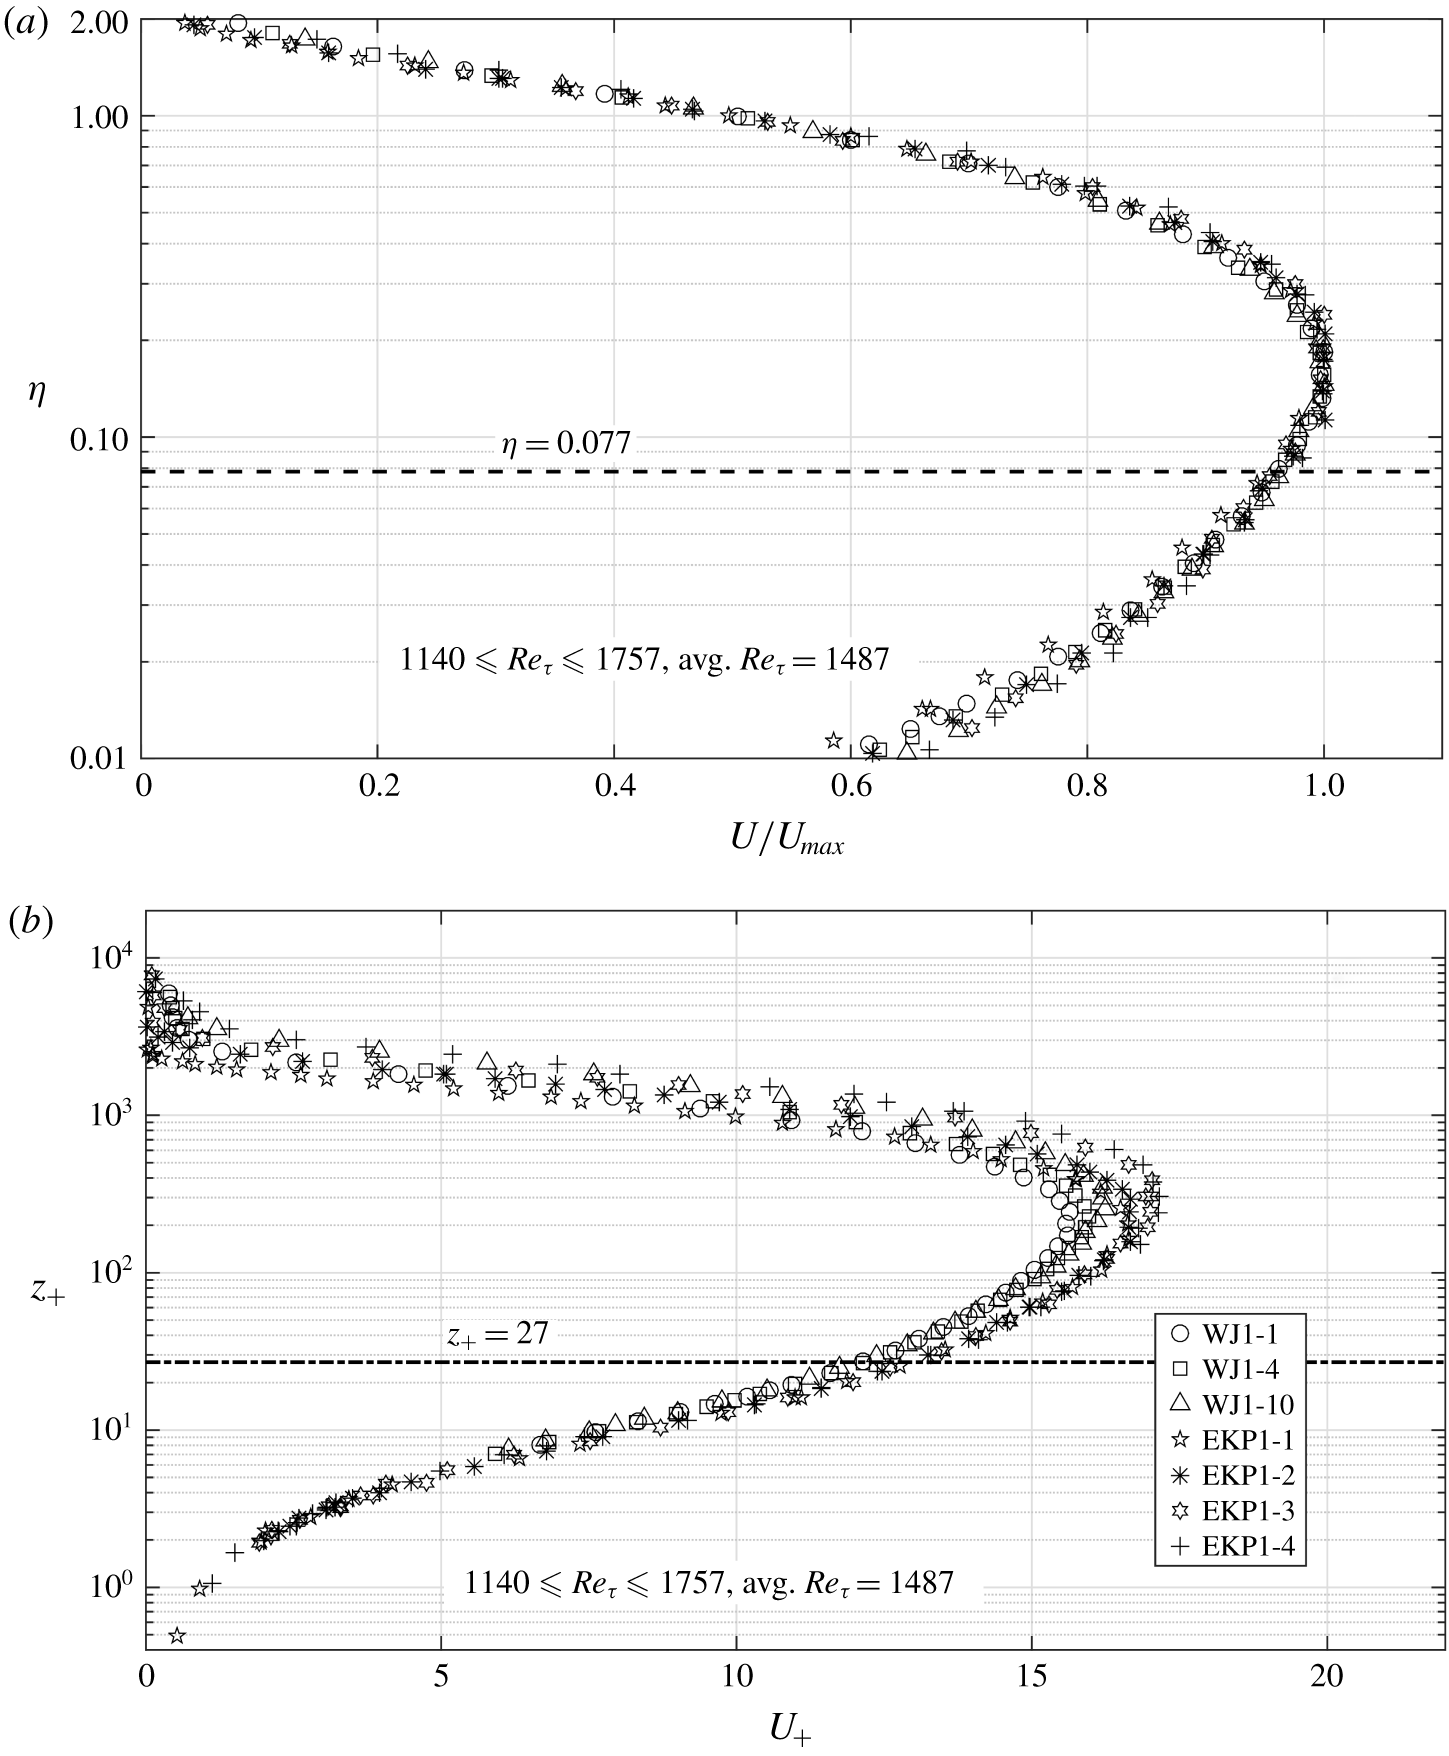
(a) Outer and (b) inner scaling for the low-Reynolds-number wall jets of table 1. Dashed line in panel (a) denotes the outer limit  $\unicode[STIX]{x1D702}=0.077$ of the overlap layer computed from
 $\unicode[STIX]{x1D702}\sqrt{Re_{\unicode[STIX]{x1D70F}}}=3$ for the average
 $Re_{\unicode[STIX]{x1D70F}}=1487$. Dashed-dotted line in panel (b) denotes the inner limit
 $z_{+}=27$ of the overlap layer computed from
 $\unicode[STIX]{x1D702}\sqrt{Re_{\unicode[STIX]{x1D70F}}}=0.7$ for the same average
 $Re_{\unicode[STIX]{x1D70F}}$.

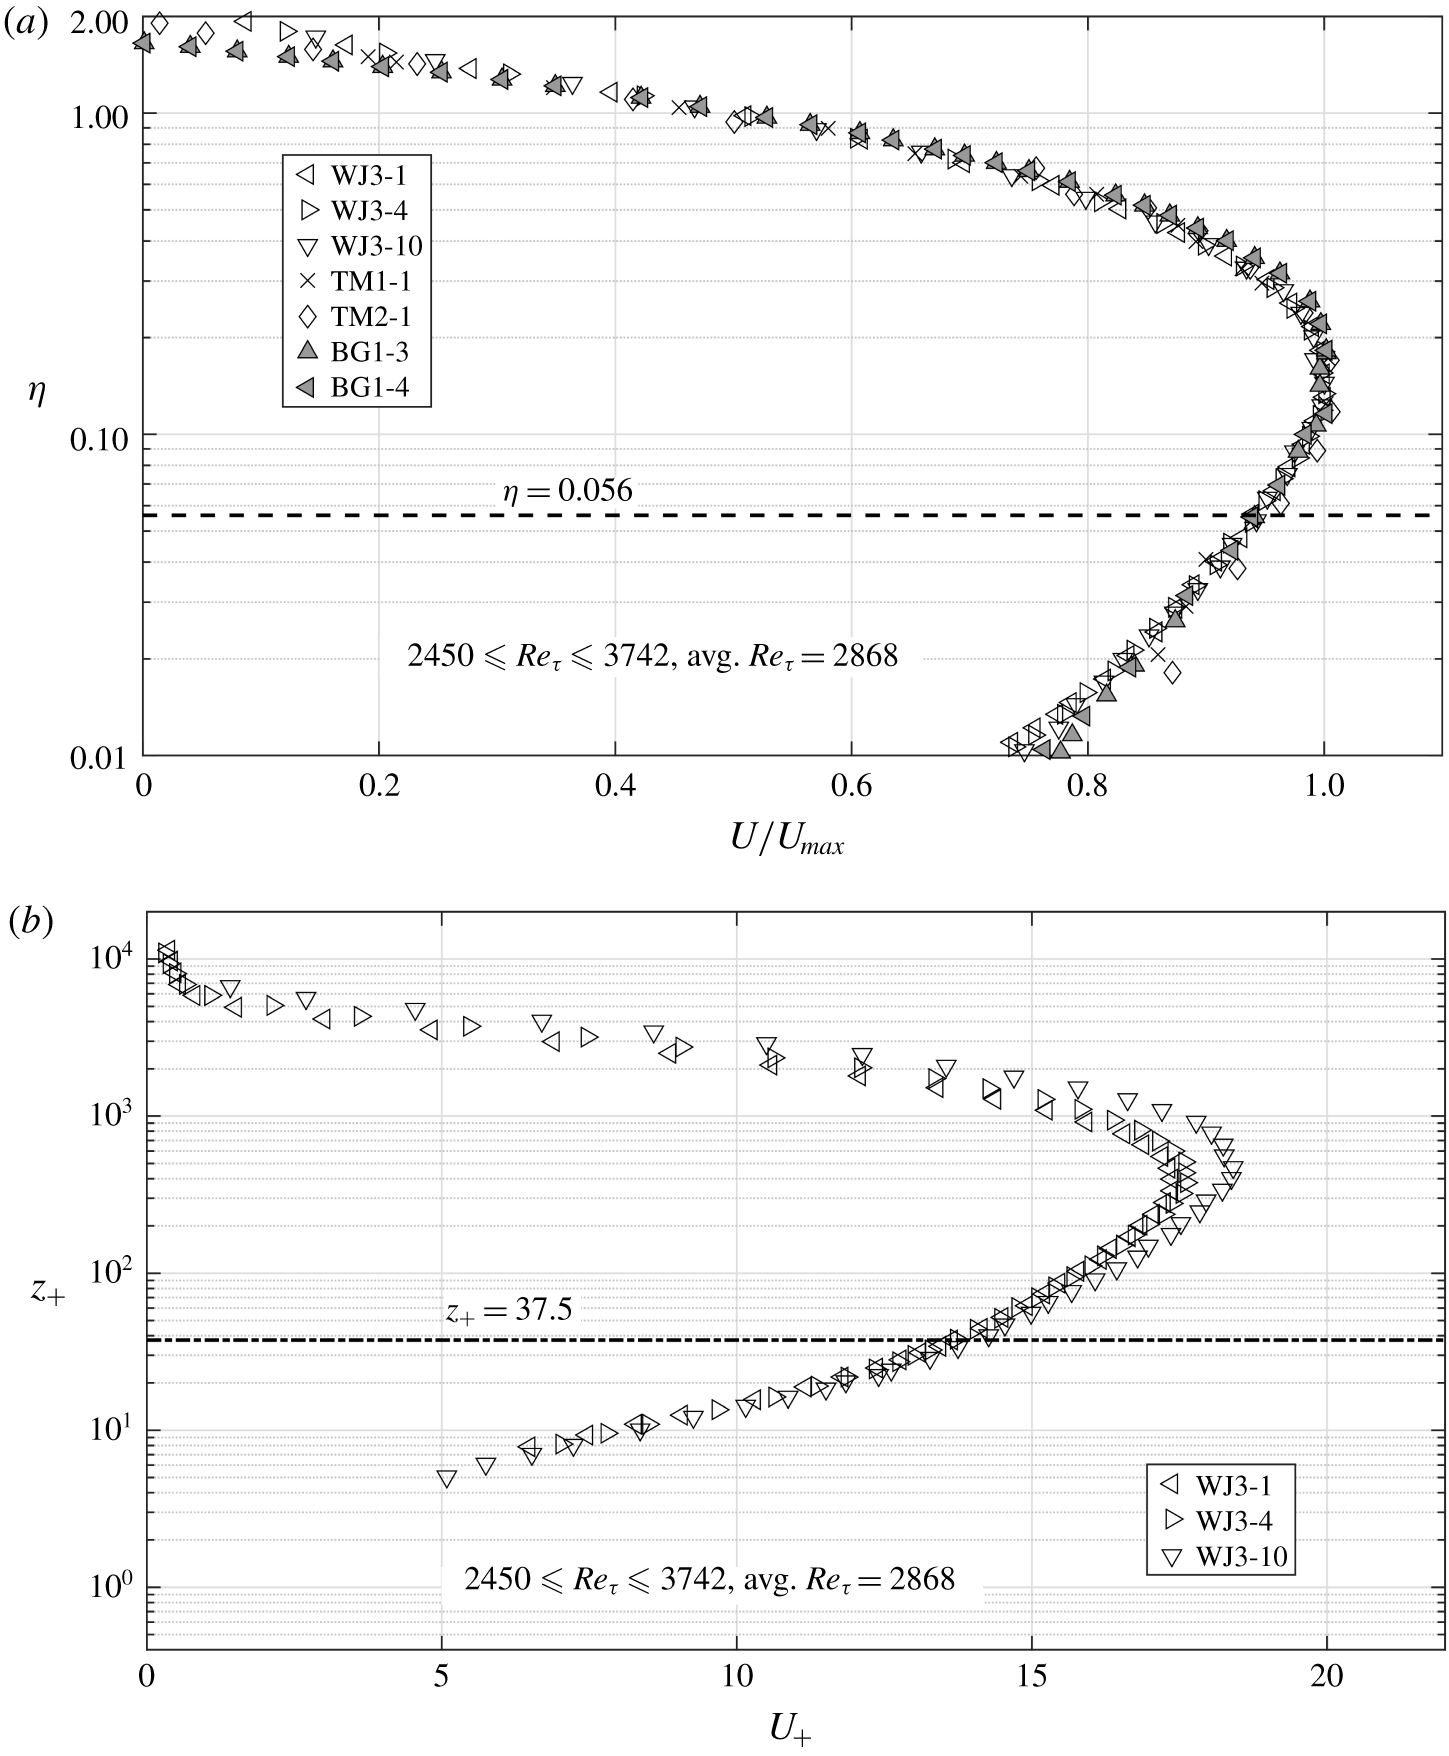
(a) Outer and (b) inner scaling for high-Reynolds-number wall jets of table 1. Dashed line in panel (a) denotes the outer limit  $\unicode[STIX]{x1D702}=0.056$ of the overlap layer computed from
 $\unicode[STIX]{x1D702}\sqrt{Re_{\unicode[STIX]{x1D70F}}}=3$ for the average
 $Re_{\unicode[STIX]{x1D70F}}=2868$. Dashed-dotted line in panel (b) denotes the inner limit
 $z_{+}=37.5$ of the overlap layer computed from
 $\unicode[STIX]{x1D702}\sqrt{Re_{\unicode[STIX]{x1D70F}}}=0.7$ for the same average
 $Re_{\unicode[STIX]{x1D70F}}$. Reference Tailland and MathieuTM and Reference Bradshaw and GeeBG data are not plotted in panel (b) since these suffer from the errors due to wall proximity effect as mentioned in § 4.1.

A further question that now arises is whether there exists any inertial overlap layer between the inner and outer scaling regions. Usually the mesolayer overlap is considered to be the near-wall part (with  $Re_{\unicode[STIX]{x1D70F}}$-dependence) of the entire overlap layer and is followed by the inertial overlap (independent of
 $Re_{\unicode[STIX]{x1D70F}}$) as one moves further outwards from the wall (George et al. Reference George, Abrahamsson, Eriksson, Karlsson, Löfdahl and Wosnik2000). To examine this, we plot the mean velocity profile data (table 1) by dividing them into two broad categories, low-
 $Re_{\unicode[STIX]{x1D70F}}$ and high-
 $Re_{\unicode[STIX]{x1D70F}}$. We plot the low-
 $Re_{\unicode[STIX]{x1D70F}}$ data in figure 8 with the average
 $Re_{\unicode[STIX]{x1D70F}}=1487$ and the range
 $1140\leqslant Re_{\unicode[STIX]{x1D70F}}\leqslant 1757$. Outer and inner limits (
 $\unicode[STIX]{x1D702}\sqrt{Re_{\unicode[STIX]{x1D70F}}}=3$ and
 $\unicode[STIX]{x1D702}\sqrt{Re_{\unicode[STIX]{x1D70F}}}=0.7$) of the mean-velocity overlap layer translate to
 $\unicode[STIX]{x1D702}=0.077$ and
 $z_{+}=27$, respectively, for the average
 $Re_{\unicode[STIX]{x1D70F}}=1487$. These are shown in figures 8(a) and 8(b), respectively, by dashed and dashed-dotted lines. Figure 9 shows the high-
 $Re_{\unicode[STIX]{x1D70F}}$ data with average
 $Re_{\unicode[STIX]{x1D70F}}=2868$ and the range
 $2450\leqslant Re_{\unicode[STIX]{x1D70F}}\leqslant 3742$ plotted in a fashion similar to figure 8. Figures 8(a) and 9(a) clearly show that the outer scaling extends well below the velocity maximum supporting the present contention that the outer flow is akin to a full-free jet. The most striking observation from figures 8 and 9, however, is that beyond the outer limit (in
 $\unicode[STIX]{x1D702}$ coordinate) of the mean-velocity overlap layer, data show remarkable collapse in outer scaling, and below the inner limit (in
 $z_{+}$ coordinate) of the overlap layer, data collapse quite well in the inner scaling. This implies that only the
 $Re_{\unicode[STIX]{x1D70F}}$-dependent mean-velocity overlap (mesolayer) of figure 6 exists in wall jets and the inertial overlap layer does not appear to exist, at least for the range of Reynolds numbers considered here. Also, it may be noted that, with increase in Reynolds number, the outer edge of the overlap layer in figure 9(a) shifts towards the wall in outer (
 $\unicode[STIX]{x1D702}$) coordinate as compared to figure 8(a). This indicates that the outer full-free jet flow in wall jets progressively dominates the inner wall flow with increasing Reynolds number. This is to be contrasted with the outer edge of the mean-velocity inertial sublayer (logarithmic overlap layer) being fixed at
 $\unicode[STIX]{x1D702}\approx 0.15$ in channels and TBLs (Wei et al. Reference Wei, Fife, Klewicki and McMurtry2005; Smits, McKeon & Marusic Reference Smits, McKeon and Marusic2011).
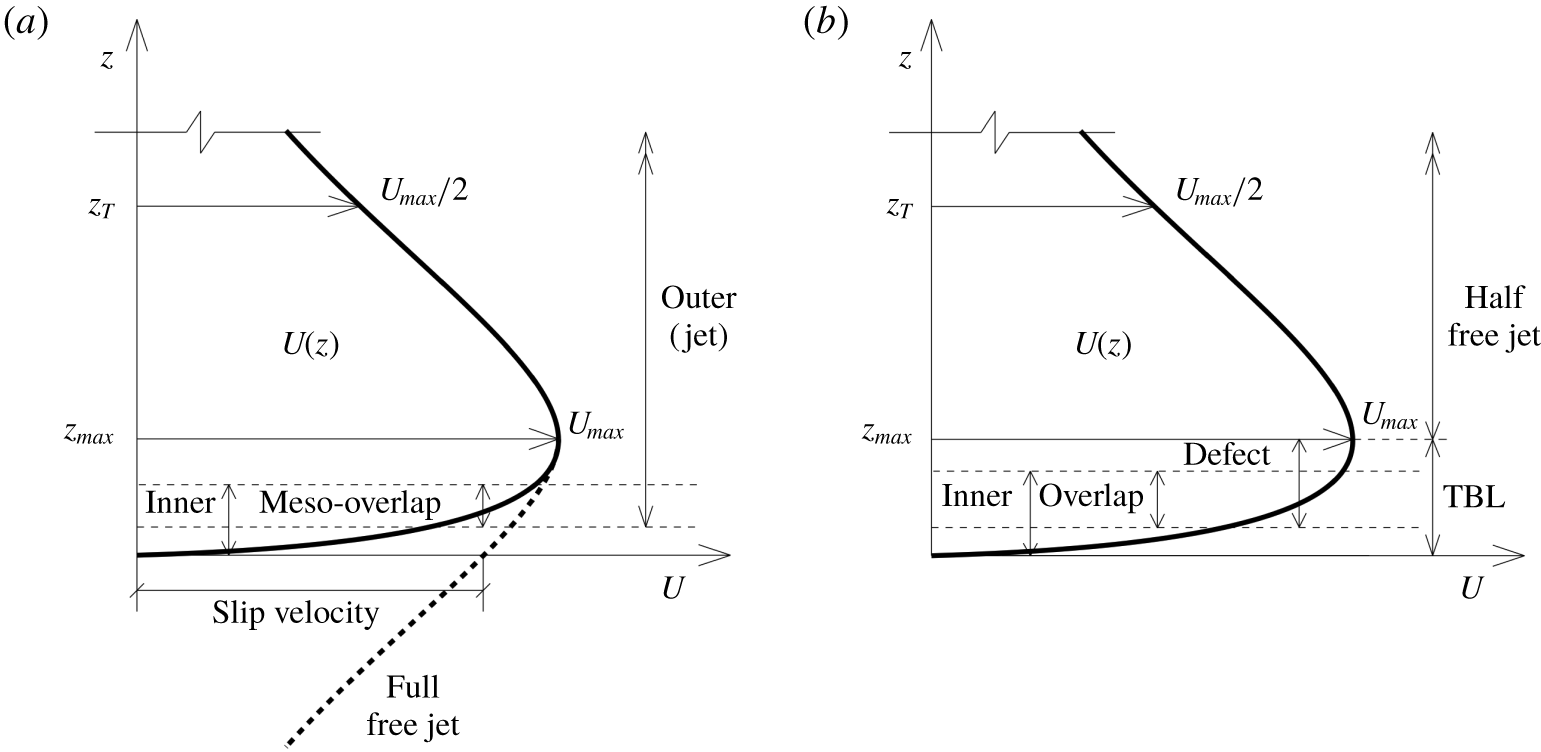
Thus, the layered structure of wall jets that emerges from the data and our analysis in the preceding may be summarized schematically as shown in figure 10(a). The outer flow is a self-similar turbulent full-free jet centred on the velocity maximum and described by the outer layer scaling (4.2). The outer jet layer does not satisfy the no-slip boundary condition at the wall as seen in figure 10(a). An inner or wall region, governed by (4.1), is therefore required to satisfy the no-slip condition at the wall and provide inner boundary condition for the outer flow. These inner and outer regions overlap in the form of an  $Re_{\unicode[STIX]{x1D70F}}$-dependent mean-velocity overlap layer that coincides with the momentum-balance mesolayer. There appears to be no inertial overlap between inner and outer scaling regions.
(a) Schematic of the layered structure of wall jet flow as per data and our analysis. Outer layer is a full-free jet centred on the velocity maximum having non-zero slip velocity at the wall. The part of the outer layer velocity profile shown by the thick dashed line gets modified due to overlap with the inner wall layer. The overlap layer is  $Re_{\unicode[STIX]{x1D70F}}$-dependent and coincides with the momentum-balance mesolayer. There is no inertial overlap between inner and outer scalings. (b) Schematic of the prevalent proposal of the layered structure of wall jets from the literature (Afzal Reference Afzal2005; Gersten Reference Gersten2015). Part below
 $U_{max}$ is akin to a TBL, the part above is a half-free jet and these parts merge smoothly at the velocity maximum. Overlap occurs between the defect and inner regions of the TBL part of the flow.

Note that the structure depicted in figure 10(a) supports the asymptotic half-free jet state proposed by Afzal (Reference Afzal2005) and Gersten (Reference Gersten2015), as will be discussed shortly. However, in terms of the spirit and the details, the present proposal is distinct and minimal compared to the alternatives presented in other theoretical studies in the literature (George et al. Reference George, Abrahamsson, Eriksson, Karlsson, Löfdahl and Wosnik2000; Afzal Reference Afzal2005; Barenblatt et al. Reference Barenblatt, Chorin and Prostokishin2005; Gersten Reference Gersten2015). The most prevalent alternative (Afzal Reference Afzal2005; Gersten Reference Gersten2015) of these is the structure depicted in figure 10(b). Here, the part of the flow below the velocity maximum  $U_{max}$ behaves similar to a TBL with its own inner and defect scaling regions and a logarithmic (or power-law) overlap. The part above
 $U_{max}$ is a half-free jet and these parts patch up at the velocity maximum. The contention in this approach is that the asymptotic state far downstream would be a half-free jet, i.e. with increasing
 $Re_{\unicode[STIX]{x1D70F}}$, the TBL part occupies an increasingly smaller fraction of the overall flow thickness. Note that the proposal of an asymptotic half-free jet state is quite plausible and consistent with our approach as well. Indeed, our data for WJ1, WJ2 and WJ3 experiments in table 1 show that
 $U_{max}/U_{\unicode[STIX]{x1D70F}}$ and
 $Re_{\unicode[STIX]{x1D70F}}=z_{T}/(\unicode[STIX]{x1D708}/U_{\unicode[STIX]{x1D70F}})$ for each flow increase continually with
 $x/b$, implying more rapid decay of inner scales than the outer scales, and this is consistent with the asymptotic half-free jet state. In fact, contrary to the expectation of Gersten (Reference Gersten2015), Reference Eriksson, Karlsson and PerssonEKP data from table 1 also show a similar tendency towards a half-free jet state. However, the contention that the entire flow below
 $U_{max}$ behaves like a TBL appears to be rather untenable (Bradshaw Reference Bradshaw1963). The occurrence of a region of counter-gradient momentum diffusion below
 $U_{max}$ in wall jets (Narasimha Reference Narasimha1990; Ahlman et al. Reference Ahlman, Brethouwer and Johansson2007; Naqavi et al. Reference Naqavi, Tyacke and Tucker2018) is in stark contrast with the always down-the-gradient diffusion in the outer region of a TBL flow. A relatively recent LES study (Dejoan & Leschziner Reference Dejoan and Leschziner2005) shows that the anisotropy parameters, profiles of production–dissipation ratio etc. in wall jets differ radically from the corresponding turbulent channel flow results. Given the known similarity between channel flow and TBL structure, it is highly improbable that the part of wall jet flow just below
 $U_{max}$ has a structure similar to the outer region of a TBL. The innermost region could still have similarities due to dominant role of the wall. Further detailed analyses of the experimental data of table 1 following the approaches of Afzal (Reference Afzal2005) and Gersten (Reference Gersten2015) are presented in appendices A and B, respectively.
The layered structure of wall jets proposed by George et al. (Reference George, Abrahamsson, Eriksson, Karlsson, Löfdahl and Wosnik2000) is summarized in figure 2 therein. While the structure we have proposed is very similar to their proposal, there are distinct differences such as  $Re_{\unicode[STIX]{x1D70F}}$-independent inner and outer scalings, absence of inertial overlap, arbitrary shift in
 $U$ instead of
 $z$ in the overlap analysis, etc. in our proposal. The outer analysis of George et al. rests on the contention that the Reynolds shear stress in the outer layer scales on
 $U_{\unicode[STIX]{x1D70F}}$ rather than
 $U_{max}$. The experimental evidence (figure 10 of their paper) for this proposal is, however, very limited; there have been some recent studies that challenge this view (see Ahlman et al. Reference Ahlman, Brethouwer and Johansson2007; Rostamy et al. Reference Rostamy, Bergstrom, Sumner and Bugg2011). Theoretical argument in favour of this contention is presented in appendix B of their paper, where the outer equations reduce to a constant-stress layer in the overlap region. Again, the experimental evidence in wall jets for the occurrence of a constant-stress layer, or even a tendency towards it, is plainly absent (see figure 17 from their paper); this is in fact consistent with the absence of inertial overlap in wall jets. Our perception is that part of this confusion arises because the outer flow structure has not been identified correctly. With our structural model, the outer full-free jet flow does not lead to a constant-stress layer in the near-wall region due to non-negligible advection on account of a large, finite slip velocity. More systematic experiments on wall jets at higher Reynolds numbers are required to shed more light on the correct scaling behaviour of the Reynolds shear stress. Appendix C presents further analysis of the experimental data of table 1 following the approach of George et al. (Reference George, Abrahamsson, Eriksson, Karlsson, Löfdahl and Wosnik2000).
Barenblatt et al. (Reference Barenblatt, Chorin and Prostokishin2005) also have proposed a layered structure for wall jets based on rather limited data of Reference Eriksson, Karlsson and PerssonEKP experiments alone. In this proposal, the inner and outer layer length scales are respectively taken to be the heights of the half-velocity points ( $U_{max}/2$) below and above the velocity maximum. Our view is that, whilst the height of the upper half-velocity point could be justified as a measure of the overall thickness of the flow (as in turbulent free jets, see Deo et al. Reference Deo, Mi and Nathan2008), the height of the lower half-velocity point seems a rather ad hoc and arbitrary choice without an immediately apparent physical significance (the viscous length scale would be more appropriate in the near-wall region). The velocity scale
 $U_{max}$ essentially remains the same for both the layers. Furthermore, Barenblatt et al. do not discuss any overlap analysis.
5 Conclusions
We have addressed some key issues related to the scaling of mean velocity in fully developed, two-dimensional, turbulent wall jets on flat surfaces. The conclusions may be summarized as follows.
(i) Streamwise variations of the velocity and length scales – namely
$U_{max}$, $z_{T}$ and $U_{\unicode[STIX]{x1D70F}}$ – follow ‘local’ scaling based on the kinematic momentum rate $M$ (per unit width) and kinematic viscosity $\unicode[STIX]{x1D708}$ (LCs) irrespective of the facility, working fluid and whether the nozzle is located in a wall perpendicular to the test surface or not. The flow development appears to be self-similar (layer-wise) without any imposed length and velocity scales, i.e. independent of the initial conditions at the nozzle exit (ICs) as well as the asymptotic conditions far downstream (FCs). As is quite common in canonical developing flows such as TBLs, the inner and outer scales in a wall jet could still develop downstream at different rates.(ii) Experimental mean-velocity data strongly support a two-layer self-similar structure of wall jets. The inner (wall) layer scales purely on
$U_{\unicode[STIX]{x1D70F}}$ and $\unicode[STIX]{x1D708}$ and the outer layer, which is akin to a full-free jet, scales purely on $U_{max}$ and $z_{T}$. These scalings are universal, i.e. independent of $Re_{\unicode[STIX]{x1D70F}}$ (to the lowest order) as well as independent of the ICs and FCs.(iii) Analysis shows that these inner and outer descriptions lead to an
$Re_{\unicode[STIX]{x1D70F}}$-dependent (non-universal) power-law velocity profile in the overlap layer of wall jets. Strong inner–outer interaction between the wall flow structure and the highly nonlinear full-free jet structure could lead to such an overlap.(iv) Assumption of the mean-velocity overlap layer being coincident with the momentum-balance mesolayer enables description of the overlap layer in terms of an intermediate variable
$\unicode[STIX]{x1D702}\sqrt{Re_{\unicode[STIX]{x1D70F}}}$ (or $z_{+}/\sqrt{Re_{\unicode[STIX]{x1D70F}}}$) that absorbs the $Re_{\unicode[STIX]{x1D70F}}$-dependence; DNS data provide strong a posteriori support for this assumption. With this, all the data (table 1) collapse remarkably well on to a single universal power-law curve (4.10) for 42 % of a decade in the intermediate variable over the range $0.7<\unicode[STIX]{x1D702}\sqrt{Re_{\unicode[STIX]{x1D70F}}}<3$. Since the overlap is fixed in $\unicode[STIX]{x1D702}\sqrt{Re_{\unicode[STIX]{x1D70F}}}$, the position of the overlap layer shifts towards the wall and its extent reduces in the outer ($\unicode[STIX]{x1D702}$) coordinate; the opposite is true for the inner ($z_{+}$) coordinate.(v) Analysis of the DNS data shows that indeed the mean-velocity overlap layer, whose extent is determined empirically from the mean-velocity data, coincides well with the momentum-balance mesolayer. Further, it is observed that in wall jets the momentum-balance mesolayer occurs much closer to the wall (in
$z_{+}$ coordinate) than in channels and TBLs at matched $Re_{\unicode[STIX]{x1D70F}}$. This is consistent with the observation that the linear sublayer in wall jets extends only up to $z_{+}\approx 3$ in contrast to $z_{+}\approx 5$ in channels and TBLs. These observations show that, for a given Reynolds number, the influence of the outer full-free jet flow structure penetrates deeper into the near-wall region as compared to the influence of the outer wake structure of channels and TBLs. This enables the strong inner–outer interaction alluded to earlier.(vi) Selective plotting of experimental data for low- and high-
$Re_{\unicode[STIX]{x1D70F}}$ ranges shows that there is only $Re_{\unicode[STIX]{x1D70F}}$-dependent overlap between the universal inner and outer mean-velocity scaling descriptions; no inertial overlap appears to exist in wall jets for the range of $Re_{\unicode[STIX]{x1D70F}}$ values available till date. As opposed to channels and TBLs, the wallward extent of the outer scaling in wall jets increases with Reynolds number (outer scaling by itself is independent of $Re_{\unicode[STIX]{x1D70F}}$ but its extent, specifically the lower end, depends on $Re_{\unicode[STIX]{x1D70F}}$ due to the $Re_{\unicode[STIX]{x1D70F}}$-dependent overlap) indicating that the outer full-free jet flow structure grows progressively stronger relative to the inner wall flow structure.


Acknowledgements
We thank ERCOFTAC Classic Collection Database for the archived data of Reference Eriksson, Karlsson and PerssonEKP experiments. Sincere thanks are due to Dr I. Naqavi, Department of Engineering, Cambridge University for sharing the wall jet DNS data. S.A.D. acknowledges insightful discussions with Professor O. N. Ramesh, Indian Institute of Science, Bengaluru and Professor R. Narasimha, JNCASR, Bengaluru. Special thanks are due to the skilled efforts of IITM machine shop and carpentry team who fabricated the wall jet set-up used in this study, and to Dr M. Konwar, Scientist, IITM who helped for the OFI set-up. A.G., H.C., T.P. and S.A.D. gratefully acknowledge the support by the Director, IITM and the Ministry of Earth Sciences (MoES), Government of India.
Declaration of interests
The authors report no conflict of interest.
Appendix A. Overlap layer profiles following Afzal (Reference Afzal2005)
Afzal (Reference Afzal2005) has presented an elegant analysis of turbulent wall jets based on the method of matched asymptotic expansions. Both log-law and power-law overlap profiles (4.1 to 4.6 therein) have been derived as possible solutions to the open functional equation. Comparison with experimental data in figures 2 and 3 of their paper has been presented only for the case of universal log-law overlap profile (4.1 and 4.2 in their paper).
Figure 11 shows representative mean velocity profiles for flows in table 1 in inner and defect coordinates plotted in a fashion similar to figures 2 and 3 from Afzal (Reference Afzal2005). First, it is clear that the measured profiles do not collapse well in these coordinates; there appears to be some Reynolds-number effect in both plots in terms of systematic shifting of profiles. Second, it may be observed that the universal log laws in inner (figure 11a) and outer (figure 11b) coordinates do not adequately describe the overlap layer for all the flows; see § 4.4 for details of the structure of wall jets implied in Afzal (Reference Afzal2005).
Overlap analysis of mean velocity profiles for the flows in table 1 following Afzal (Reference Afzal2005). Profiles are shown in (a) inner and (b) defect coordinates similar to figures 2 and 3 of Afzal (Reference Afzal2005). Solid lines in both plots show the overlap log law (4.1 and 4.2 in Afzal (Reference Afzal2005)).

Appendix B. Streamwise variations of various quantities following Gersten (Reference Gersten2015)
Gersten (Reference Gersten2015) has pointed out that the asymptotic state far downstream would be a turbulent half-free jet for wall jets emerging from nozzles not located in a wall perpendicular to the test surface. This proposal is based on the analysis of Schneider (Reference Schneider1985) that deduced non-zero asymptotic value of the momentum flux of free jets emerging from similar nozzles. In fact, such an asymptotic half-free jet state has been derived in the work of Afzal (Reference Afzal2005) as well. The overlap scaling analysis is also almost identical in Afzal (Reference Afzal2005) and Gersten (Reference Gersten2015). Moreover, while Gersten (Reference Gersten2015) explicitly clarifies that their analysis does not apply to wall jets emerging from nozzles located in a wall perpendicular to the test surface, the analysis of Afzal (Reference Afzal2005) is free from such restrictions. An intriguing proposal by Gersten (Reference Gersten2015) is that the asymptotic kinematic momentum flux (rate) of the half-free jet state, denoted therein by  $K_{\infty }$ and here by
 $M_{\infty }$, should be used as a relevant scaling parameter (see § 3.2) for the streamwise variations of velocity and length scales. This proposal has already been assessed in §§ 3.2 and 3.5.
In this appendix, we analyse the mean-velocity data sets WJ, Reference Bradshaw and GeeBG and Reference Tailland and MathieuTM (see table 1) and plot a figure similar to figure 5 of Gersten (Reference Gersten2015) for each case. The procedure given in §7 of Gersten (Reference Gersten2015) is used for each of these data sets and is briefly described here for completeness; notation shall be kept the same as in Gersten (Reference Gersten2015) and shall be valid for this appendix only. First, the value of  $\unicode[STIX]{x1D6FC}=\text{d}y_{0.5}/\text{d}x/(4k)$ is computed from the observed streamwise variation of
 $y_{0.5}$ (in our notation
 $z_{T}$) in each set of experiments;
 $k=0.8814$ and
 $\unicode[STIX]{x1D705}=0.41$ as given in Gersten. Next, any two profiles (denoted by subscripts
 $I$ and
 $II$), preferably at different
 $x$ locations and Reynolds numbers, are selected from the data set under consideration and the values of
 $y_{m}/y_{0.5}$ (our
 $z_{max}/z_{T}$) and
 $\unicode[STIX]{x1D6FE}=u_{\unicode[STIX]{x1D70F}}/u_{m}$ (our
 $U_{\unicode[STIX]{x1D70F}}/U_{max}$) are noted for these two profiles. Using
 $\unicode[STIX]{x1D6FE}$ in (6.4a) from Gersten gives
 $u_{m}/U_{N}$ in terms of
 $\unicode[STIX]{x1D6FE}_{G}$. Substituting
 $y_{m}/y_{0.5}$ and
 $u_{m}/U_{N}$ for both these profiles in (6.1) and (6.2) of Gersten yields four nonlinear equations in six unknowns viz.
 $A_{1}$,
 $A_{2}$,
 $B_{1}$,
 $B_{2}$,
 $\unicode[STIX]{x1D6FE}_{GI}$ and
 $\unicode[STIX]{x1D6FE}_{GII}$. Two more equations come from (7.2) and (7.3) of Gersten. Solving these six nonlinear equations yields the values of the six unknowns.
The results may be presented by plotting three quantities  $K/K_{\infty }$ (our
 $M/M_{\infty }$),
 $20\unicode[STIX]{x1D6FE}_{G}$ and
 $u_{m}y_{0.5}/\unicode[STIX]{x1D708}$ (our
 $U_{max}z_{T}/\unicode[STIX]{x1D708}$ and denoted by
 $Re_{L}$) against the local Reynolds number
 $Re_{x}$. For each quantity, a theoretical curve and experimental data points may be plotted as in figure 5 of Gersten.
For theoretical curves, the procedure is as follows. Equation (6.6) along with (6.7a,b) gives  $\unicode[STIX]{x1D6FE}_{G}$ as a function of
 $Re_{x}$. This may be simply plotted over a range of
 $Re_{x}$ values to plot the theoretical curve of
 $20\unicode[STIX]{x1D6FE}_{G}$; the factor of
 $20$ is used for the ease of plotting
 $\unicode[STIX]{x1D6FE}_{G}$ on the same ordinate scale as
 $K/K_{\infty }$. For the curve of
 $Re_{L}$, note that
 $Re_{L}=Re_{m}y_{0.5}/y_{m}$ and therefore (6.4b) from Gersten gives
 $Re_{L}=PRe_{x}u_{m}/U_{N}$ where
 $P=k\sqrt{6\unicode[STIX]{x1D6FC}}$. Obtaining
 $u_{m}/U_{N}$ from (6.2) for each value of
 $\unicode[STIX]{x1D6FE}_{G}$ in the previous step and substituting in the above relation yields
 $Re_{L}$ values at all
 $Re_{x}$ values in the earlier step. Equation (5.5) from Gersten gives
 $K/K_{\infty }$ in terms of
 $\unicode[STIX]{x1D6FE}_{G}$ which in turn has been already obtained in terms of
 $Re_{x}$. Therefore
 $K/K_{\infty }$ is also obtained for all
 $Re_{x}$ values.
For experimental data points, the main task is to obtain  $Re_{x}$ for each data point. Towards this we first use (6.4a,b) to obtain
 $\unicode[STIX]{x1D6FE}_{G}=(y_{0.5}u_{\unicode[STIX]{x1D70F}}/\unicode[STIX]{x1D708})/(PRe_{x})$. For an experimental data point,
 $y_{0.5}u_{\unicode[STIX]{x1D70F}}/\unicode[STIX]{x1D708}$ is known and therefore the above relation expresses
 $\unicode[STIX]{x1D6FE}_{G}$ in terms of
 $Re_{x}$. Substituting this relation in (6.6) of Gersten yields one equation for
 $Re_{x}$. This equation may be solved using, say the Newton–Raphson method, and the value of
 $Re_{x}$ for that data point is obtained. To obtain the value of
 $\unicode[STIX]{x1D6FE}_{G}$ independent of the above calculation for
 $Re_{x}$, we substitute (6.4a) in (6.2), insert the measured value of
 $\unicode[STIX]{x1D6FE}$ and solve the quadratic equation for
 $\unicode[STIX]{x1D6FE}_{G}$. Finally, using (6.3) in Gersten,
 $(x-x_{0})$ is calculated by making use of the measured values of
 $y_{0.5}$ and
 $\unicode[STIX]{x1D6FC}$. Substituting this value of
 $(x-x_{0})$ in (2.3) then yields
 $K_{\infty }$ (our
 $M_{\infty }$) since
 $Re_{x}$ is already known. Using the
 $K$ (our
 $M$) obtained from the measured mean velocity profile, the ratio
 $K/K_{\infty }$ may be plotted against
 $Re_{x}$ for the data point under consideration.
Variations of the parameters  $K/K_{\infty }$ (our
 $M/M_{\infty }$),
 $20\unicode[STIX]{x1D6FE}_{G}$ and
 $Re_{L}=u_{m}y_{0.5}/\unicode[STIX]{x1D708}$ (our
 $U_{max}z_{T}/\unicode[STIX]{x1D708}$) with respect to the Reynolds number
 $Re_{x}$ for the flows in table 1. Lines show theoretical curves following the analysis of Gersten (Reference Gersten2015) and symbols show experimental data points. (a) Flows WJ1, WJ2 and WJ3, (b) flow BG1 and (c) flows TM1, TM2 and TM3.

Experimental and theoretical  $K$ (our
 $M$) values for the data of flows WJ1, WJ2 and WJ3 in table 1.

Figure 12(a) shows the plot for the data of the present experiments WJ1, WJ2 and WJ3 in table 1. Figures 12(b) and 12(c) show plots for flows Reference Bradshaw and GeeBG and Reference Tailland and MathieuTM (see table 1), respectively. On the whole, the trends of the data and the theoretical curves seem to be reasonably consistent. However, the magnitudes show substantial mismatch. Specifically, we note that the ratio  $K/K_{\infty }$ is overpredicted by the theory. Consistent with this, the drag (
 $\unicode[STIX]{x1D6FE}_{G}$) seems to be underpredicted. The reason for this mismatch seems to be that the calculation of
 $K$ in theory (see 4.65 in Gersten) assumes the part of the flow below
 $U_{max}$ to be like a TBL flow. Since outer part of the flow above
 $U_{max}$ is acceptably akin to a half-free jet, the problem must be with the contribution to
 $K$ from the lower part below
 $U_{max}$. The fact that theoretical values of
 $K$ are larger than those observed experimentally, implies that the velocity profile is actually less full in the lower part than what the TBL structure would permit; data in figure 3 of Gersten also show this point. Therefore the present structural model of full-free jet strongly interacting with the wall flow (see § 4.4) seems to be an appropriate resolution since it allows for stronger inner–outer interaction that could very plausibly lead to lesser flow speeds below the level of
 $U_{max}$ and hence increased drag as well. Figure 13 shows the comparison of
 $K$ (our
 $M$) values from theory and experiments for the data of flows WJ1, WJ2 and WJ3. It is clear that
 $K$ from experimental profile is always lower than the theory and this discrepancy apparently increases with Reynolds number.
Appendix C. Overlap layer profiles following George et al. (Reference George, Abrahamsson, Eriksson, Karlsson, Löfdahl and Wosnik2000)
Overlap analysis of mean velocity profiles for flows in table 1 following George et al. (Reference George, Abrahamsson, Eriksson, Karlsson, Löfdahl and Wosnik2000). Profiles are shown in (a) outer and (b) inner coordinates similar to figures 13 and 14 from George et al. (Reference George, Abrahamsson, Eriksson, Karlsson, Löfdahl and Wosnik2000). Overlap power laws ((8.7) and (8.8) in George et al. (Reference George, Abrahamsson, Eriksson, Karlsson, Löfdahl and Wosnik2000)) are shown in both the plots using lines. Each set of data points and the corresponding curve (except for WJ1-1) are displaced upwards with arbitrary constant additive shift for visual aid.

George et al. (Reference George, Abrahamsson, Eriksson, Karlsson, Löfdahl and Wosnik2000) have presented extensive theoretical treatment of turbulent wall jets using the similarity of inner and outer equations in conjunction with the so-called asymptotic invariance principle (AIP); see George & Castillo (Reference George and Castillo1997) and Wosnik, Castillo & George (Reference Wosnik, Castillo and George2000) for more details of the AIP and its application to TBL flows and fully developed pipe and channel flows. The core idea is that at all finite friction Reynolds numbers ( $Re_{\unicode[STIX]{x1D70F}}$), the inner and outer flow descriptions always carry some
 $Re_{\unicode[STIX]{x1D70F}}$ dependence and these could become independent of
 $Re_{\unicode[STIX]{x1D70F}}$ only in the limit when
 $Re_{\unicode[STIX]{x1D70F}}\rightarrow \infty$. Therefore, the overlap analysis also intrinsically involves some
 $Re_{\unicode[STIX]{x1D70F}}$ dependence for all finite values of
 $Re_{\unicode[STIX]{x1D70F}}$. It is re-emphasized that our analysis of § 4.2 is fundamentally different from the approach of George et al. (Reference George, Abrahamsson, Eriksson, Karlsson, Löfdahl and Wosnik2000). We consider the inner and outer scalings to be in principle independent of
 $Re_{\unicode[STIX]{x1D70F}}$ and the
 $Re_{\unicode[STIX]{x1D70F}}$-dependence of overlap comes about as a result of strong inner–outer interaction; we do not invoke the AIP.
We now analyse our velocity profile data using the framework of George et al. We use the same values of universal constants that have been used by George et al. to plot figures 13 and 14 therein. Using these, we construct the theoretical overlap profiles with the help of (8.7) and (8.8) in George et al. and plot them along with the corresponding data points in figure 14. Two points are worth mention. First, the theoretical overlap profiles (lines) of George et al. reasonably follow experimental data in the outer scaling (figure 14a) but fail to do so in the inner (figure 14b). This is an indication that the inner region of a wall jet flow is different than the inner region of a TBL flow (see § 4.4). A second, and more subtle, observation is that, even in the outer scaling (figure 14a), the curvature of the theoretical curve appears to change in this semi-logarithmic plot. For lower Reynolds numbers, this change of curvature takes place outside the overlap region but for higher Reynolds numbers, it does so inside the overlap region. Experimental profiles, on the other hand, show no such curvature change. We have found that this curvature change effect is related to the arbitrary shift  $\unicode[STIX]{x1D6FC}$ (
 $a$ in George et al. (Reference George, Abrahamsson, Eriksson, Karlsson, Löfdahl and Wosnik2000), and
 $a<0$) introduced in the
 $z$ coordinate (see also § 4.2). For large (small) negative values of
 $a$, the curvature change will occur at larger (smaller) values of
 $\unicode[STIX]{x1D702}$. George et al. have fixed
 $a_{+}=-16$ and have shown Reference Eriksson, Karlsson and PerssonEKP data, which have comparatively lower Reynolds numbers (see table 1), to present the overlap profiles in their figures 13 and 14. Taken together, the shape of the theoretical curve of George et al. in the overlap region appears to be unphysical, especially at higher Reynolds numbers. In contrast, our analysis does not suffer from this drawback since we use an arbitrary shift
 $\unicode[STIX]{x1D6FD}$ in the velocity
 $U$ instead of shift
 $\unicode[STIX]{x1D6FC}$ in the coordinate
 $z$ (see § 4.2). Therefore our theoretical overlap profile (4.10) correctly captures the shape of the experimental curve in the overlap region without showing any unphysical change of curvature (figure 6).