Introduction
Durum wheat (Triticum turgidum var. durum) is a major crop in the Mediterranean basin of West Asia, North Africa, and Southern Europe (Elias and Manthey, Reference Elias, Manthey, Royo, Nachit, Di Fonzo, Araus, Pfeiffer and Slafer2005), whereas drought is the most important limitation to the durum wheat production in the Mediterranean environments and other areas (Mohammadi et al., Reference Mohammadi, Sadeghzadeh, Armion and Amri2011). In the past decades, the yields of wheat and other cereals have increased considerably in many regions of the world (Calderini and Slafer, Reference Calderini and Slafer1998; Del Pozo et al., Reference Del Pozo, Matus, Serret and Araus2014; Engler and Del Pozo, Reference Engler and Del Pozo2013), as a result of genetic improvement and better agronomic practices. Yield under water-limiting conditions, such those under rainfed Mediterranean environments, has also increased during the past decades (Mohammadi and Amri, Reference Mohammadi and Amri2013; Sánchez-García et al., Reference Sánchez-García, Royo, Aparicio, Martín-Sánchez and Álvaro2013). In addition to the possible need for phenological adjustment (i.e., earliness), it is postulated that one of the key contributing factors to yield in any situation is the inherent ability of a genotype to translate input into output (Hawkesford et al., Reference Hawkesford, Araus, Park, Calderini, Miralles, Shen, Zhang and Parry2013; Nouri et al., Reference Nouri, Etminan, Teixeira da Silva and Mohammadi2011). Wheat is adapted to a wide range of environmental conditions due to the diversity in its phenology genes (pbd genes), with plants modifying their developmental phases based on water availability in target environments. Thus, there is a need to maximize yields in drought conditions by deploying appropriate phenology gene combinations along with Rht genes and other important physiological traits associated with drought tolerance (Nazim Ud Dowla et al., Reference Nazim Ud Dowla, Edwards, O’Hara and WujunMa2018).
However, yield of wheat under water-limited condition should be increased in order to supply a future demand for food, which is a consequence of the growing population and changes in social habits (Hawkesford et al., Reference Hawkesford, Araus, Park, Calderini, Miralles, Shen, Zhang and Parry2013), and also to mitigate the negative impacts of global climate change on crop productivity (Lobell and Gourdji, Reference Lobell and Gourdji2012). Yield performance of genotypes in drought-stressed and non-stressed environments can be used as an indicator of drought tolerance in breeding for drought-prone environments. According to Rosielle and Hamblin (Reference Rosielle and Hamblin1981) and Fernandez (Reference Fernandez1992), the drought tolerance indices were grouped into two classes. The first class (Class 1) represents the tolerance indices, that is, mean productivity (MP), stress tolerance index (STI), and the geometric mean productivity (GMP) that have a positive relationship with yield and then tend to identify genotypes with stress tolerance and high average yield. The second class (Class 2) represents the susceptibility indices, that is, stress susceptibility index (SSI) and the tolerance (TOL) that are negatively correlated with yield and tend to distinguish between the stress-tolerant and the stress-susceptible genotypes.
Drought selection indices were already discussed in previous studies (Nouri et al., Reference Nouri, Etminan, Teixeira da Silva and Mohammadi2011; Sio-Se Mardeh et al., Reference Sio-Se-Mardeh, Ahmadi, Poustini and Mohammadi2006) and their repeatability and accuracy in estimation of drought tolerance in genetic materials were recently reported (Mohammadi, Reference Mohammadi2016). There is evidence that phenotyping using drought stress indices, as a complement to agronomic traits, may help in identifying selectable features that accelerate breeding for yield potential and performance under drought (Mohammadi, Reference Mohammadi2016; Mwadzingeni et al., Reference Mwadzingeni, Shimelis, Tesfay and Tsilo2016; Nouri et al., Reference Nouri, Etminan, Teixeira da Silva and Mohammadi2011). Due to drought stress and its intensity on crop species, there is not a screening index with high accuracy to be recommended in breeding programs for selecting genotypes with drought stress adaptation and high yield in both stress and non-water stress environments. It has been suggested that a combination of stress indices (tolerance and susceptibility indices) might provide a more useful criterion for improving drought stress tolerance selection in crop species (Ramirez-Vallejo and Kelly, Reference Ramirez-Vallejo and Kelly1998; Thiry et al., Reference Thiry, Chavez Dulanto, Reynolds and Davies2016). A multiple scoring index (MSI) based on scoring of drought tolerance indices was developed by Thiry et al. (Reference Thiry, Chavez Dulanto, Reynolds and Davies2016). Nevertheless, there is no report about the repeatability and accuracy of the MSI across different levels of drought stress. Many drought-adaptive traits have been investigated in wheat including days to flowering, plant height, days to maturity, grain weight, visual assessment of leaf senescence at booting, flowering and dough stages, and grain yield. However, the association of these traits with the MSI under drought has not been documented. Most difficulties encountered in the identification of accurate drought tolerance traits are due to the fact that wheat is cultivated under very different climatic conditions and faces very different drought conditions worldwide (Monneveux et al., Reference Monneveux, Jing and Misra2012).
The main objectives of this study were (i) to use an appropriate combination index MSI for selection of drought-tolerant durum wheat genotypes across different levels of drought stress, (ii) to examine the repeatability and validity of MSI for estimating of tolerance/susceptibility under drought stress, and (iii) to study the relationship of the MSI with some drought-adaptive traits in durum wheat.
Materials and Methods
Plant material, experimental conditions, and evaluations
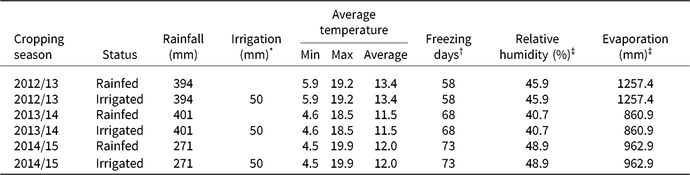
Field trials were conducted at the Dryland Agricultural Research Institute, Sararood Research Station (34°19′N, 47°17′E; 1351 m asl), Kermanshah, Iran, which is representative of rainfed environments with moderately cold conditions. Absolute minimum and maximum air temperatures range from −20 to 45 °C, and the average long-term annual precipitation is about 425 mm. Environmental conditions (i.e., rainfall, temperature, relative humidity, freezing days, and evaporation) were monitored with an automatic meteorological station located 500–1000 m from the experimental sites (Table 1). The soil at the site is a clay loam.
Environmental conditions from October to June at the Sararood Research Station

* Irrigation was applied in two times during grain filling period.
† Days of temperatures at or below 0°.
‡ Relative humidity and evaporation are recorded as a 24-hour total.
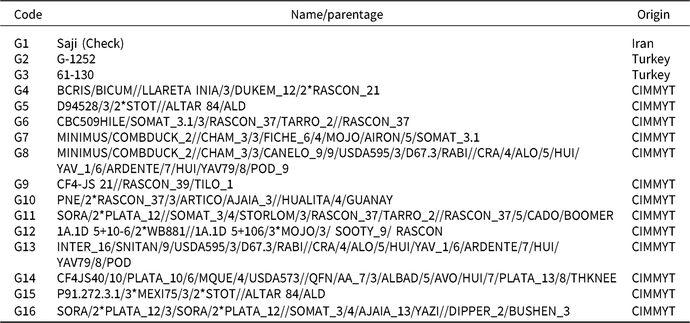
Sixteen rainfed durum genotypes (Table 2) were selected based on agronomic performance from the national durum wheat breeding program that were evaluated under two water supply conditions (rainfed and supplemental irrigation) during three cropping seasons (2012–2015). Under supplemental irrigation condition, two irrigations each of 25 mm were applied at flowering and grain filling to mitigate the effects of terminal drought stress.
Code, name/pedigree, and origin of tested 16 durum wheat genotypes

For all six environments, the experimental layout was a randomized complete block design with three replications. Plot size was 7.2 m2 (6 rows, 6 m long, and 20 cm row spacing). Fertilizer rate was applied at planting at 50 kg N ha−1 and 50 kg P2O5 ha−1. Management practices recommended for each environment were followed in all yield trials. Grain yield and agronomic traits such as days to 50% flowering, plant height at maturity (cm; from soil surface to tip of spike, excluding awns), days to maturity (50% of peduncles turned yellow) and 1000-kernel weight (TKW) were recorded for the tested genotypes in each environment. An agronomic score was visually recorded on a scale of 1–5 for each genotype, where 1 is assigned to undesirable genotype and 5 to desirable one. The plot yields were converted to productivity per hectare (kg ha−1) and subjected to statistical analysis.
Indices and statistical analysis
A combined analysis of variance (ANOVA) for grain yield data was performed to determine the effects of year, water supply, genotype, and all possible interactions between these factors. Grain yield – as useful criteria in breeding for drought environments – was used to assess drought tolerance of genotypes. According to Fischer and Maurer (Reference Fischer and Maurer1978), stress intensity (SI) was calculated for first, second, and third year, and it was equal to 0.71, 0.16, and 0.41, respectively. Accordingly, we defined three drought SIs in traits namely: mild (SI < 0.3), moderate (0.3 < SI < 0.6), and severe (SI > 0.6) drought conditions.
Based on the mean yield under rainfed and irrigated conditions, some conventional drought tolerance indices including the STI, GMP, MP, SSI, and TOL were calculated for each level of drought SI. The scoring scale for each index was calculated as described by Thiry et al. (Reference Thiry, Chavez Dulanto, Reynolds and Davies2016). The values for each index were divided into 10 parts and each part has a score from 1 to 10. Therefore, each part represents 10% of the range value. For example, a score value of 1 is assigned for all values between 0 and 10%, score 2 is assigned for all values between 10 and 20%, and etc. For STI, GMP, and MP, high values are desirable (Class 1), while for SSI and TOL, low values are desirable (Class 2). For indices of Class 2, the values were inverted, so a high value obtained with the original equation will receive a lower score. This allows the two classes of traits to have the same scale, where a high score will always mean a ‘good’ genotype. For example, a score value of 2 is assigned for indices of Class 1 for all values between 10 and 20% and between 80 and 90% for indices in Class 2. A tool developed in Microsoft Excel was created to assign a score to each index value. A combination of the score indices was used, and we refer to it as MSI:
 $${\rm{MSI}} = {{{\rm{STIs}} + {\rm{GMPs}} + {\rm{MPs}} + {\rm{SSIs}} + {\rm{TOLs}}} \over 5},$$
where STIs, GMPs, MPs, SSIs, and TOLs stand for the scores indices.
The validation of the scoring method was quantified by correlating its scores with the original values. The repeatability for MSI was quantified by mean of correlations of 1000 resamples using the bootstrap method (Efron and Tibshirani, Reference Efron and Tibshirani1993) between the estimates of indices from different levels of drought stress (i.e., mild, moderate, or severe). This was done in order to check whether the information on genotypes obtained in a given condition is informative for other conditions. Statistical analyses were performed using the SPSS software (Version 19.0; IBM SPSS, Inc., Chicago, IL, USA).
Results
Weather conditions
The cropping seasons differed in amount and distribution of rainfall (Supplementary Material Figure S1 available online at https://doi.org/10.1017/S0014479719000231), which caused contrasting growing conditions and therefore affected yield under rainfed conditions. Rainfall distribution pattern remarkably varied among cropping seasons and genotypes was exposed to different levels of drought stress, which is a limiting factor in moderate cold rainfed areas of Iran. All the three seasons were characterized by lower rainfall (394, 401, and 271 mm, in 2012/2013, 2013/2014, and 2014/2015 cropping seasons, respectively) than the average long-term rainfall (425 mm). No significant variation in average air temperature was found among cropping seasons, except for the winter in 2012/2013 season that was warmer than the other two seasons.
Partitioning of variance components for grain yield
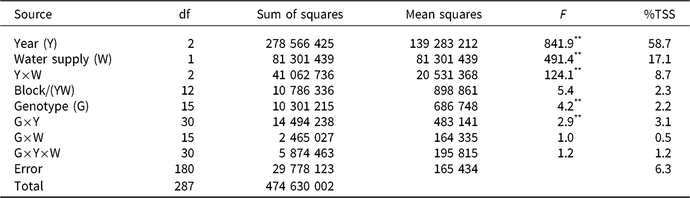
Table 3 summarizes the results from the combined ANOVA for grain yield. Highly significant differences (p < 0.01) were observed among the main effects of genotypes, water supply, years, and genotype × year interaction. The relative magnitudes of different sources of variation varied greatly, as indicated by the variance components expressed as percentages of the total variation. The combined ANOVA showed that 58.7% of the total variation in grain yield was explained by differences among years, 17.1% by differences due to water supply (supplemental irrigation), 8.7% by year × water supply interaction, 3.1% by genotype × year interaction and 2.2% by genotype effect. Interactions between genotypes, water supply and years accounted for 1.2% of the total variance, while genotype × water supply accounted for only 0.5%, and the remaining variation was attributed to error (8.6%).
Combined analysis of variance for 16 durum wheat genotypes tested in 3 years and two different water supply conditions

TSS, total sum of squares.
** Significant at 1% level of probability.
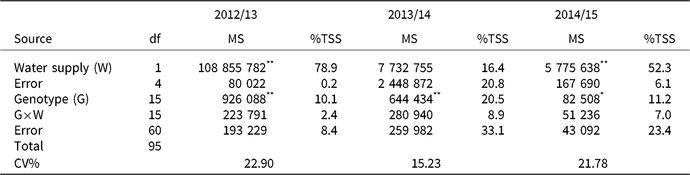
The ANOVA analyses for the grain yield in each year indicated the effect of water supply under severe (2012/2013) and moderate (2014/2015) drought conditions, which accounted for most of total variation (Table 4). These results supported the effect of supplemental irrigation to increase productivity under moderate and severe drought conditions compared to mild drought condition. The effect of genotype for each year was found to be significant, and its effect was two times greater in mild condition than in moderate and severe conditions. No significant effect was observed for genotype × water supply in each year.
Yearly ANOVA for 16 durum wheat genotypes under two different water supply conditions

MS, mean square; TSS, total sum of squares.
*,**Significant at 5 and 1% level of probability, respectively.
Overview of yield and related traits
The mean values and descriptive statistics for grain yield and other studied traits under two water supply conditions and three cropping seasons are presented in Supplementary Material Table S1. Genotype mean yields ranged from 855 to 2985 kg ha−1 under severe stress (2012/2013) condition, from 3064 to 3631 kg ha−1 under mild stress (2013/2014), and from 708 to 1198 kg ha−1 under moderate stress (2014/2015) (Supplementary Material Table S1). There were no significant correlations between genotypic means across the drought SIs, where the correlation coefficients varied between 0.10 and 0.24, showing that genotype ranking changed across drought SIs. The G3, G1, and G2 were the best materials under severe drought stress. The G15, G16, and G13 were the best under mild drought stress, while G1, G6, and G11 showed the highest yields under moderate drought stress condition. Days to flowering varied from 152 days in 2012/2013 to 171 days in 2014/2015. Plant height ranged from 44 cm in 2014/2015 to 74 cm in 2013/2014. Days to maturity varied between 189 days in 2012/2013 to 208 days in 2014/2015. The agronomic score ranged between 2.2 in 2014/2015 and 4.4 in 2012/2013. The highest TKW (39.1 g) was observed under irrigated condition in 2012/2013, while the lowest value (24.5 g) was found under rainfed condition in 2014/2015.
Scoring index and its validation
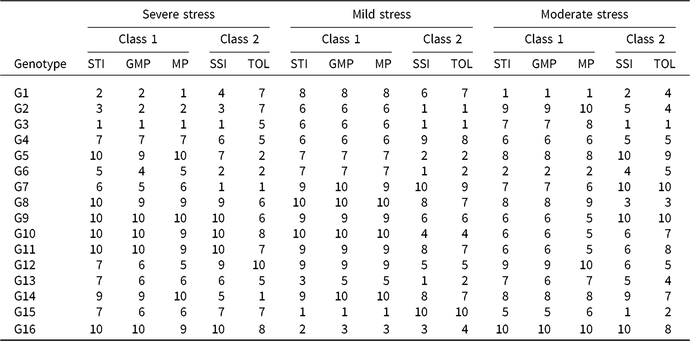
Drought stress indices for grain yield of 16 genotypes at each level of drought stress are shown in Supplementary Material Table S2, whereas the score of drought stress indices at each level of drought stress is given in Table 5. The 10-score indices provide an illustration of small differences between SSI and TOL. On the other hand, STI, GMP, and MP were similar across different levels of drought stress. The score indices show slight differences, but they keep the same magnitude into each class, where Class 1 tends to identify genotypes with stress tolerance and high average yield and Class 2 tends to distinguish between the stress-tolerant and the stress-susceptible genotypes.
The score index for 16 durum wheat genotypes based on the drought tolerance indices under different drought stress intensities

GMP, geometric mean productivity; MP, mean productivity; SSI, stress susceptibility index; STI, stress tolerance index; TOL, tolerance.
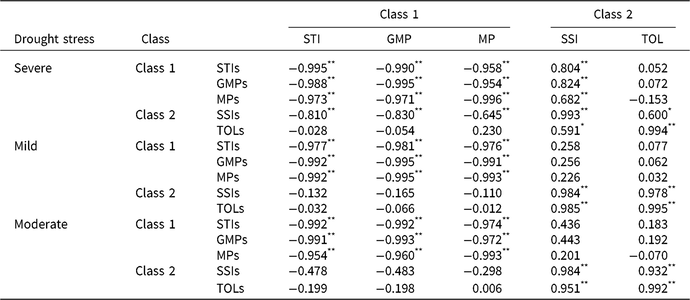
The Pearson correlation coefficients between the original values for MP, GMP, and STI and the score indices MPs, GMPs, and STIs were highly significant (p < 0.01, Table 6), indicating that the score indices can be used as an alternative for their original index values. Similar results were found between the score SSIs and the score tolerance index (TOLs) values and their original index values (SSI and TOL), as the score scale has been inverted in order to create a scale showing resilience instead of susceptibility. The significant correlations were consistent across different levels of drought stress, showing high repeatability between the score indices and their original value from each index.
Pearson’s correlation coefficients between the original indices (SSI, TOL, MP, GMP, and STI) and their score indices (SSIs, TOLs, MPs, GMPs, and STIs) for 16 durum wheat genotypes under different drought stress intensities

GMP, geometric mean productivity; MP, mean productivity; SSI, stress susceptibility index; STI, stress tolerance index; TOL, tolerance.
*, **Significant at 5 and 1% levels of probability, respectively.
Multiple scoring index
According to MSI, under severe drought SI the genotypes G3, G1, and G2 had the best combination of productivity and resilience to drought stress. While the genotypes G16, G13, G2, and G3 under mild drought condition and the G1, G6, and G15 under moderate stress conditions had the best combination of productivity and resilience to drought (Supplementary Material Table S3). The ranking of genotypes varied from each level of drought stress to another, indicating high potential among genotypes for adaptation to different drought stress conditions. Correlations between the estimates of MSI from different levels of stress varied from 0.083 to 0.386 (Table 7), with the magnitude of correlations being substantially lower and not consistent across different levels of stress.
Mean values of Pearson’s correlation coefficients and standard errors (SE) between the estimates of MSI from each level of drought stress using 1000 bootstrap samples

Traits related to MSI
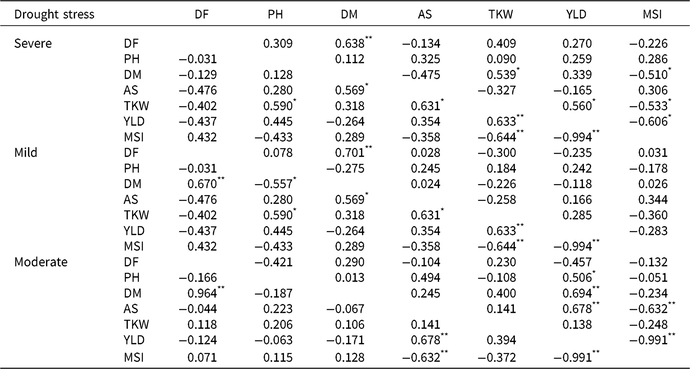
The MSI was significantly correlated (p < 0.05) with TKW, days to maturity and grain yield under severe drought condition, and with grain yield under moderate stress condition (Table 8). The MSI was not significantly associated with these traits under mild conditions, indicating the importance of MSI-based selection under severe and moderate drought conditions.
Pearson’s correlation coefficients describing association between phenotypic traits and MSI of 16 durum wheat genotypes evaluated under stressed (lower diagonal) and irrigated (upper diagonal) conditions under different stress intensities

DF, days to flowering; PH, plant height; DM, days to maturity; AS, agronomic score; TKW, 1000-kernel weight; YLD, grain yield; MSI: multiple scoring index.
*, **Significant at 5 and 1% levels of probability, respectively.
Discussion
Development of drought-tolerant wheat genotypes is the main goal of wheat breeders under Mediterranean environments. Drought and high temperature are key stress factors during the post-flowering (i.e., during anthesis and grain-filling stages of growth) in drought-prone environment, with high potential impact on crop yield. This phenomenon often reduces grain filling period, reducing grain weight and causing yield loss in wheat experiments under rainfed conditions of Iran. The highly significant genotypic differences observed among the studied traits indicate that the genetic materials used in this study could be a rich source of genetic diversity for improving drought tolerance in durum wheat. Thus, the genetic materials can be used to identify genotypes with high levels of tolerance to drought stress (Del Pozo et al., Reference Del Pozo, Matus, Serret and Araus2014; Dodig et al., Reference Dodig, Zoric, Kandic, Perovic and Surlan-Momirovic2012; Mohammadi, Reference Mohammadi2016). The observed significant effects of the wheat genotypes, water supply, and genotype × year interaction were expected since all the genotypes utilized in the study were selected from diverse pedigrees and the traits recorded are quantitatively inherited, hence differentially respond to the different stress conditions.
Selecting for improved grain yield under both drought and irrigated conditions allow genotypes to maintain ranks for high yields since the same genotypes will be expected to perform well in either condition. The high yields under stressed and irrigated conditions in some durum wheat genotypes, such as G1, G3, and G15 support the findings of Foulkes et al. (Reference Foulkes, Snape, Shearman, Reynolds, Gaju and Sylverstar-Bradley2007) that genotypes performing well under optimum conditions retain high yield under stress. However, the high-rank changes observed in the experiments were due to severe stress imposed on the genotypes resulting in average yield losses of about 71%. Generally, one genotype (G3) under severe drought condition, and eight genotypes (G16, G2, G3, G13, G15, G6, G5, and G4) under mild stress condition yielded better than the check cultivar (G1, Saji cultivar). Interestingly, most of the materials from drought nurseries were better adapted to the mild stress than the local check, therefore, can provide useful diversity for optimum cultivation.
The non-significant correlations between the mild, moderate, and severe drought stress conditions indicate that the genotypes that performed well under one level of stress does not perform in another. The low magnitude of repeatability estimates of MSI indicates an important influence of environment on the expression of grain yield. However, the non-repeatable estimates of MSI do not reinforce regularity in expression of grain yield in variable environments.
The high genotypic variation in drought tolerance suggests that selection for improved tolerance to drought should be effective in rainfed durum genotypes. In regions where severe drought conditions happen less frequently and where wet years predominate, wheat growers are likely to prefer cultivars that produce high yields in favorable moisture conditions, but suffer minimum losses during dry seasons (Dodig et al., Reference Dodig, Zoric, Kandic, Perovic and Surlan-Momirovic2012). However, in dryland areas of Iran there are large annual fluctuations in the amounts and frequency of rainfall events and among sites within years (Mohammadi et al., Reference Mohammadi, Haghparast, Amri and Ceccarelli2010). Most genotypes from the region tested in this study showed high-yield potential and relatively good yield performance under drought conditions.
The MSI showed highly significant correlation with grain yield and TKW and earliness under severe drought stress condition. Thus the genotypes with both high yield and resilience to drought under different drought stress conditions can be considered as tolerant ones. This shows the suitability of this method for selecting tolerant genotypes in durum wheat. It is also easy to use and integrate the two classes of drought indices (Classes 1 and 2) for selecting high yielding wheat genotypes under both stress and non-stress conditions. This method provides more information than the use of drought tolerance indices per se, because it simultaneously selects the genotypes for both high productivity and resilience to drought.
In conclusion, the scoring index provided a new method easy-to-use MSI to classify and visualize quickly which genotypes are the best/worst within a germplasm for both productivity and resilience. Tolerance information obtained from this study suggested potential lines that may be used as parents for future breeding program, for developing durum wheat cultivars targeting drought tolerance to boost productivity under drought-prone environments in Iran.
Author ORCIDs
Reza Mohammadi, 0000-0001-7694-0849
Acknowledgements
The author thanks the two anonymous reviewers and the editor of Experimental Agriculture for providing helpful comments and corrections on earlier drafts of this manuscript.
Supplementary materials
For supplementary material for this article, please visit https://doi.org/10.1017/S0014479719000231