Implications
Lacaune is a global sheep breed with high milk yield. Although intensive production systems of Lacaune are the only profitable method for producers outside the Roquefort area, little is known about this type of production system. Using 7873 lactations, this study examines mathematical functions for their ability to model the lactation of Lacaune sheep under intensive management. These results lay the foundation for further studies, which will help farmers detect factors affecting yields and detect ewes with low milk yield potential early in lactation. This will help them to make correct decisions to optimize profitability.
Introduction
Lacaune sheep originated in France and produced the milk used to prepare Roquefort cheese. This breed has become one of the world's high-yielding milk ovine breeds, with average daily milk yields of 1.59 l and a total milk yield of 270 l over a 165-day lactation period (Barillet et al., Reference Barillet, Marie, Jacquin, Lagriffoul and Astruc2001). In Spain, our group has observed mean milk yields of 448 l/ewe in an intensively managed flock, with a mean lactation length of 238 days (Hernandez et al., Reference Hernandez, Elvira, Gonzalez-Martin, Gonzalez-Bulnes and Astiz2011). Production of Roquefort cheese is strictly regulated by legislation of the European scheme of geographical indication named ‘protected designation of origin’. This scheme promotes and protects names of quality agricultural products and foodstuffs. The farm management mandated by this legislation includes one lambing per year and 30-day suckling periods. For producers outside of the Roquefort area, intensive systems and its management is the only way to fully exploit animal potential. However, information about the dairy performance of Lacaune sheep during complete lactation periods under intensive management is scarce.
Modeling of lactation curves is an alternative way to analyze factors affecting milk yields. Modeling of lactation provides the farmer with valuable data for management decisions (Sakul and Boylan, Reference Sakul and Boylan1992). Both linear and nonlinear methods of curve fitting have been used to describe lactation curves (see Masselin et al., Reference Masselin, Sauvant, Chapoutot and Milan1987). The most widely used function is the Wood incomplete gamma function (Wood, Reference Wood1967). Despite its popularity, this function tends to overestimate yields in early lactation and underestimate them in late lactation (Cobby and Le Du, Reference Cobby and Le Du1978). Morant and Gnanasakthy (Reference Morant and Gnanasakthy1989) suggested a four-parameter curve to overcome these problems. Additional nonlinear functions have been proposed (Ali and Schaeffer, Reference Ali and Schaeffer1987; Wilmink, Reference Wilmink1987; Grossman and Koops, Reference Grossman and Koops1988; Elston et al., Reference Elston, Glaseby and Nelson1989; Rook et al., Reference Rook, France and Dhanoa1993; Pérochon et al., Reference Pérochon, Coulon and Lescourret1996; Dijkstra et al., Reference Dijkstra, France, Dhanoa, Maas, Hanigan, Rook and Beever1997). The Wilmink (Reference Wilmink1987) model was developed in the Netherlands and was the original function used in the official program of genetic evaluation of dairy cattle in Canada (Schaeffer et al., Reference Schaeffer, Jamrozik, Kistemaker and Van Doormaal2000). The logarithm-based model developed by Ali and Schaeffer (Reference Ali and Schaeffer1987) is also an important reference used in several studies in dairy cattle. Generally, these methods describe the lactation curve of cattle better than the Wood model, although the residuals are not randomly distributed over the lactation period (Olori et al., Reference Olori, Brotherstone, Hill and McGuirk1999).
Other authors have proposed models on the basis of the biology of the udder, where the function parameters have biological meaning (Neal and Thornley, Reference Neal and Thornley1983; Rook et al., Reference Rook, France and Dhanoa1993; Dijkstra et al., Reference Dijkstra, France, Dhanoa, Maas, Hanigan, Rook and Beever1997). Pollott (Reference Pollott2000) and Pollott and Gootwine (Reference Pollott and Gootwine2000) have developed a model to fit the entire lactation period of Awassi and Assaf sheep, as well as dairy cattle (Albarrán-Portillo and Pollott, Reference Albarrán-Portillo and Pollott2008), with different biological models with two or three parameters showing a better fit to sheep lactations than the other models. Few studies have examined the complete lactation of sheep. Most of them deal with ewes under experimental conditions (Groenewald et al., Reference Groenewald, Ferreira, van der Merwe and Slippers1995; Portolano et al., Reference Portolano, Spatafora, Bono, Margiotta, Todaro, Ortoleva and Leto1996) or management conditions with suckling periods (Ruiz et al., Reference Ruiz, Oregui and Herrero2000; Oravcová et al., Reference Oravcová, Margetín, Peškovičová, Daňo, Milerski, Hetényi and Polák2006). Not many studies have been conducted under intensive farm conditions (Pollott and Gootwine, Reference Pollott and Gootwine2000 and Reference Pollott and Gootwine2004).
Therefore, the present study aims (a) to describe lactation curves of Lacaune sheep; (b) to investigate the use of mathematical functions to identify the best fitting models to data, in order to describe the complete lactation of dairy Lacaune sheep under intensive production systems; and (c) to identify biological factors affecting Lacaune lactation curve.
Material and methods
Flock and management
This study includes data on milk production for 3677 Lacaune sheep from a single farm for the period between 2005 and 2010. Ewes belonged to a flock of 4000 sheep located at the Cerromonte Farm (Avila, Spain, latitude of 40.90 N, altitude of 900 m). The original flock had been imported from the French Lacaune Association (Upra Lacaune Region of Aveiron) between 2005 and 2006. Its management has previously been described by Hernandez et al. (Reference Hernandez, Elvira, Gonzalez-Martin, Gonzalez-Bulnes and Astiz2011) and is summarized as follows. At the Cerromonte Farm, animals are housed indoors. Food is rationed according to the sheep's production level. Reproductive management includes five mating periods per year in which the different groups of ewes remain with males for 25 days to allow natural mating. Ewe lambs are mated for the first time between 8 and 10 months of age. The mean age at first lambing is 432.9 ± 78.8 days (14.4 months). The ewes are mated again ∼100 to 140 days after lambing. From the day after lambing, ewes are milked twice a day, without suckling period of the lambs, until the milk production drops below 0.5 l/day or until 30 days before the next lambing, when they are dried off.
Performance records were collected, stored and validated using the on-farm Software of Alpro Windows Application (DeLaval, Tumba, Sweden). Between 2005 and 2010, 1372 of 3677 ewes (37.3%) had only one lactation, 975 (26.5%) had two, 800 ewes (21.8%) had three, 499 (13.6%) had four and only 31 ewes (0.8%) had five. Altogether, 664 220 daily milk yield records were taken from 7873 lactations, with an average of 84.37 daily records per lactation and an average of 3.3 daily milk records per week. There were a total of 201 281 weekly milk yield records and an average of 25.6 weekly milk yield records per lactation.
First, a descriptive study of the Lacaune lactation curve was conducted. Given the large amount of individual daily milk data (664 220 records), the ‘real Lacaune lactation curve’ was calculated on the basis of real data, averaging daily milk yields in order to obtain weekly mean values for weeks 1 to 40 of lactation. On the basis of the available data, a global lactation curve was calculated. Afterward, lactations were grouped by lactation number, with 2718 first lactations, 2343 second lactations, 1623 third lactations, 843 fourth lactations and 346 fifth lactations. Lactations were also grouped by length as follows: ‘short’ (S) lactations, lasting ⩽19 weeks, 486; ‘medium’ (M) lactations lasting ⩾20 and ⩽29 weeks, 2685; ‘long’ (L) lactations lasting ⩾30 and ⩽39 weeks, 3231; and ‘extra long’ (XL) lactations lasting ⩾40 weeks, 1471. The L1 or real lactation 1-curve comes from the average of the weekly milk records of 2718 individual first lactations; L2 or lactation 2 originates from the average of the weekly milk records of 2343 second lactations, and so on. The curve of the ‘S’-lactation was calculated with the weekly milk records of 486 individual shortest lactations; the ‘M’-lactation curve with 2685 medium lactations, and so on; have in mind that all these real curves are unique ones.
Models and statistical analysis
Descriptive data were processed with SAS® (version 9.2, 2010, SAS Institute Inc., Cary, NC, USA). Statistical differences in quantitative parameters (lactation length; Supplementary Table S1) for more than two groups were estimated by ANOVA, and a Duncan post-hoc test was conducted to compare the differences between groups. For comparisons in categorical variables (percentages of lactations in each lactation number or category; Supplementary Tables S1 to S2), a χ 2-test was used. Significance was defined as P < 0.05.
A total of four mathematical functions were then chosen from the literature. Two frequently used mathematical functions, Wood and Wilmink functions, were not used because of the already discussed problems and because they have been mainly used for dairy cattle lactation fits but not for sheep lactations. The function developed by Ali and Schaeffer (Reference Ali and Schaeffer1987) has been used in dairy sheep, indeed in Lacaune breed (Oravcová et al., Reference Oravcová, Margetín, Peškovičová, Daňo, Milerski, Hetényi and Polák2006 and Reference Oravcová, Margetín, Peškovičová, Daňo, Milerski, Hetényi and Polák2008; Oravcová, Reference Oravcová2007), but the litter size of the individual sheep is required, and this is a characteristic that is missing in the present study.
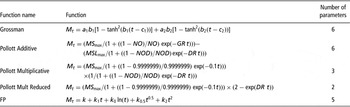
The function proposed by Grossman and Koops (Reference Grossman and Koops1988) is a multiphase model with quite satisfactory results in other studies and in previous studies of our group (data not shown). The parameter Mt of this function is the milk yield in lactation day t. Parameters ai, bi and ci are scaling or declining factors, associated with the slopes of the lactation curve.
On the other hand, a special interest was placed in the functions with biological meaning, such as Pollott (Reference Pollott2000) functions (additive, multiplicative and multiplicative reduced), which provide biological parameters. MS and MSL are the milk secretion potential and loss of potential, respectively, NO and NOD are the proportions of MS and MSL achieved at parturition and GR and DR are the growth and death rate parameters of the two logistic curves.
Finally, for the first time a fitting model called the fractional polynomial Curve Fitting technique (FP; Table 1) was applied. The FP model considers different transformations of the variable time called ‘t’ (powers of t: −2, −1, −0.5, 0.5, 1, 2 and 0≡Ln) to choose the parameters of the mathematical function (Royston and Altman, Reference Royston and Altman1994; Royston and Sauerbrei, Reference Royston and Sauerbrei2008). Indeed, this technique has been previously used to fit growth curves, survival curves or epidemiologic analysis (Royston and Altman, Reference Royston and Altman1994; Lambert et al., Reference Lambert, Smith, Jones and Botha2005; Paladini et al., Reference Paladini, Rustico, Viora, Giani, Bruzzese, Campogrande and Martinelli2005; Cui et al., Reference Cui, de Klerk, Abramson, Del Monaco, Benke, Dennekamp and Sim2009). The subset of four transformed variables was chosen on the basis of R 2 coefficients obtained from the regression. A satisfactory fit was obtained using a subset of four parameters with the following transformations {1, 0, 0.5, 2}, with k, k 1, k 0, k 0.5 and k 2, being the coefficients of the linear equation of FP.
Mathematical functions analyzed to chose the best curves to describe Lacaune sheep lactations under intensive management

FP = fractional polynomial.
Mt = daily milk yield in day t (ai, bi, ci), i = 1, 2 are the parameters of the nonlinear Grossman function (Grossman and Koops, Reference Grossman and Koops1988).
MS and MSL are the milk secretion potential and loss of potential, respectively; NO and NOD are the proportions of MS and MSL achieved at parturition; and GR and DR are the growth and death rate parameters of the two logistic curves (Pollott, Reference Pollott2000).
k, k 1, k 0, k 0.5 and k 2 are the coefficients of the linear equation of FP.
To compare our data with those of other studies, we performed fits using the central day of week (t = day = 7 × week − 3; week = 1 to 40).
The nonlinear functions were fitted using the iterative curve fitting procedure NLIN incorporated into the SAS software. The parameters of each curve were estimated using the least squares method, and the computational strategy of Marquardt was used to search for the ‘best fit’ solution. In order to evaluate the different mathematical models, the residual mean square (RMS), Durbin Watson (DW) statistic and Runs Test (Bradley, Reference Bradley1968) were calculated.
The RMS values, which serve as a measure of goodness of fit, were calculated using the formula:
 $$RMS = \mathop{\sum}\limits_{t\: = \:{\rm{1}}}^N {{{{\left( {{{M}_{t\:{\rm{est}}}}\,{\rm{ - }}\,{{M}_{t\:{\rm{real}}}}} \right)}}^2} \:{\rm{/}}\:\left( {N\,{\rm{ - }}\,Q} \right)} $$
where Mt est and Mt real are, respectively, the estimated and ‘real’ mean daily milk yields in each of the N = 40 lactation weeks, Q is the number of parameters in the model. The smaller the residuals, the better is the fit.
The DW statistic (Durbin and Watson, Reference Durbin and Watson1951) was used as a measure of first-order positive autocorrelation to test whether the residuals were randomly distributed. The closer the DW value is to 2, the greater is the extent of randomness and the better is the fit of the model. The determination coefficients (R 2), square of the correlation coefficients between the observed and modeled values were also given. Finally, ‘Runs Test’ was used in order to test the randomness of the distribution of the residuals derived from fitting the models to the mean Lacaune lactation data for all lactation numbers (‘global lactation’), as well as the data for individual lactation numbers 1 to 5 (Bradley, Reference Bradley1968). This test originates significances of the randomness. Lesser significance means better fit of the mathematical model, because it means that there is a stronger randomness of the residual distribution. On the basis of these goodness-of-fit parameters (Tables 3 to 4), the two best curves were chosen for subsequent study to analyze their fit to the real Lacaune lactation curve. In addition, in order to calculate a statistical evidence of the difference between models, we compared pairwise the residuals series of each model and studied them with a parametric test (t of Student; Tables 5 to 6).
Results
Descriptive study of the real Lacaune lactation curve
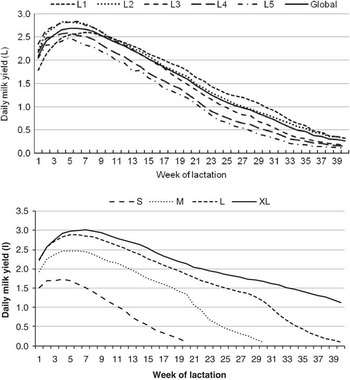
The changes in yield throughout the lactation showed the usual lactation curve pattern with an average milk yield of 424.41 l and 32-week length. The peak milk yield in the first lactation (week 7) occurred later, and smaller, than the peak in subsequent lactation numbers and the peak in the global lactation curve. The total milk yield declined with lactation number and increased with lactation length. The persistency on day 150 was minimal by the second lactation (13.5 ml/day) and maximal by the fifth (17.4 ml/day). All these data are depicted in Figure 1 and concrete numerical data are summarized in Supplementary Tables S1 and S2.
Mean values of daily milk yield (L) by week of lactation. Data for lactations 1 to 5 (L1 to L5) and lactations classified by length (short (S), ⩽19 weeks; medium (M), ⩾20 and ⩽29 weeks; long (L), ⩾30 and ⩽39 weeks; extra long (XL), ⩾40 weeks) are shown until week 40 of lactation, and are based on 7873 records of complete lactations.

Cumulative milk yield data showed that in all lactations the sheep achieved 50% of the total milk yield during the first 10 to 13 weeks (mean, week 12), 75% of the milk yield during the first 16 to 20 weeks (mean, week 19), 90% during the 22 to 27 weeks (mean, week 26) and 95% during the weeks 25 to 30 (mean, week 29). In lactations 4 and 5, these yields were reached earlier. First-lambing ewes produced 50%, 75%, 90% and 95% of the total milk yield, respectively, during the weeks 13, 20, 27 and 30. The length of the global curve was of 32 weeks, with the longest curve being the first lactation (34 weeks) and subsequent lactations becoming progressively shorter (P < 0.01). A total of 80% of the lactations lasted ⩽39 weeks, and 75% of them lasted at least 37 weeks. The minimum length of lactations reached by 80% of the flock was 23 weeks (Figure 1 and Supplementary Table S2).
When the lactations were classified by their length as S, M, L and XL (see “Material and methods”), first lactations took the form of L and XL lactations significantly more often than S or M (P < 0.05), whereas lactations 4 and 5 were predominantly S lactations. The yield characteristics of the different lactation lengths are shown in Figure 1. The longer the lactation lasted, the higher the total milk yield and the milk peak.
Lactation curves and function fitting
Average data permit first approach to Lacaune lactation curve. However, in order to predict milk yields and for further studies about factors that affect milk production (and lactation curve), an appropriate mathematical model is required.
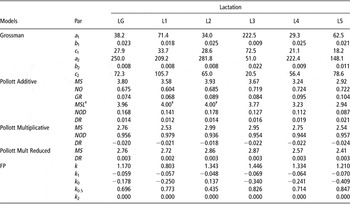
The values of the parameters for each model derived from fitting the different functions to the real Lacaune lactation curve for each lactation are presented in Table 2.
Values of the parameters in five mathematical fitting models to the Lacaune lactation curve in each lactation number (L1 to L5) and in the mean LG curveA

LG = global lactation; Par = parameters; FP = fractional polynomial.
Mt = daily milk yield in day t (ai, bi, ci), i = 1, 2 are the parameters of the nonlinear Grossman function (Grossman and Koops, Reference Grossman and Koops1988).
MS and MSL are the milk secretion potential and loss of potential, respectively; NO and NOD are the proportions of MS and MSL achieved at parturition; and GR and DR are the growth and death rate parameters of the two logistic curves (Pollott, Reference Pollott2000).
k, k 1, k 0, k 0.5 and k 2 are the coefficients of the linear equation of FP.
†MSL restricted to a maximum value of 4 because of discordance from expected values.
AValues of parameters are unique values taken from the fit of each model to the unique curve, which is obtained from the average data of all lactations. Statistical comparisons cannot be performed.
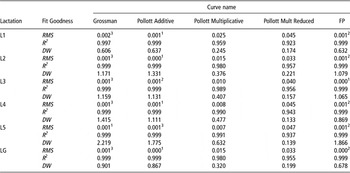
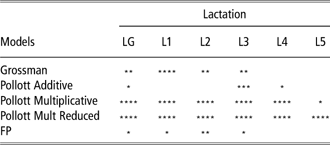
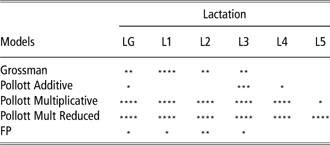
The goodness-of-fit results of each model are described in Tables 3 to 4. Analyses of RMS and DW values showed that the Grossman, Pollott Additive and FP models had the smallest RMS, the biggest R 2 and the closest to 2 DW values (Table 3). The Runs Test was conducted to determine whether residual values were random. The results show that Pollott Additive and FP models showed randomization of residuals for the most lactation numbers (Table 4). Furthermore, the t-test showed no statistical difference in the residuals series when comparing FP and Pollott Additive (P = 0.871). All other comparisons between models were significant with P < 0.05. Thus, the Pollott Additive and FP functions can be considered to fit the real Lacaune lactation curve accurately.
Analysis of the goodness of fit of five mathematical models to Lacaune lactation data for different lactation numbers (L1 to L5) and LG, based on RMS, R 2 and DW valuesA

LG = global lactation; FP = fractional polynomial; RMS = residual mean square; R 2 = determination coefficient; DW = Durbin Watson.
Superscripts 1 to 3 indicate ranking based on goodness of fit to the real Lacaune lactation by RMS, with 1 being the best.
AValues of parameters are unique values taken from the fit of each model to the unique curve, which is obtained from the average data of all lactations. Statistical comparisons cannot be performed.
Runs Test results to check the randomness of the distribution of the residuals between the five models and the real Lacaune lactation data for lactations 1 to 5 (L1 to L5) and LG
LG = global lactation; FP = fractional polynomial.
Significance means no randomization, that is, the bigger the P-value, the better is the fit.
The best models are the models with the less significances (Pollott and FP).
*P < 0.05; **P < 0.01; ***P < 0.001; ****P < 0.0001.
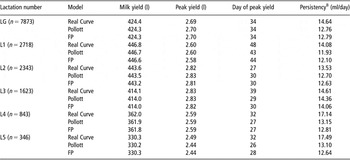
Comparison of Lacaune milk yield characterization data for LG and lactations 1 to 5 (L1 to L5) and estimated milk yield characterization data generated by the two best mathematical modelsA

LG = global lactation; FP = fractional polynomial.
APairwise comparison of residual series (t of Student) between the two models (Pollott and FP) was not significant (P = 0.871).
BPersistency (loss of milk yield per day) is calculated for day 150 of lactation.
Milk yield characteristics from the better two models
Milk yield to day 280, peak yield, peak time and persistency at day 150 of lactation were estimated using the two best functions and compared with the real Lacaune lactation curve (Table 5). The real Lacaune global lactation curve (all lactations together, n = 7873) had a total milk yield of 424.4 l, with a peak of 2.69 l on day 34 and a persistency of 14.64 ml/day. For the global lactation curve, the Pollott and FP functions were accurate at estimating total milk yield (deviations of <0.2 l) and the day of peak yield (deviation = 0). Both models overestimated the peak yield by <0.01 l and the persistency at day 150 of lactation was underestimated by 1.9 ml/day by both models.
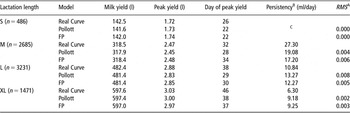
For both models, estimates of the day when 50% of the total milk yield was achieved were 1 week later than in reality and estimates of when 75%, 90% and 95% of total milk yield were achieved were later than the real curve by 2, 3 and 4 weeks, respectively. In general, the deviations of estimated values were very small in all cases for both functions (Table 5). Analysis of the model fit to lactations of different length based on RMS values, Pollott showed smaller values in S, M and XL lactations. Nevertheless, RMS values of both models were <0.01 for nearly all fits across all four lactation groups (Table 6).
Comparison of Lacaune real milk yield characterization data for different lactation lengths and estimated milk yield characterization data generated by the two best mathematical models (Pollott Additive and FP), together with RMS values of the fitsA

FP = fractional polynomial; RMS = residual mean square.
Lactation length categories were: short (S), ⩽19 weeks; medium (M), ⩾20 and ⩽29 weeks; long (L), ⩾30 and ⩽39 weeks; extra long (XL), ⩾40 weeks.
APairwise comparison of residual series (t of Student) between the two models (Pollott and FP) was not significant (P = 0.871).
BPersistency (loss of milk yield per day) is calculated for day 150 of lactation.
CThe persistency of the S group could not be calculated because the lactations were shorter than 150 days of length.
Discussion
Although the lactation of sheep has been extensively studied, data on complete lactation periods are rare. The present study offers, for the first time, information on the complete lactation curve of Lacaune dairy ewes, describing the characteristics of the global lactation curve and the individual curves of lactations 1 to 5. Furthermore, this study compares the ability of five mathematical functions to model the Lacaune lactation curve. Results indicate that FP and Additive Pollott functions are the most accurate for modeling milk yield data of Lacaune sheep under intensive management.
Descriptive study of the Lacaune lactation curve and biological interpretation
As previously reported in Lacaune sheep (Hernandez et al., Reference Hernandez, Elvira, Gonzalez-Martin, Gonzalez-Bulnes and Astiz2011) and Asaff sheep (Pollott and Gootwine, Reference Pollott and Gootwine2004), the mean milk yield per lactation and the length of lactation decreased with lactation number, that is, with the age of the sheep. The decrease between lactations 1 and 2 was slight, but it increased from lactation 2 onward. The negligible difference in milk yield between lactations 1 and 2 probably reflects the fact that the mean age for first lambing was 432.9 ± 78.8 days (14.4 months), and that the maiden sheep were well-developed at the first lambing (Pollott and Gootwine, Reference Pollott and Gootwine2004).
The peak of lactation occurred 27 to 48 days after lambing, depending on the lactation number. This fact has previously been described for Lacaune and other sheep breeds (Pollott and Gootwine, Reference Pollott and Gootwine2000 and Reference Pollott and Gootwine2004; Ruiz et al., Reference Ruiz, Oregui and Herrero2000; Peralta-Lailson et al., Reference Peralta-Lailson, Trejo-González, Pedraza-Villagómez, Berruecos-Villalobos and Vasquez2005; Oravcová et al., Reference Oravcová, Margetín, Peškovičová, Daňo, Milerski, Hetényi and Polák2006). Peak yield was highest in lactations 2 and 3 and it decreased in lactations 4 and 5. Similarly, Oravcová et al. (Reference Oravcová, Margetín, Peškovičová, Daňo, Milerski, Hetényi and Polák2006) observed higher peak yield in lactation 2 than those in lactations 1 or 3. Like peak yield, the persistency of each curve, defined here as the loss of milk yield per day at day 150 of lactation, differed by lactation number, with lactation 2 showing the smallest loss and lactations 4 and 5 the greatest. Our results show that each lactation number follows a slightly different pattern, probably related to the biology of the mammary gland during lactation, the timing of apoptosis onset and the development of secretory cells. Observing Pollott parameters, it can be concluded that the biology of the udder in the primiparous sheep is different during the first lactation, when compared with further lactations (reduced NO, GR and NOD, with maximal MS, MSL and minimal DR). This is probably because of the different metabolisms of the still growing animal (Pollott and Gootwine, Reference Pollott and Gootwine2004). We observed that the maximum MS is notably reduced in lactations 4 and 5, although the udder of aged ewes is nearer to its maximum potential at the start of lactation (parameter NO). Despite these efforts of the udder of aged ewes to enhance milk yield, the final production declines from second lactation onward. Finally, the parameter DR (relative decline in cell numbers as lactation progresses meanly because of apoptosis) rises with lactation number. Hence, the main reasons for the loss of length and milk yield potential in older sheep may be the reduction in the potential of secretion, together with the progressing decline in the udder cells. The former condition could be influenced not only by the age but also by the level of nutrition, and the latter may be influenced by the time of pregnancy (Pollott, Reference Pollott2000). In the farm of the present study, the level of nutrition is the same for all ewes in production, according to the sheep's production level and without grazing.
Similar to different lactation numbers, lactations of different length showed changes in milk yield. S, M, L and XL lactations presented typical lactation curves that paralleled one another, but total milk yield and peak yield increased with lactation length.
Lactation curves and model fitting
To compare the ability of five mathematical models to fit Lacaune lactation curve data, RMS, R 2 and DW values were used. In contrast to Pollott and Gootwine (Reference Pollott and Gootwine2000), in the present study better results with the additive Pollott function than with the multiplicative Pollott models were obtained. The reduced versions of the multiplicative biological model did not result in a better fit to Lacaune sheep lactations. Morant and Gnanasakthy (Reference Morant and Gnanasakthy1989) experienced similar problems when fitting data with nonlinear functions. This was one of the reasons to discard other nonlinear and frequently used models, mainly in dairy cattle, such as the Wilmink function (Wilmink, Reference Wilmink1987) or the logarithm-based model by Ali and Schaeffer (Reference Ali and Schaeffer1987). In the case of the latter model, when used in sheep lactations, the litter size of the individual sheep was required (Oravcová et al., Reference Oravcová, Margetín, Peškovičová, Daňo, Milerski, Hetényi and Polák2006; Oravcová, Reference Oravcová2007; Oravcová et al., Reference Oravcová2008), a characteristic that is missing in the present study.
On the other hand, the advantage of the use of these nonlinear functions is the goodness of the fit with scarcity of daily milk records per lactation. The suitability of the models also depends on individual trends in daily milk yield, which vary among cows and among lactations of the same animal. The ability to capture this information depends on the amount of data available and on its distribution during lactation (Silvestre et al., Reference Silvestre, Petim-Batista and Colaco2006). A similar limitation exists with the number of parameters required of the fitting curve. The more the parameters, the more available data are required (Pool and Meuwissen, Reference Pool and Meuwissen2000). It is considered in general that lactation models should have as few parameters as possible while still showing good fit to the data (Bebbington et al., Reference Bebbington, Lai and Zitikis2009). However, this factor was not a limiting factor in our study, given the huge amount of available data of each individual lactation. This could be the reason for the better fit of the Pollott additive when compared with the Pollot multiplicative.
The FP model fit the real data as well as the Additive Pollott model. The slightly different performance we observed for the Pollott Additive function and the clearly worst fit of the multiplicative models, probably reflect differences between the present trial and the other studies. Whereas the study in which the function was first described (Pollott and Gootwine, Reference Pollott and Gootwine2000) examined a more limited set of data for the Awassi breed, in the current work extensive data for the Lacaune breed were analyzed. The primary advantage of FP over other functions is the ease of calculation. The Grossman model showed good results, similar to the study by Groenewald et al. (Reference Groenewald, Ferreira, van der Merwe and Slippers1995) on sheep, but with a more complex function.
On the basis of these results, we chose these two functions to continue with the study: Pollott Additive and FP. The pairwise comparison of these two models resulted in no significance between the models (P = 0.871); the observed RMS values were <0.1 in all cases and <0.01 in more than 50% of cases; and these residuals are smaller than those reported in other studies (Pollott and Gootwine, Reference Pollott and Gootwine2000; Ruiz et al., Reference Ruiz, Oregui and Herrero2000), suggesting that both models gave an overall satisfactory fit to the lactation data from this farm and may be useful for further studies analyzing the factors that affect Lacaune lactation curves.
Conclusion
These results indicate that the most accurate and easy methods to fit an experimental Lacaune lactation curve in order to predict milk yields are the FP and the Additive Pollott functions (Pollott, Reference Pollott2000). The Lacaune lactation curve varies with lactation number and lactation length, differing in milk yield, peak milk yield, week of peak yield and persistency. Using a reliable lactation model that captures these variations may allow early detection of ewes with low milk yield potential, which can be managed in a way that optimizes farm profitability. In addition, these models will allow further studies about factors affecting milk production and lactation curve characteristics.
Acknowledgements
The authors would like to thank Frank Wallner for assistance with data collection, Antonio Gonzalez-Bulnes for his critical revision and the farm workers who managed the flock for their collaboration.