Cardiovascular diseases are the leading cause of death and loss of disability-adjusted life years in the world, with about four-fifths of the burden occurring in low-income and middle-income countries.Reference Murray and Lopez1, Reference Yusuf, Reddy, Ôunpuu and Anand2 Although most cases occur in these nations, cardiovascular research into the problems has been focused on developed countries, with their particular genetic and cultural background. Recently, a case-control study among 52 countries showed that population-attributable risk of coronary arterial disease for high blood pressure is higher in South America compared to North America and Europe.Reference Yusuf, Hawken and Ounpuu3 In Brazil, as elsewhere in the world, the increasing prevalence of obesity among adultsReference Sichieri, Coitinho, Leao, Recine and Everhart4, Reference Monteiro, Benicio, Conde and Popkin5 raises concerns about trends in rates of cardiovascular mortality. The long-term decline in these rates has levelled off over the last 10 years, albeit that the increasing obesity of the ageing population will probably militate against the decline in these rates of death.Reference Lotufo6 An important component of adult obesity is an excessive gain of weight during childhood and adolescence, which increases the burden of cardiovascular risk, including elevated blood pressure, during adulthood.Reference Guo, Roche, Chumela, Gardner and Siervogel7 Paediatricians and managers of health care, who have traditionally focused on malnutrition in these children, must now also be on the alert for overnutrition.Reference Popkin, Richards and Monteiro8 The identifying children who are becoming obese, or who are already obese, however, poses some diagnostic problems.
The determination of indexes of skin-fold thicknesses, waist circumference, and the correlation between weight and height, in other words the body-mass index, all have important limitations.Reference Pietrobelli and Steinbeck9–Reference Freedman, Khan, Serdula, Dietz, Srinivasan and Berenson13 Recent work examining the relation between measures of adiposity on the risk of hypertension in Germany has shown that body mass index is the better predictor.Reference Reich, Müller, Gelbrich, Deutscher, Gödicke and Kiess14 We designed our study, therefore, to verify the impact of weight on blood pressure among children and adolescents in a society undergoing a profound shift from undernutrition to overnutrition.
Methods
A cross-sectional study of cardiovascular risk factors was performed over the period 1998 and 1999 in Belo Horizonte, the third largest metropolitan area in Brazil. A two-stage cluster sampling plan was used to select the sample. Initially, 20 schools were randomly selected from the 521 public and private schools in the city. Within each school, two classrooms were randomly selected, and all students from those classrooms were included in the sample. At the end of this process, the study had sampled 1,450 students, aged from 6 to 18 years. For this kind of plan, the size of the sample was selected so that, for the first and second stage units, the α and β errors were equal to 0.05 and 0.20, respectively.Reference Kish15 We considered the prevalence of measurements of high blood pressure as the main outcome for the determination of sampling.Reference Oliveira, Lamounier, Oliveira, Danasio and Oliveira16 All students were invited to complete a questionnaire, and undergo measurements of blood pressure and adiposity. All tests and measurements were performed on site at the respective schools. Prior to collection of the data, the questionnaire was tested in 2 schools to ensure that its contents, and the format of the response, were appropriate for the students and their parents. Institutional review board approval for collection of the data was obtained from all institutions involved in the study.
Of the 1,450 students selected for the study, 1,403 answered the questionnaire and underwent measurement of all the chosen anthropometric variables. Because the number of Asian and Amerindian students was small, we included only the reports from the students of white race, at 45% of the sample, mixed race at 40.4%, and black race at 14.5%. For the purposes of analysis, we included the students of white and mixed race as a single category, as they showed no significant statistic difference in the process of modelling. We divided the subjects into children aged from birth to 11 years, and adolescent from 12 to 18 years, according to Medical Subject Headings.17 Criterions of puberty were not used for definitions of these stages to avoid constraints that might have required physical examinations. We included in the sample only children above the age of 6, which is when they enter school.
Anthropometric measurements included weight, height, waist and hip circumferences, and measurements of the skin folds in the triceps, subscapular, and suprailiac areas. All measurements were made as standard procedures described elsewhere.Reference Gibson18 All students were examined dressed in light clothing. Height was measured to the nearest 0.1 centimetre using a portable stadiometer, and weight to the nearest 0.1 kilogram, with the participant wearing light clothing and no shoes. Skinfold thickness was recorded to the nearest 1 millimetre by use of Lange skinfold calipers, produced by Cambridge Scientific, Cambridge, Massachusetts, United States of America. The means of these multiple anthropometric measurements were used for all analyses. Body mass index was calculated as weight in kilograms divided by height in metres squared. Age was computed from the reported birth date. To assess the prevalence of childhood obesity in this population, and to infer the risk of subsequent obesity-related disease, we used the 85th percentile for body mass index for age and gender as the cutpoint for defining excess weight.Reference Gibson18
Blood pressure was measured with the student in a seated position after a 5 minute rest in a quiet room. We took paired measurement of systolic and fifth-phase diastolic pressures to the nearest 2 mmHg, with an interval of at least10 minutes between the measurements, using a Tycos mercury sphygmomanometer placed on the right arm, with the cuff chosen according to the recommendations of the American Heart Association.Reference Frolich, Grim, Labarthe, Maxwell, Perloff and Weidman19 The average of the 2 measurements was used in the analyses. We combined the classical categories of high, normal blood pressure, and hypertension into a single category of elevated high blood pressure, which then included all values above the 90th percentile considering age, gender and height.
Race was determined only by identification of skin colour. Socioeconomic state was based on the scores produced by the Brazilian Association of Market Research Institutes based on a validated questionnaire that asked about ownership of housing, car, household appliances such as a refrigerator, washing machine, and so on.20 The five categories emerging from this questionnaire were combined into classes of high and low socioeconomic state.
All tests were based on the 0.05 level of significance. The analyses were performed using SPSS for Windows as produced by Release 8.0, Chicago, Illinois, United States of America. We performed univariate analyses for testing between variable differences in the groups using the independent sample t test, and used the chi-square test of independence for continuous and discrete variables.
The independent association of potential predictors of elevated levels of blood pressure was examined using logistic regression. The selection of the final models was performed by the backward method of variable selection, since it usually keeps more variables in the final model.
Results
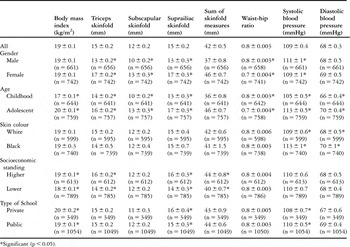
Of the participants, 76% were enrolled at public schools, and 56% had a lower position in the socioeconomic standings. We found that 8.4% of the sample was deemed to be overweight on the basis of having a body mass index for age between the 85th and 94th percentiles, while 3.1% proved to be obese, having body mass indexes for age equal to or greater than the 95th percentile. In Table 1, we show the distribution of the mean values of anthropometric and blood pressure measurements. Body mass index was higher among students from private schools than public schools, and in adolescents compared to children. As expected, skinfold measurements and the ratio of the circumferences at the waist and hip ratios were higher among girls, with measurements of skinfolds also being higher in adolescents. We also found higher mean values for the sum of the measurements of the skinfolds among students with a higher socioeconomic standing. Higher mean values of blood pressure were detected among blacks when compared to whites, and among students from the public schools when compared to those attending the private schools. Adolescents showed significant higher values for blood pressure compared to children. Although, the proportion of those with a body mass index greater than the 85th percentile was higher among those attending private schools, the frequency of the mean value for systolic blood pressure was lower among children and adolescents attending the private schools.
Means and standard errors of adiposity and measurements of blood pressure according to sociodemographic variables.

*Significant (p < 0.05).
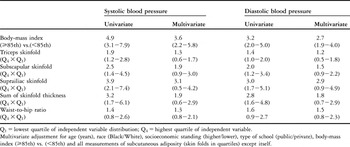
In Table 2, we show that body mass index was strongly associated with high blood pressure. When all covariates implicated in this association, such as age, race, and socioeconomic standing, along with the other measurements of adiposity, were added to the model, the only remaining predictor of high blood pressure proved to be the body mass index. Analysis of neither the waist circumference, nor the ratio of circumferences at the waist and hip, revealed any materially significant association.
Univariate and multivariate odds ratios and 95% confidence intervals of blood pressure greater than the 90th percentile according to specific measurements of adiposity.

Q1 = lowest quartile of independent variable distribution; Q4 = highest quartile of independent variable.
Multivariate adjustment for age (years), race (Black/White), socioeconomic standing (higher/lower), type of school (public/private), body-mass index (⩾85th) vs. (<85th) and all measurements of subcutaneous adiposity (skin folds in quartiles) except itself.
Discussion
Our population-based study of children and adolescents has verified the assertion that body mass index is a more appropriate measure of the effect of weight on blood pressure than measurements of skinfold thickness, or the circumferences of the waist and hip. This fact was first suggested by a study performed in Germany,Reference Reich, Müller, Gelbrich, Deutscher, Gödicke and Kiess14 based on a cohort of over 2,000 children aged 10 years and older. That study, however, also revealed a positive association between measurements of skinfold thickness and high blood pressure, while ours showed that, after multivariate adjustment, these measures were not significantly associated with elevated levels of blood pressure. We can explain the lack of any significant association with the ratio of waist to hip circumferences on the basis of the proportionately larger increases in the circumferences at the hip compared to the waist observed by others during growth.Reference Weststrate, Deurenberg and van Tinteren21
Within our cohort, we encountered an apparent contradiction when those attending private and public schools are compared in terms of body mass index, which was proportionately higher in those attending private schools, and systolic blood pressure, which was proportionally elevated in those attending public school. We speculate that not only nutritional variables, such as the body mass index, are of significance in the determination of high blood pressure, but that other stressors could be involved, such as dietary factors and weight at birth.Reference Chiolero, Bovet, Paradis and Paccaud22
The strengths of our study include the low rates of refusal amongst those invited to participate, the almost complete inclusion of the targeted sample in the final results, with only 5 participants excluded due to lack of data, that all measurements were performed twice by trained personnel, and our ability to include children from a wide spectrum of social and racial groups in a large metropolitan area, where there has been a recent shifting of nutritional patterns from stunting to excess weight. Potential limitations of our study include the cross-sectional design, which precludes us from making definitive causal inferences, as well as a potential bias due to the measurement of the arm fatness and its relation with blood pressure.Reference Reich, Müller, Gelbrich, Deutscher, Gödicke and Kiess14
We conclude that the body mass index is a better predictor of elevated blood pressure among children and adolescents than either the skinfold thickness or the ratio of the circumference of the waist and the hip. The application of the body mass index in the paediatric setting could offer new approaches for reigning in the adverse outcomes of the increasing epidemic of obesity, such as high blood pressure.
Funding: Grants from Conselho Nacional de Pesquisa, Brasília, Brazil and Fundação de Assistência à Pesquisa do Estado de Minas Gerais, Belo Horizonte, Brazil.