1 Introduction
Turbulent convection in a fluid contained between two parallel horizontal plates and heated from below (Rayleigh–Bénard convection or RBC; for reviews see Kadanoff (Reference Kadanoff2001), Ahlers (Reference Ahlers2009), Ahlers, Grossmann & Lohse (Reference Ahlers, Grossmann and Lohse2009c
), Lohse & Xia (Reference Lohse and Xia2010) and Chillà & Schumacher (Reference Chillà and Schumacher2012)) contains two thin laminar boundary layers (BLs), one below the top and the other above the bottom plate, when the Rayleigh number
 $Ra$
is not too large. When the fluid properties (except for the density where its temperature dependence drives the flow) are temperature-independent (Oberbeck–Boussinesq (OB) conditions; Oberbeck (Reference Oberbeck1879) and Boussinesq (Reference Boussinesq1903)), then both BLs are of equal thickness and each sustains an equal temperature difference nearly equal to
 ${\rm\Delta}T/2$
, where
 ${\rm\Delta}T\equiv T_{b}-T_{t}$
. Here,
 $T_{b}$
and
 $T_{t}$
are the temperatures at the bottom and top plates respectively. The sample centre temperature then is
 $T_{c}=T_{m}$
, where
 $T_{m}\equiv (T_{b}+T_{t})/2$
. The fluid not too close to the BLs, known as the ‘bulk’, is strongly turbulent but nearly isothermal in the time average (see, however, Ahlers et al. (Reference Ahlers, Bodenschatz, Funfschilling, Grossmann, He, Lohse, Stevens and Verzicco2012a
), Ahlers, Bodenschatz & He (Reference Ahlers, Bodenschatz and He2014) and Wei & Ahlers (Reference Wei and Ahlers2014)), with a vigorously fluctuating temperature (He et al.
Reference He, van Gils, Bodenschatz and Ahlers2014). The BLs emit thermal plumes at irregular time intervals which rise or fall through the bulk and, by virtue of their buoyancy, drive and in turn are carried by a large-scale circulation (LSC). For cylindrical samples with height
 $L$
approximately equal to the diameter
 $D$
(aspect ratio
 ${\it\Gamma}\equiv D/L\simeq 1$
), the LSC consists of a single convection roll with rising fluid near the wall at an azimuthal location
 ${\it\theta}_{0}$
and falling fluid also near the wall but close to
 ${\it\theta}_{0}+{\rm\pi}$
.
The state of the system depends on
 $Ra\equiv g{\it\alpha}{\rm\Delta}TL^{3}/({\it\kappa}{\it\nu})$
and the Prandtl number
 $Pr\equiv {\it\nu}/{\it\kappa}$
. Here,
 $g$
,
 ${\it\alpha}$
,
 ${\it\kappa}$
and
 ${\it\nu}$
denote the gravitational acceleration, the isobaric thermal expansion coefficient, the thermal diffusivity and the kinematic viscosity respectively. The system described in the previous paragraph is referred to as ‘classical’ RBC. When
 $Ra$
reaches a certain value
 $Ra^{\ast }$
, it is expected theoretically (Kraichnan Reference Kraichnan1962; Spiegel Reference Spiegel1971; Grossmann & Lohse Reference Grossmann and Lohse2011) that the laminar BLs of the classical state will also become turbulent due to the shear applied by the LSC, as well as by fluctuations on somewhat smaller scales. Above
 $Ra^{\ast }$
the system is said to be in the ‘ultimate’ state, as this state is expected to persist up to arbitrarily high
 $Ra$
(Chavanne et al.
Reference Chavanne, Chilla, Castaing, Hebral, Chabaud and Chaussy1997). A theoretical estimate gave
 $Ra^{\ast }=O(10^{14})$
for
 $Pr$
near 1 (Grossmann & Lohse Reference Grossmann and Lohse2002). Several experimental papers reported transitions found from measurements of the heat transport, expressed as the Nusselt number
 $Nu={\it\lambda}_{eff}/{\it\lambda}$
, where
 ${\it\lambda}$
is the thermal conductivity of the quiescent fluid and
 ${\it\lambda}_{eff}=QL/(A{\rm\Delta}T)$
. Here,
 $Q$
is the heat flux and
 $A$
is the cross-sectional area of the cell. The results of Chavanne et al. (Reference Chavanne, Chilla, Castaing, Hebral, Chabaud and Chaussy1997, Reference Chavanne, Chilla, Chabaud, Castaing and Hebral2001) and Roche et al. (Reference Roche, Gauthier, Kaiser and Salort2010) (the ‘Grenoble’ data, obtained with fluid helium at a temperature of approximately 5 K and a pressure of approximately 2 bars) found transitions in the
 $Ra$
range from
 $10^{11}$
to
 $10^{12}$
, which in our view (but not that of the authors) is too low to correspond to a BL shear instability, although the data clearly show a sharp and continuous transition which, we believe, is of unknown origin (see Ahlers et al.
Reference Ahlers, He, Funfschilling and Bodenschatz2012b
). Measurements of
 $Nu$
and of the Reynolds number
 $Re_{V}=VL/{\it\nu}$
(
 $V$
is the root-mean-square fluctuation velocity) made with compressed sulphur hexafluoride (SF
 $_{6}$
) at ambient temperatures and pressures up to 19 bars also found a transition (Ahlers et al. (Reference Ahlers, He, Funfschilling and Bodenschatz2012b
), He et al. (Reference He, Funfschilling, Bodenschatz and Ahlers2012a
,Reference He, Funfschilling, Nobach, Bodenschatz and Ahlers
b
) and He et al. (Reference He, van Gils, Bodenschatz and Ahlers2015); the ‘Göttingen’ data), but at
 $Ra^{\ast }\simeq 10^{14}$
in agreement with the theoretical estimate of Grossmann & Lohse (Reference Grossmann and Lohse2002).
Here, we present a study of the azimuthal diffusivity
 $D_{{\it\theta}}$
of the LSC (§ 3.1). The LSC is a stochastically driven system, with the driving due to the small-scale fluctuations (Brown & Ahlers Reference Brown and Ahlers2007a
, Reference Brown and Ahlers2008). In view of the rotationally invariant geometry of the cylindrical sample,
 ${\it\theta}_{0}$
ideally should diffuse azimuthally in the presence of the stochastic driving and have a uniform probability distribution
 $p({\it\theta}_{0})=1/(2{\rm\pi})$
. However, in real experiments
 $p({\it\theta}_{0})$
always is found to have a maximum even when extraordinary care is used in preparing the sample cell, indicating that the rotational symmetry is broken by some external force or remaining internal imperfection. Nearly a decade ago, it was shown that the symmetry breaking by the Earth’s Coriolis force is sufficient to yield the
 $p({\it\theta}_{0})$
observed in an experiment (Brown & Ahlers Reference Brown and Ahlers2006a
). A simple Navier–Stokes-based model for the azimuthal potential due to the Coriolis force revealed that
 ${\it\theta}_{0}$
should be very close to west. Solving a Fokker–Planck equation with this model potential and a noise intensity derived from the measured
 $D_{{\it\theta}}$
yielded a
 $p({\it\theta}_{0})$
that agreed quantitatively with experiment. For that case the Prandtl number was 4.38 and
 ${\it\Gamma}=1.00$
. Two samples were investigated, one with
 $L=24.8$
and the other with
 $L\simeq 50$
cm. The Rayleigh number was in the range
 $3\times 10^{8}\lesssim Ra\lesssim 10^{11}$
.
The present study is for a physically larger sample, with
 $L=D=112$
cm, and with the smaller
 $Pr\simeq 0.8$
. Rayleigh numbers ranged from
 $2\times 10^{12}$
to
 $1.5\times 10^{14}$
and thus were much larger than in the previous work. Again, we found that the preferred
 ${\it\theta}_{0}$
was close to west, consistent with the Earth’s Coriolis force. We also measured
 $D_{{\it\theta}}$
and determined the corresponding Reynolds number
 $Re_{{\it\theta}}=L\sqrt{D_{{\it\theta}}/{\it\nu}}$
. Comparison with an extrapolation of the earlier data indicates consistency with
 $Re_{{\it\theta}}\propto Pr^{1.2}$
, a Prandtl-number dependence found before for
 $Re_{V}$
(He et al.
Reference He, van Gils, Bodenschatz and Ahlers2015). Quite remarkably, the diffusivity measurements confirmed that the ultimate-state transition occurs over a range of
 $Ra$
, from
 $Ra_{1}^{\ast }\simeq 2\times 10^{13}$
to
 $Ra_{2}^{\ast }\simeq 8\times 10^{13}$
, as was found earlier from measurements of
 $Nu(Ra)$
and
 $Re_{V}(Ra)$
.
We also present new measurements of
 $Nu$
which are for the same sample as that used for the study of the azimuthal diffusion. They, as well as
 $Re_{V}$
measurements reported before (He et al.
Reference He, van Gils, Bodenschatz and Ahlers2015) for a different sample with
 ${\it\Gamma}=1.00$
, reveal the ultimate-state transition and all three physical properties yield consistent results for
 $Ra_{1}^{\ast }$
and
 $Re_{2}^{\ast }$
, as shown below in figure 4.
Recently, it was claimed by Skrbek & Urban (Reference Skrbek and Urban2015) that the temperature dependence of fluid properties (non-OB conditions) may be responsible for the transitions seen in the Grenoble and Göttingen data and that hypothetical corresponding data for an OB system may not show any transitions. In § 4 we show two reasons why this claim is flawed.
2 Apparatus and procedure
The apparatus has been described elsewhere (Ahlers, Funfschilling & Bodenschatz Reference Ahlers, Funfschilling and Bodenschatz2009b
; Ahlers et al.
Reference Ahlers, He, Funfschilling and Bodenschatz2012b
, Reference Ahlers, Bodenschatz and He2014). It consisted of a sample cell located inside a vessel known as the ‘Uboot of Göttingen’ which was pressurized with sulphur hexafluoride (SF
 $_{6}$
) at an average temperature
 $T_{m}=21.5\,^{\circ }\text{C}$
and at pressures that ranged from 2.0 to 17.7 bar, resulting in the relatively narrow Prandtl-number range from 0.78 to 0.86 over the
 $Ra$
range from
 $2\times 10^{12}$
to
 $1.5\times 10^{14}$
(see figure 1b of Ahlers et al. (Reference Ahlers, Bodenschatz and He2014)). The Uboot had a volume of approximately
 $25~\text{m}^{3}$
, and approximately 2000 kg of SF
 $_{6}$
was required to fill it to the maximum pressure. The sample cell had aluminium plates at the top and bottom that were separated by a distance
 $L=112$
cm and had an aspect ratio
 ${\it\Gamma}=1.00$
. The plates were levelled relative to gravity to
 $\pm 10^{-4}$
rad.
Three sets of eight thermistors, one each at the heights
 $z/L=0.25$
, 0.50 and 0.75, were embedded in the sidewall (Brown, Nikolaenko & Ahlers Reference Brown, Nikolaenko and Ahlers2005). Since the LSC carries warm fluid upward at one side of the cell and cold fluid downward at the opposite side, one can detect the azimuthal orientation of the LSC by fitting
 $$\begin{eqnarray}T_{f}=T_{w,k}+{\it\delta}_{k}\cos (i{\rm\pi}/4-{\it\theta}_{k,0})\end{eqnarray}$$
to all eight thermistors at one specific height and time. The integer
 $i$
stands for the azimuthal location of the thermistors and takes values
 $i=0\ldots 7$
, with the location of
 $i=0$
located at a point directly east of the sample centre and
 $i$
increasing in the counterclockwise direction when viewed from above. The index
 $k$
denotes the vertical location of the thermistor and will in the following have letters
 $b$
(
 $z=L/4$
),
 $m$
(
 $z=L/2$
) and
 $t$
(
 $z=3L/4$
). The orientation of the up-flow is given by the term
 ${\it\theta}_{k,0}$
.
From the eight temperatures at a given
 $k$
we computed the coefficients of the lowest four Fourier modes (Stevens, Clercx & Lohse Reference Stevens, Clercx and Lohse2011; Weiss & Ahlers Reference Weiss and Ahlers2011). This yielded all eight Fourier coefficients
 $A_{k,j}$
(the cosine coefficients) and
 $B_{k,j}$
(the sine coefficients),
 $j=1,\ldots ,4$
, and the corresponding ‘energy’
 $E_{k,j}(t)=A_{k,j}^{2}+B_{k,j}^{2}$
. The time averages
 $\langle E_{k,j}(t)\rangle$
were summed to compute the total energy
 $E_{k,tot}$
.
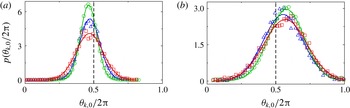
The probability distribution
 $p({\it\theta}_{k,0}/2{\rm\pi})$
of the orientation
 ${\it\theta}_{k,0}/2{\rm\pi}$
for (a)
 $Ra=3.45\times 10^{12}$
and (b)
 $Ra=1.35\times 10^{14}$
, for
 $z/L=0.25$
(red squares),
 $0.50$
(green circles) and
 $0.75$
(blue triangles). The solid lines represent fits of Gaussian functions to the data.

3 Results
3.1 Orientation and energy of the large-scale circulation
Probability distributions
 $p({\it\theta}_{k,0}/2{\rm\pi})$
for the three levels
 $k=b,m,t$
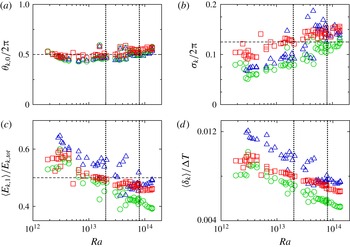
are shown in figure 1 for (a) the classical and (b) the ultimate state. One sees a coherent orientation over the height of the sample. We fitted the function
 $$\begin{eqnarray}\displaystyle p_{f}({\it\theta}_{k})=p_{k,0}\exp [({\it\theta}_{k}-{\it\theta}_{k,0})^{2}/(2{\it\sigma}_{k})^{2}] & & \displaystyle\end{eqnarray}$$
to the data for
 $p({\it\theta}_{k})$
. The results for
 ${\it\theta}_{k,0}$
and
 ${\it\sigma}_{k}$
are shown in figure 2(a,b) as a function of
 $Ra$
. Consistent with the predictions of Brown & Ahlers (Reference Brown and Ahlers2006a
) for the influence of the Earth’s Coriolis force, the orientation
 ${\it\theta}_{k,0}$
of the LSC up-flow is close to west (
 ${\rm\pi}$
) for all
 $Ra$
. The width is slightly larger near the top and bottom of the sample than it is in the middle, but the variation is not large. The relative contribution
 $\langle E_{k,1}\rangle =\langle {\it\delta}_{k}^{2}\rangle$
to the total fluctuation energy in a horizontal plane and near the sidewall (figure 2
c) and the temperature amplitude
 $\langle {\it\delta}_{k}\rangle /{\rm\Delta}T$
(figure 2
d) are also nearly independent of
 $z$
. Although
 $\langle E_{1,k}\rangle /E_{tot,k}\simeq 0.5$
and
 $\langle {\it\delta}_{k}\rangle /{\rm\Delta}T\simeq 0.01$
are smaller than they are for smaller
 $Ra$
and larger
 $Pr$
(see, e.g., Brown & Ahlers (Reference Brown and Ahlers2007b
) and Weiss & Ahlers (Reference Weiss and Ahlers2011) and references therein), the coherence of all measured quantities over all three levels indicates the existence of a statistically well-defined, albeit highly fluctuating, single-roll LSC. All parameters depend only mildly upon
 $Ra$
. There is no strong signature of the ultimate-state transition, but the larger scatter for
 $Ra_{1}^{\ast }\lesssim Ra\lesssim Ra_{2}^{\ast }$
and the much smaller scatter for
 $Ra>Ra_{2}^{\ast }$
are remarkable.
(a) Preferred orientation
 ${\it\theta}_{k,0}/(2{\rm\pi})$
, (b) width
 ${\it\sigma}_{k}/(2{\rm\pi})$
of
 $p({\it\theta}_{k}/2{\rm\pi})$
, (c) LSC fundamental-mode energy
 $\langle E_{k,1}\rangle /E_{k,tot}$
and (d) LSC temperature amplitude
 $\langle {\it\delta}_{k}\rangle /{\rm\Delta}T$
as a function of
 $Ra$
for
 $z/L=0.25$
(red squares),
 $0.50$
(green circles) and
 $0.75$
(blue triangles). The vertical dotted lines indicate
 $Ra_{1}^{\ast }=2\times 10^{13}$
and
 $Ra_{2}^{\ast }=8\times 10^{13}$
from figure 4 below. The horizontal dashed line in (a) indicates
 ${\it\theta}_{k,0}={\rm\pi}$
(west).

3.2 The azimuthal diffusivity of the large-scale-circulation plane
For a diffusive process in a system with a flat (constant) potential the root-mean-square (r.m.s.) azimuthal displacement
 $$\begin{eqnarray}\displaystyle {\rm\Delta}{\it\theta}_{k}\equiv \sqrt{\langle [{\it\theta}_{k,0}(t+n{\it\delta}t)-{\it\theta}_{k,0}(t)]^{2}\rangle }~, & & \displaystyle\end{eqnarray}$$
computed over various time intervals
 $n{\it\delta}t$
, is given by
 $$\begin{eqnarray}\displaystyle {\rm\Delta}{\it\theta}_{k}=\sqrt{D_{{\it\theta}_{k}}(n{\it\delta}t)}. & & \displaystyle\end{eqnarray}$$
Here,
 $D_{{\it\theta}_{k}}$
is the azimuthal diffusivity,
 ${\it\delta}t$
is the time interval between successive data points,
 $n$
is a positive integer and
 $\langle \,\rangle$
indicates a time average.
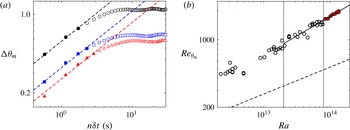
(a) The r.m.s. azimuthal displacement
 ${\rm\Delta}{\it\theta}_{m}$
at
 $z/L=0.50$
as a function of
 $n{\it\delta}t$
on logarithmic scales for
 $z/L=0.5$
and
 $Ra=1.35\times 10^{14}$
(black circles),
 $1.90\times 10^{13}$
(blue squares) and
 $2.24\times 10^{12}$
(red triangles). The dashed lines are fits of the function
 ${\rm\Delta}{\it\theta}_{m}=\sqrt{D_{{\it\theta}_{m}}(n{\it\delta}t)}$
to the solid symbols, adjusting only
 $D_{{\it\theta}_{m}}$
. (b) The Reynolds number
 $Re_{{\it\theta}_{m}}\equiv L\sqrt{D_{{\it\theta}_{m}}/{\it\nu}}$
as a function of
 $Ra$
for
 $z/L=0.50$
. The solid line is a power-law fit (which gave an exponent of 0.40) to the circles with red dots. The dashed line indicates
 $Re_{{\it\theta}_{m}}=0.0211Ra^{0.278}$
from Brown & Ahlers (Reference Brown and Ahlers2006b
) for
 $Pr=4.38$
. The vertical dotted lines represent
 $Ra_{1}^{\ast }=2\times 10^{13}$
and
 $Ra_{2}^{\ast }=8\times 10^{13}$
.

Results for
 ${\rm\Delta}{\it\theta}_{m}$
as a function of
 $n{\it\delta}t$
for
 $z/L=0.50$
are shown in figure 3(a) for three values of
 $Ra$
. One sees that the square-root law holds for small
 $n{\it\delta}t$
, but that at large time intervals
 ${\rm\Delta}{\it\theta}$
becomes constant. This is because the azimuthal potential had a minimum rather than being flat, as can be inferred from the probability distributions
 $p({\it\theta}_{m,0})$
shown in figure 1. In that case diffusion in the potential well was limited to a finite range approximately equal to
 ${\it\sigma}_{m}$
(Brown & Ahlers Reference Brown and Ahlers2006a
) (see figure 2
b). One can still obtain values of
 $D_{{\it\theta}_{m}}$
from a fit of (3.3) to data at small
 $n{\it\delta}t$
such as those shown as solid symbols in figure 3(a). The corresponding results for
 $Re_{{\it\theta}_{m}}$
are shown in figure 3(b).
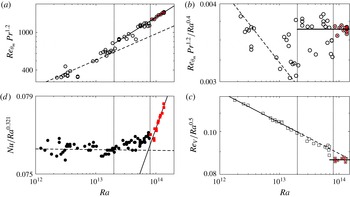
(a) A plot of
 $Re_{{\it\theta}_{m}}Pr^{1.2}$
as a function of
 $Ra$
for
 $z/L=0.50$
and
 $Pr\simeq 0.8$
. The solid line is a power-law fit with an exponent of 0.40 to the circles with red dots. The dashed line represents
 $0.124Ra^{0.278}$
as determined using the data from Brown & Ahlers (Reference Brown and Ahlers2006b
) for
 $Pr=4.38$
. (b) The reduced Reynolds number
 $Re_{{\it\theta}_{m}}Pr^{1.2}/Ra^{0.4}$
as a function of
 $Ra$
for
 $Pr\simeq 0.8$
. The dashed line is an extrapolation of the results for
 $Pr=4.38$
of Brown & Ahlers (Reference Brown and Ahlers2006b
). The horizontal solid bar corresponds to
 $0.00364$
. (c) The reduced velocity-fluctuation Reynolds number
 $Re_{V}/Ra^{0.5}$
as a function of
 $Ra$
from He et al. (Reference He, van Gils, Bodenschatz and Ahlers2015). The solid line is the power-law fit to the data with
 $Ra\leqslant Ra_{1}^{\ast }=2\times 10^{13}$
, which gave an exponent of 0.43. The dashed line is the extrapolation of that fit beyond
 $Ra_{1}^{\ast }$
. The horizontal solid bar corresponds to 0.0863. (d) The reduced Nusselt number
 $Nu/Ra^{0.321}$
as a function of
 $Ra$
on logarithmic scales. The solid line is the power-law fit
 $Nu=0.0159Ra^{0.370}$
to the red squares, and the horizontal dashed line is at
 $Nu/Ra^{0.321}=0.0763$
. In all panels the vertical dotted lines represent
 $Ra_{1}^{\ast }\simeq 2\times 10^{13}$
and
 $Ra_{2}^{\ast }\simeq 8\times 10^{13}$
.

The dashed line in figure 3(b) is an extrapolation of the results obtained by Brown & Ahlers (Reference Brown and Ahlers2006b
) for
 $Ra\lesssim 10^{11}$
and
 $Pr=4.38$
. Although our data are at much larger
 $Ra$
, we note that this extrapolation can be made to pass through our data for classical RBC (
 $Ra\lesssim 2\times 10^{13}$
) when
 $Re_{{\it\theta}_{m}}Pr^{1.2}$
is plotted versus
 $Ra$
, as in figure 4(a). We note that the same dependence on
 $Pr^{1.2}$
was found also for the velocity-fluctuation Reynolds number
 $Re_{V}$
in the range
 $Pr\lesssim 7$
(He et al.
Reference He, van Gils, Bodenschatz and Ahlers2015).
3.3 The
 $Nu$
,
$Re_{V}$
and
$Re_{{\it\theta}}$
, and the ultimate-state transition range from
$Ra_{1}^{\ast }$
to
$Ra_{2}^{\ast }$


In figure 4(a) one sees that there is a change in the
 $Ra$
dependence of
 $Re_{{\it\theta}_{m}}Pr^{1.2}$
near
 $Ra=2\times 10^{13}$
which we identify with the beginning of the transition range to the ultimate state of RBC at
 $Ra_{1}^{\ast }$
(left vertical dotted line). This becomes more obvious when the reduced data for
 $Re_{{\it\theta}_{m}}Pr^{1.2}/Ra^{0.4}$
are plotted, as in figure 4(b). There one also sees that the scatter in the data suddenly decreases as
 $Ra$
exceeds
 $Ra_{2}^{\ast }\simeq 8\times 10^{13}$
, as was the case for
 $Re_{V}$
(see, e.g., He et al.
Reference He, Funfschilling, Nobach, Bodenschatz and Ahlers2012b
), and for
 $\langle E_{k,1}\rangle /E_{k,tot}$
in figure 2(c) shown above. The origin of the scatter in the transition region is unclear. One reason could be that between the classical and ultimate states the system can choose from two or more states with different BL configurations where the BLs are, spatially, neither entirely laminar nor entirely turbulent. Above the transition the fluctuations in the data are small and the state seems to be uniquely defined. Further experiments are needed to better understand the transition region.
For larger
 $Ra$
we find
 $Re_{{\it\theta}_{m}}Pr^{1.2}\propto Ra^{0.40\pm 0.03}$
, as shown by the solid black lines in figure 4(a,b). A theoretical explanation of the
 $Ra$
and
 $Pr$
dependence of
 $Re_{{\it\theta}}$
, in both the classical and the ultimate state, remains a challenge.
In figure 4(c) we show
 $Re_{V}/Ra^{0.50}$
from He et al. (Reference He, van Gils, Bodenschatz and Ahlers2015). These data were taken in a different cell (‘HPCF-IV’). While they did not give an obvious indication of
 $Ra_{1}^{\ast }$
(except for a slight increase of the scatter), they clearly show a discontinuity and a change of the
 $Ra$
dependence at
 $Ra_{2}^{\ast }\simeq 8\times 10^{13}$
. The
 $Ra$
dependence
 $Re_{V}\propto Ra^{0.50\pm 0.02}$
is in excellent agreement with the prediction by Grossmann & Lohse (Reference Grossmann and Lohse2011) for the mean-flow Reynolds number
 $Re_{U}$
in the ultimate state.
Figure 4(d) shows new
 $Nu$
measurements for the same sample as used here (‘HPCF-IVb’) for the diffusivity measurements. One sees that
 $Nu/Ra^{0.321}$
is constant in the classical state, and begins to gently increase for
 $Ra>Ra_{1}^{\ast }$
. For
 $Ra>Ra_{2}^{\ast }$
(red squares) we find
 $Nu\propto Ra^{0.37\pm 0.02}$
, also consistent with the prediction for the ultimate state (Grossmann & Lohse Reference Grossmann and Lohse2011).
The data in figure 4 clearly identify a transition to a new state of the system, with a transition range starting at
 $Ra_{1}^{\ast }\simeq 2\times 10^{13}$
. It is important to decide whether this
 $Ra$
value is consistent with the BL shear instability associated with the ultimate-state transition. Since both the LSC and fluctuations are expected to contribute to the BL instability, we use the measured
 $Re_{eff}\equiv \sqrt{Re_{U}^{2}+Re_{V}^{2}}=1.00\times Ra^{0.436}$
(He et al.
Reference He, van Gils, Bodenschatz and Ahlers2015) for
 ${\it\Gamma}=1.00$
, which, for
 $Ra_{1}^{\ast }\simeq 2\times 10^{13}$
, gives
 $Re_{eff}=6.3\times 10^{5}$
and thus yields the shear Reynolds number (Grossmann & Lohse Reference Grossmann and Lohse2002)
 $Re_{s}^{\ast }\simeq 0.48\sqrt{Re_{eff}}\simeq 380$
. While it is difficult to estimate the overall uncertainty of this value, it is generally consistent with the expected
 $Re_{s}^{\ast }\simeq 400$
(Landau & Lifshitz Reference Landau and Lifshitz1987).
4 Non-Oberbeck–Boussinesq effects and the Skrbek–Urban claim
Real systems will deviate from the OB approximation. Consequently,
 $T_{c}$
may differ from
 $T_{m}$
and various global and local properties may be affected. While in most experiments these effects are small and often negligible, Skrbek & Urban (Reference Skrbek and Urban2015) (SU) claimed that they have a large influence on the Göttingen
 $Nu$
measurements, and that the observation of the ultimate-state transition based on those measurements may be illusory and a misinterpretation of non-OB effects (they make similar claims regarding the Grenoble measurements). In this section we shall show that the arguments of SU are flawed and that there is indeed no evidence that non-OB effects alter the original conclusions regarding the ultimate-state transition as discussed in part in § 3.3.
To lowest order, non-OB effects have no influence on
 $Nu$
when the fluid properties are evaluated at
 $T_{m}$
(Ahlers et al.
Reference Ahlers, Brown, Fontenele Araujo, Funfschilling, Grossmann and Lohse2006). The physics of this is simple. In the classical state one may, to a good approximation, regard
 $Nu$
as proportional to the inverse of the sum of two resistors in series and carrying the same heat current. One (
 $R_{b}$
) corresponds to the bottom and the other (
 $R_{t}$
) to the top BL, and the turbulent bulk between the BLs is taken to be a perfect conductor. While one resistance (that of the thicker BL) is increased slightly by the non-OB conditions, the other is decreased slightly by a nearly equal amount, and their sum, and thus
 $Nu$
, remains nearly the same. This is shown theoretically in § 4 of Ahlers et al. (Reference Ahlers, Brown, Fontenele Araujo, Funfschilling, Grossmann and Lohse2006). It is not only a theoretical result, but was also demonstrated experimentally by the same authors. Although one might think that this argument does not apply to the ultimate state where the turbulent BLs extend deep into the interior (Grossmann & Lohse Reference Grossmann and Lohse2011, Reference Grossmann and Lohse2012), in practice also there one finds most of the temperature drop across thin layers near the plates (Ahlers et al.
Reference Ahlers, Bodenschatz, Funfschilling, Grossmann, He, Lohse, Stevens and Verzicco2012a
), and the ‘two-resistor model’ remains reasonable at least for
 $Ra$
not too much larger than
 $Ra_{2}^{\ast }$
.
For the determination of
 $Nu$
from the Göttingen measurements (Ahlers et al.
Reference Ahlers, He, Funfschilling and Bodenschatz2012b
; He et al.
Reference He, Funfschilling, Bodenschatz and Ahlers2012a
,Reference He, Funfschilling, Nobach, Bodenschatz and Ahlers
b
, Reference He, van Gils, Bodenschatz and Ahlers2015), which revealed the transition to the ultimate state, careful experimental consideration had been given to the need to correct for non-OB effects. Possible differences due to the definition of
 $Ra$
were quite small since
 $T_{c}$
was very close to
 $T_{m}$
(He et al. (Reference He, Funfschilling, Bodenschatz and Ahlers2012a
) figure 1(b); see also He et al. (Reference He, Funfschilling, Nobach, Bodenschatz and Ahlers2013)), with
 $(T_{c}-T_{m})/T_{m}\lesssim 0.002$
(temperatures are in Kelvin). With such a small change of the absolute temperature the properties of a gas do not vary significantly, and it does not matter, for instance, whether
 $Ra$
is evaluated using the properties at
 $T_{m}$
, as is customary and preferred theoretically, or at
 $T_{c}$
, as suggested by SU. Further, it had been shown experimentally that non-OB effects did not influence the measurements significantly by comparing data at the same
 $Ra$
taken with relatively large
 ${\rm\Delta}T$
where non-OB effects are larger (by using relatively low pressures) with others taken with smaller
 ${\rm\Delta}T$
where non-OB effects are smaller (measured at larger pressures) (figure B.1b of Ahlers et al. (Reference Ahlers, He, Funfschilling and Bodenschatz2012b
)).
Contrary to the above, SU claim that non-OB effects have a large influence on the Göttingen
 $Nu$
data. They state that
the claims of observing transition to the ultimate state of Rayleigh–Bénard convection could indeed be related to non-Oberbeck–Boussinesq effects.
They then propose a different method of analysis (the ‘SU model’), which, they argue, corrects for these large non-OB effects. Below we show that the arguments of SU have two flaws.
The first flaw is that they arbitrarily decided that it would be better to evaluate the fluid properties at
 $T_{c}$
(either experimentally measured or derived from a crude model) rather than at
 $T_{m}$
. It has been known since the trailblazing work of Busse (Reference Busse1967) (see also Ahlers et al.
Reference Ahlers, Dressel, Oh and Pesch2009a
) for convection near onset, which was extended to the turbulent state by Ahlers et al. (Reference Ahlers, Brown, Fontenele Araujo, Funfschilling, Grossmann and Lohse2006), that this is inappropriate. A more systematic approach is to retain
 $T_{m}$
as the only a priori known reference temperature, and to treat non-OB effects with this choice as perturbations of the OB state. This systematic procedure will then yield a value of
 $T_{c}-T_{m}$
a posteriori. However, as indicated above and shown also by He et al. (Reference He, Funfschilling, Nobach, Bodenschatz and Ahlers2013), choosing
 $T_{c}$
instead has in practice virtually no consequences for the Göttingen
 $Nu$
and
 $Ra$
values because
 $|(T_{c}-T_{m})|/T_{m}$
was small. Nonetheless, there is no foundation for SU’s choice of
 $T_{c}$
rather than
 $T_{m}$
, and it goes contrary to a large body of well-established literature.
The second flaw has a greater impact on the
 $Nu$
and
 $Ra$
values. Skrbek and Urban claim that in the Göttingen experiments
 $T_{t}$
values are dangerously close to the SVP line (representing the equilibrium first-order liquid–gas phase transition where due to fluctuations condensation/evaporation could take place).
Let us restate the nature of first-order phase transitions. There is no anomalous increase of fluctuation intensities, and all properties vary only slowly with temperature until the very point where the transition temperature is crossed and latent-heat contributions to
 $Nu$
occur. Thus, the claim by SU is unfounded. Skrbek and Urban then move on to claim
We can further strengthen our argument by pointing out the work of Zhong, Funfschilling & Ahlers (Reference Zhong, Funfschilling and Ahlers2009), showing that the heat transfer efficiency would be considerably enhanced if condensation/evaporation processes were to take place in the vicinity of the SVP line at the top plate of the SF6 cell.
This is a misinterpretation of the cited paper. Zhong et al. (Reference Zhong, Funfschilling and Ahlers2009) showed that, with decreasing mean temperature, there is no excess contribution to the heat transport until the very point at which the top temperature
 $T_{t}$
crosses the vapour-pressure curve at
 $T_{{\it\phi}}(P)$
. When
 $T_{{\it\phi}}$
is crossed by
 $T_{t}$
(which never happened in the Göttingen measurements), a continuous but sharp transition takes place to a state where the heat transport increases linearly with
 $T_{{\it\phi}}-T_{t}$
.
Skrbek and Urban then continue to state
Upon increasing
 $Ra$
, the top half of the cell becomes affected by the non-Oberbeck–Boussinesq effects, while the bottom half, if lying sufficiently far away from the SVP curve, does not.
Needless to say, this is incorrect. All physical systems are influenced by non-OB effects; the question is only whether these effects influence a given measured quantity significantly. While the non-OB effect is indeed stronger at the top of the cell, it does not vanish in the bottom, and for the Göttingen data (by any reasonable measure) is smaller by less than a factor of two or so.
Skrbek and Urban then argue that
one can avoid the non-Oberbeck–Boussinesq effects in the top half of the cell, by replacing it with the inverted (with respect to
 $T_{c}$
) nearly Oberbeck–Boussinesq bottom half.
This argument is at odds with the beautiful cancellation between the increase of
 $R_{b}$
and decrease of
 $R_{t}$
characteristic of non-OB systems as discussed above, and creates a qualitatively new fictitious system in which
 $Nu$
is proportional to
 $1/(2R_{b})$
rather than to
 $1/(R_{b}+R_{t})$
as is the case in the physical system! To make things worse, they then replace
 ${\rm\Delta}T\equiv T_{b}-T_{t}$
by
 ${\rm\Delta}T_{eff}=2(T_{b}-T_{c})$
. This SU model yields values of
 $Nu$
and
 $Ra$
that are unrelated to reality.
It is amusing (but unrelated to the present discussion) that a non-OB system with BLs that have properties that are reflection symmetric about the horizontal mid plane of the sample does indeed exist. It occurs above the critical pressure of a fluid when, at constant pressure, the top and bottom temperatures are on opposite sides of and approximately equidistant from the temperature on the critical isochore (Ahlers et al. Reference Ahlers, Calzavarini, Fontenele Araujo, Funfschilling, Grossmann, Lohse and Sugiyama2008, Reference Ahlers, Dressel, Oh and Pesch2009a ; Burnishev, Segre & Steinberg Reference Burnishev, Segre and Steinberg2010; Burnishev & Steinberg Reference Burnishev and Steinberg2012).
Beyond their claims for the influence of non-OB effects on
 $Nu$
, SU also state that
It is important to emphasize that not only the Nusselt number scaling, but the scaling of any other independently measured quantity, such as the Reynolds number
 $Re=Re(Ra)$
, that might have displayed ‘phase transitions’ spuriously interpreted as independent confirmation of the transition to the ultimate regime, will change, as well.
We do not agree with this statement. The
 $Nu$
is determined largely by the boundary layers with their steep thermal gradients, while recent
 $Re_{V}$
measurements (He et al.
Reference He, van Gils, Bodenschatz and Ahlers2015), as well as the diffusivity measurements presented here, are properties of the bulk which depend only on the local temperature which is nearly uniform and close to
 $T_{c}$
(and
 $T_{c}$
in turn is nearly equal to
 $T_{m}$
). In the SU model the major influence on
 $Re(Ra)$
arises from using
 ${\rm\Delta}T_{eff}$
rather than
 ${\rm\Delta}T$
to calculate
 $Ra$
, and, as just stated, this use leads to an unphysical model for RBC.
From the above discussion one can see that the data manipulation of SU leads to a fictitious system which is unrelated to those investigated in Grenoble and Göttingen. Thus, we see no validity in questioning the claim, based on the Göttingen data, that a transition to a new state of RBC has been observed and that this state has been at least partially characterized.
5 Summary and conclusions
In this paper we presented new measurements of the temperature amplitude and of the azimuthal diffusivity of the large-scale circulation for a cylindrical sample with
 ${\it\Gamma}=1.00$
which show the ultimate-state transition range from
 $Ra_{1}^{\ast }\simeq 2\times 10^{13}$
to
 $Ra_{2}^{\ast }\simeq 8\times 10^{13}$
, in agreement with findings based on measurements of
 $Nu$
and of the velocity-fluctuation Reynolds number
 $Re_{V}$
.
We also showed that the claim by Skrbek & Urban (Reference Skrbek and Urban2015) that ‘observing transition to the ultimate state could indeed be related to non-Oberbeck–Boussinesq effects’ is without any foundation.
Finally, we note that turbulent circular Couette flow (CCF) was shown to have equations of motion equivalent to those of turbulent RBC (Eckhardt, Grossmann & Lohse Reference Eckhardt, Grossmann and Lohse2007). Experiments for this system yielded a ‘Nusselt number’
 $Nu_{{\it\omega}}\propto Ta^{0.38}$
which characterizes the angular velocity transport (van Gils et al.
Reference van Gils, Huisman, Briggert, Sun and Lohse2011). Here, the Taylor number
 $Ta$
plays a role equivalent to
 $Ra$
in RBC. A so-called ‘wind Reynolds number’, analogous to the Reynolds number in RBC, was found to be proportional to
 $Ta^{0.50}$
(Huisman et al.
Reference Huisman, van Gils, Grossmann, Sun and Lohse2012). Both of these results agree with the analogous ultimate-state results for RBC shown in figure 4(c,d). Thus, there is strong evidence that both RBC and CCF, at high enough driving, enter equivalent states which have properties expected of an ultimate state with turbulent boundary layers (Grossmann & Lohse Reference Grossmann and Lohse2011). Further, it is worth noting that for both systems the ultimate state is entered at approximately the same value, close to 400, of the boundary-layer shear Reynolds number (for RBC see § 3.3 in the present paper and He et al. (Reference He, Funfschilling, Nobach, Bodenschatz and Ahlers2012b
); for CCF see § 5 and figure 14(b) of Ostilla et al. (Reference Ostilla, Stevens, Grossmann, Verzicco and Lohse2013), as well as van Gils et al. (Reference van Gils, Huisman, Grossmann, Sun and Lohse2012), Ostilla-Monico et al. (Reference Ostilla-Monico, van der Poel, Verzicco, Grossmann and Lohse2014) and Grossmann, Lohse & Sun (Reference Grossmann, Lohse and Sun2016)), where the transition to a turbulent BL is expected (Landau & Lifshitz Reference Landau and Lifshitz1987).
Acknowledgements
We are grateful to the Max Planck Society and the Volkswagen Stiftung, whose support made the establishment of the Uboot facility and the experiments possible. We thank the Deutsche Forschungsgemeinschaft (DFG) for financial support through SFB963: ‘Astrophysical Flow Instabilities and Turbulence’. X.H. acknowledges support through the Chinese Thousand Young Talents Program. The work of G.A. was supported in part by the US National Science Foundation through grant DMR11-58514.