Introduction
Arsenoveszelyite (IMA2021-076a, Shen et al., Reference Shen, Hao, Sun, Li, Xue and Luo2022) is a new mineral approved by the Commission on New Minerals, Nomenclature and Classification of the International Mineralogical Association (IMA CNMNC), with the symbol ‘Avsz’. It is the arsenic analogue of veszelyite. Its name is derived from the prefix ‘arseno’ (referring to arsenic) and the root ‘veszelyite’. The holotype specimen of arsenoveszelyite is located in the Geological Museum of China (Xisi Yangrou Hutong No. 15, Xicheng District, Beijing, P.R. China) and catalogued as M16126. Co-type specimens are deposited in the Crystal Structure Laboratory, China University of Geosciences (Beijing), Beijing 100083, P.R. China, under catalogue number DC-3.
Veszelyite was first described in Romania and named after A. Veszeli, a Hungarian mining engineer who discovered the species (Schrauf, Reference Schrauf1874; Danisi et al., Reference Danisi, Armbruster, Lazić, Vulić, Kaindl, Dimitrijević and Kahlenberg2013). The human use of veszelyite predates its scientific documentation. Due to its vivid blue-green colour, veszelyite had been used as a pigment by the Maya civilization long before its formal identification (Moreno et al., Reference Moreno, Mathis, Mazel, Dubus, Calligaro and Strivay2008a; Reference Moreno, Strivay and Gilbert2008b). Veszelyite is a relatively rare supergene mineral, typically found in the oxidized zones of copper deposits. Notable localities include the Ocna de Fier Fe-Cu skarn deposit in Romania (https://www.mindat.org/; Ciobanu and Cook, Reference Ciobanu and Cook2004), the sediment-hosted Kipushi deposit in the Democratic Republic of Congo (Lhoest, Reference Lhoest1995), the Black Pine Mine and Gold Hill mining district in the USA (Waisman, Reference Waisman1992; El-Shatoury and Whelan, Reference El-Shatoury and Whelan1970), as well as the Hisaichi and Kamioka mines in Japan (Sadanaga and Bunno, Reference Sadanaga and Bunno1974; Sakurai et al., Reference Sakurai, Nagashima and Sorita1952). Despite its occurrence in multiple localities, studies on the compositional variation within the veszelyite–arsenoveszelyite series remain poorly documented (Harada, Reference Harada1954). The crystal structure of veszelyite was first solved by Ghose et al. (Reference Ghose, Leo and Wan1974). A more detailed structural study (Danisi et al., Reference Danisi, Armbruster, Lazić, Vulić, Kaindl, Dimitrijević and Kahlenberg2013) further refined the structure of veszelyite, determining the positions of hydrogen atoms and investigating its dehydration behaviour. The presence of PO4 tetrahedra in the crystal structure suggested the possibility of an arsenic-dominant end-member, though no natural occurrence had been confirmed until the discovery of arsenoveszelyite in Dongchuan. Earlier wet-chemical analyses have reported arsenic contents reaching 10.43 wt.% (Zsivny Reference Zsivny1932), but this is still far from the levels necessary for arsenic to dominate the crystal structure.
The Dongchuan copper ore field hosts a distinctive assemblage of primary and supergene minerals. Arsenic is a key component, particularly enriched in primary tennantite-group minerals. In addition, three other new supergene arsenate minerals, tangdanite (Ma et al., Reference Ma, Li, Chukanov, Poirier and Shi2014), zheshengite (Sun et al., Reference Sun, Li, Xue, Shen and Hao2024a), and cuprozheshengite (Sun et al., Reference Sun, Grey, Li, Rewitzer, Xue, Mumme, Shen, Hao, MacRae, Riboldi-Tunnicliffe, Boer, Williams and Kampf2024b), have been discovered in this area. Arsenic, being an environmentally hazardous element, undergoes complex mineralogical and geochemical processes that affect its mobility (Bowell et al., Reference Bowell, Alpers, Jamieson, Nordstrom, Majzlan, Bowell, Alpers, Jamieson, Nordstrom and Majzlan2014). The Dongchuan ore field is one of China’s most significant copper deposits. It has played a major role in copper production and coin minting from the Tang Dynasty (618 to 907 CE), with its importance peaking during the Qing Dynasty (1644 to 1911 CE) (Cao, Reference Cao2012; Kim and Yang, Reference Kim and Yang2018). The region’s long mining history has increased the risk of arsenic pollution through exposure of arsenic-bearing ores. Therefore, investigating arsenic minerals from this area helps clarify how arsenic is incorporated into crystal structures. The discovery of arsenoveszelyite offers valuable structural information on cation and layer stacking in the arsenate analogue of veszelyite.
Occurrence and general appearance
Arsenoveszelyite was discovered from an abandoned mine ∼1.7 kilometres northwest of Sanguozhuang Village, Tangdan Town, Dongchuan District, Kunming City, Yunnan Province, China (26°7’36’’N, 103°0’19’’E). This mine is a sediment-hosted Zn–Pb–Cu deposit, with the host rocks primarily consisting of dolomite interbedded with minor quartz sandstone. The ore veins are quartz-rich, filling sedimentary structural fractures. The primary ore minerals include sphalerite, galena, tetrahedrite-group minerals, and minor pyrite. Many of the ore veins are intensely weathered, providing favourable conditions for the formation of secondary minerals. The secondary mineral assemblage includes azurite, cerussite, mimetite, theisite, veszelyite, hemimorphite, kipushite, bayldonite, arsendescloizite, duftite, dongchuanite-group minerals, and a significant amount of amorphous phases.
Arsenoveszelyite was found in the intensely weathered ore. However, arsenoveszelyite is rare even at its type locality. Most specimens from this locality contain the phosphate end-member veszelyite instead. In the surrounding dolomite host rock, apatite grains of ∼10 μm in size are commonly observed, which may be related to the depositional environment. Despite the phosphorus-rich conditions that typically favour the formation of veszelyite, the occurrence of arsenoveszelyite may be attributed to localized arsenic-rich microenvironments formed through the weathering of tetrahedrite-group minerals, like tennantite-(Zn).
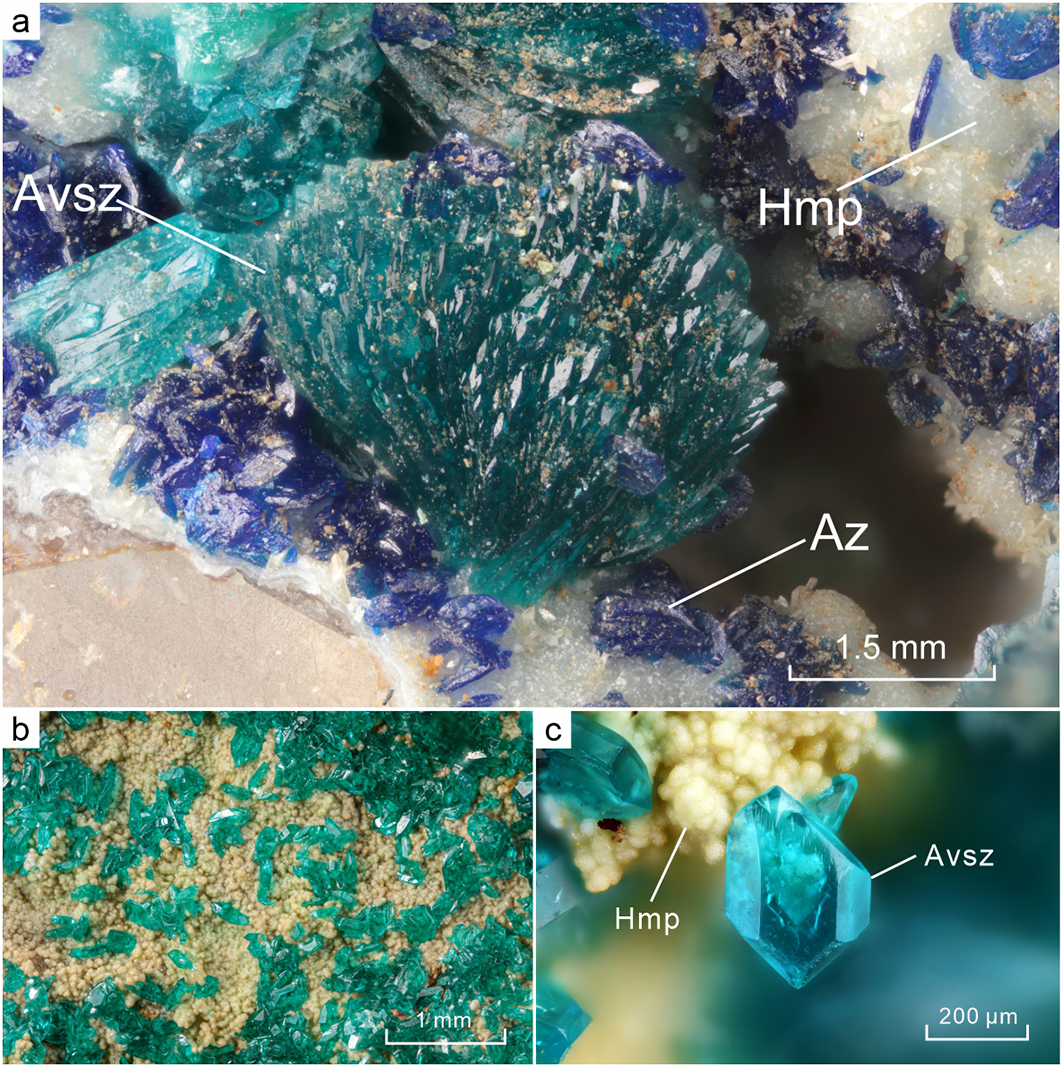
Arsenoveszelyite occurs as radiating aggregates (Fig. 1a) or as individual lamellar crystals (Fig. 1b, c) (a: b: c = 0.7302: 1: 0.9503), with the commonly observed forms including {100}, {110}, and {011}, and no twinning observed. Crystals display a cyan to emerald green colour with a light green streak, are transparent, and have a vitreous lustre. The minerals closely associated with arsenoveszelyite are azurite and hemimorphite (Fig. 1).
(a) Radiating aggregate of arsenoveszelyite (Avsz) associated with azurite (Az) and hemimorphite (Hmp); (b) many single crystals of arsenoveszelyite; (c) close-up view of the arsenoveszelyite single crystal. All specimens are preserved as cotype samples in the Crystal Structure Laboratory, China University of Geosciences (Beijing), Beijing 100083, P.R. China, under catalogue number DC-3.

Physical and optical properties
The Mohs hardness of arsenoveszelyite ranges from 3 to 4, while micro-indentation hardness measurements (VHN, 10 g load) yield a mean value of 265.0 kg/mm2, with a range of 253.8–276.5 kg/mm2. Cleavage is good on {001} and {110} while parting is not observed. The mineral is brittle, with an irregular fracture. The calculated density, based on the empirical formula and unit-cell volume refined from single-crystal XRD data, is 3.61 g/cm3. Arsenoveszelyite is non-magnetic.
Optically, arsenoveszelyite is a biaxial (+) mineral. The measured refractive indices are n α = 1.655(10), n β = 1.665(5) and n γ = 1.690(10). The optical orientation is defined as Y = b. The measured 2V angle is 40°. The mineral exhibits weak pleochroism, with X = cyan, Y = cyan and Z = indigo. The measured and calculated optical data show excellent agreement, with 1–(K P/K C) = 0.031.
Analytical methods
Chemical composition analysis
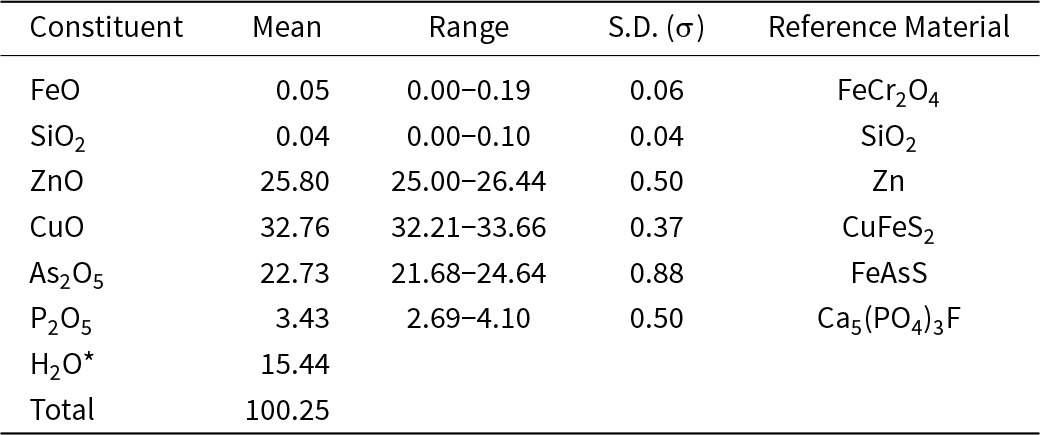
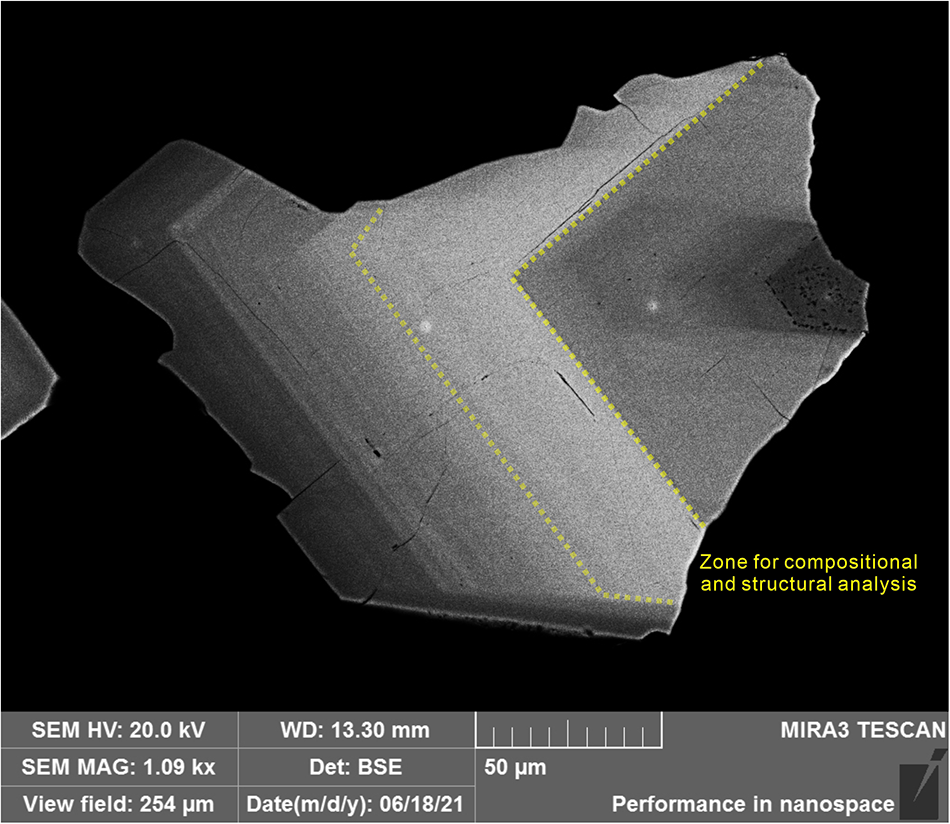
Electron microprobe analysis (EPMA) was performed using a JEOL EPMA-JXA8230 equipped with wavelength-dispersive spectroscopy (WDS). The operating conditions included an acceleration voltage of 15 kV, a beam current of 3 nA, and a beam diameter of 10 μm. The use of low current and a broad beam spot during analysis can effectively prevent dehydration of the mineral. Each element was measured using the peak height method, with a peak counting time of 20 s and a background duration of 10 s. Standard materials are listed in Table 1. The final results were corrected using the ZAF method. A total of 25 points were analysed using EPMA on different zones of the crystal grain, with detailed locations and results provided in the Supplementary Material. For the definition of the composition and structure of arsenoveszelyite, 10 analyses were selected on the zone richest in As, corresponding to the region subjected to structural analysis (Fig. 2).
Chemical data (in wt.%) for arsenoveszelyite

Table 1 Long description
Weight percent composition statistics for arsenoveszelyite list mean values with ranges, standard deviations, and reference materials for most oxides. CuO is highest at a mean of 32.76 wt.% with a range from 32.21 to 33.66 and standard deviation 0.37, referenced to CuFeS2. ZnO averages 25.80 wt.% with a range from 25.00 to 26.44 and standard deviation 0.50, referenced to Zn. As2O5 averages 22.73 wt.% with a range from 21.68 to 24.64 and standard deviation 0.88, referenced to FeAsS. H2O is reported at 15.44 wt.% but no range or standard deviation is provided. P2O5 averages 3.43 wt.% with a range from 2.69 to 4.10 and standard deviation 0.50, referenced to Ca5(PO4)3F. Minor constituents are FeO at 0.05 wt.% and SiO2 at 0.04 wt.% with small ranges and standard deviations, referenced to FeCr2O4 and SiO2 respectively. The total is 100.25 wt.%, slightly above 100, which may reflect analytical uncertainty and rounding.
Notes: S.D. = standard deviation.
A polished sample from a single crystal taken from the field of view shown in Fig. 1b. The sample exhibits well-developed compositional zoning. The entire grain is not composed of arsenoveszelyite; the darkest regions correspond to veszelyite. A total of 25 points were analysed by EPMA, with detailed locations and compositions provided in the Supplementary Material. The zone shown in this figure corresponds to the region used in the main text to define compositional and structural characteristics; the average composition of 10 points within this zone represents the composition of the band. This sample is collected in the Geological Museum of China, catalogued as M16126.

Raman spectrum analysis
Raman spectra were collected using a Horiba in Via-Reflex spectrometer in reflection mode, with a 532 nm laser excitation wavelength and a 600 gr/mm grating. A spectrum in the 200–4000 cm–1 region was obtained by using a collection time of 20 s and 2 scans with a resolution of 4 cm–1.
Crystal structure analysis
Powder X-ray diffraction data were collected using a Rigaku XtaLAB PRO-007HF diffractometer with the rotating crystal method. The instrument was equipped with a microfocus rotating anode MoKα source operating at 50 kV and 24 mA and a hybrid pixel array detector. Unit cell parameters were indexed and refined using the Chekcell software (Laugier and Bochu, Reference Laugier and Bochu2000), and the calculated diffraction data were generated using the VESTA software (Momma and Izumi, Reference Momma and Izumi2011).
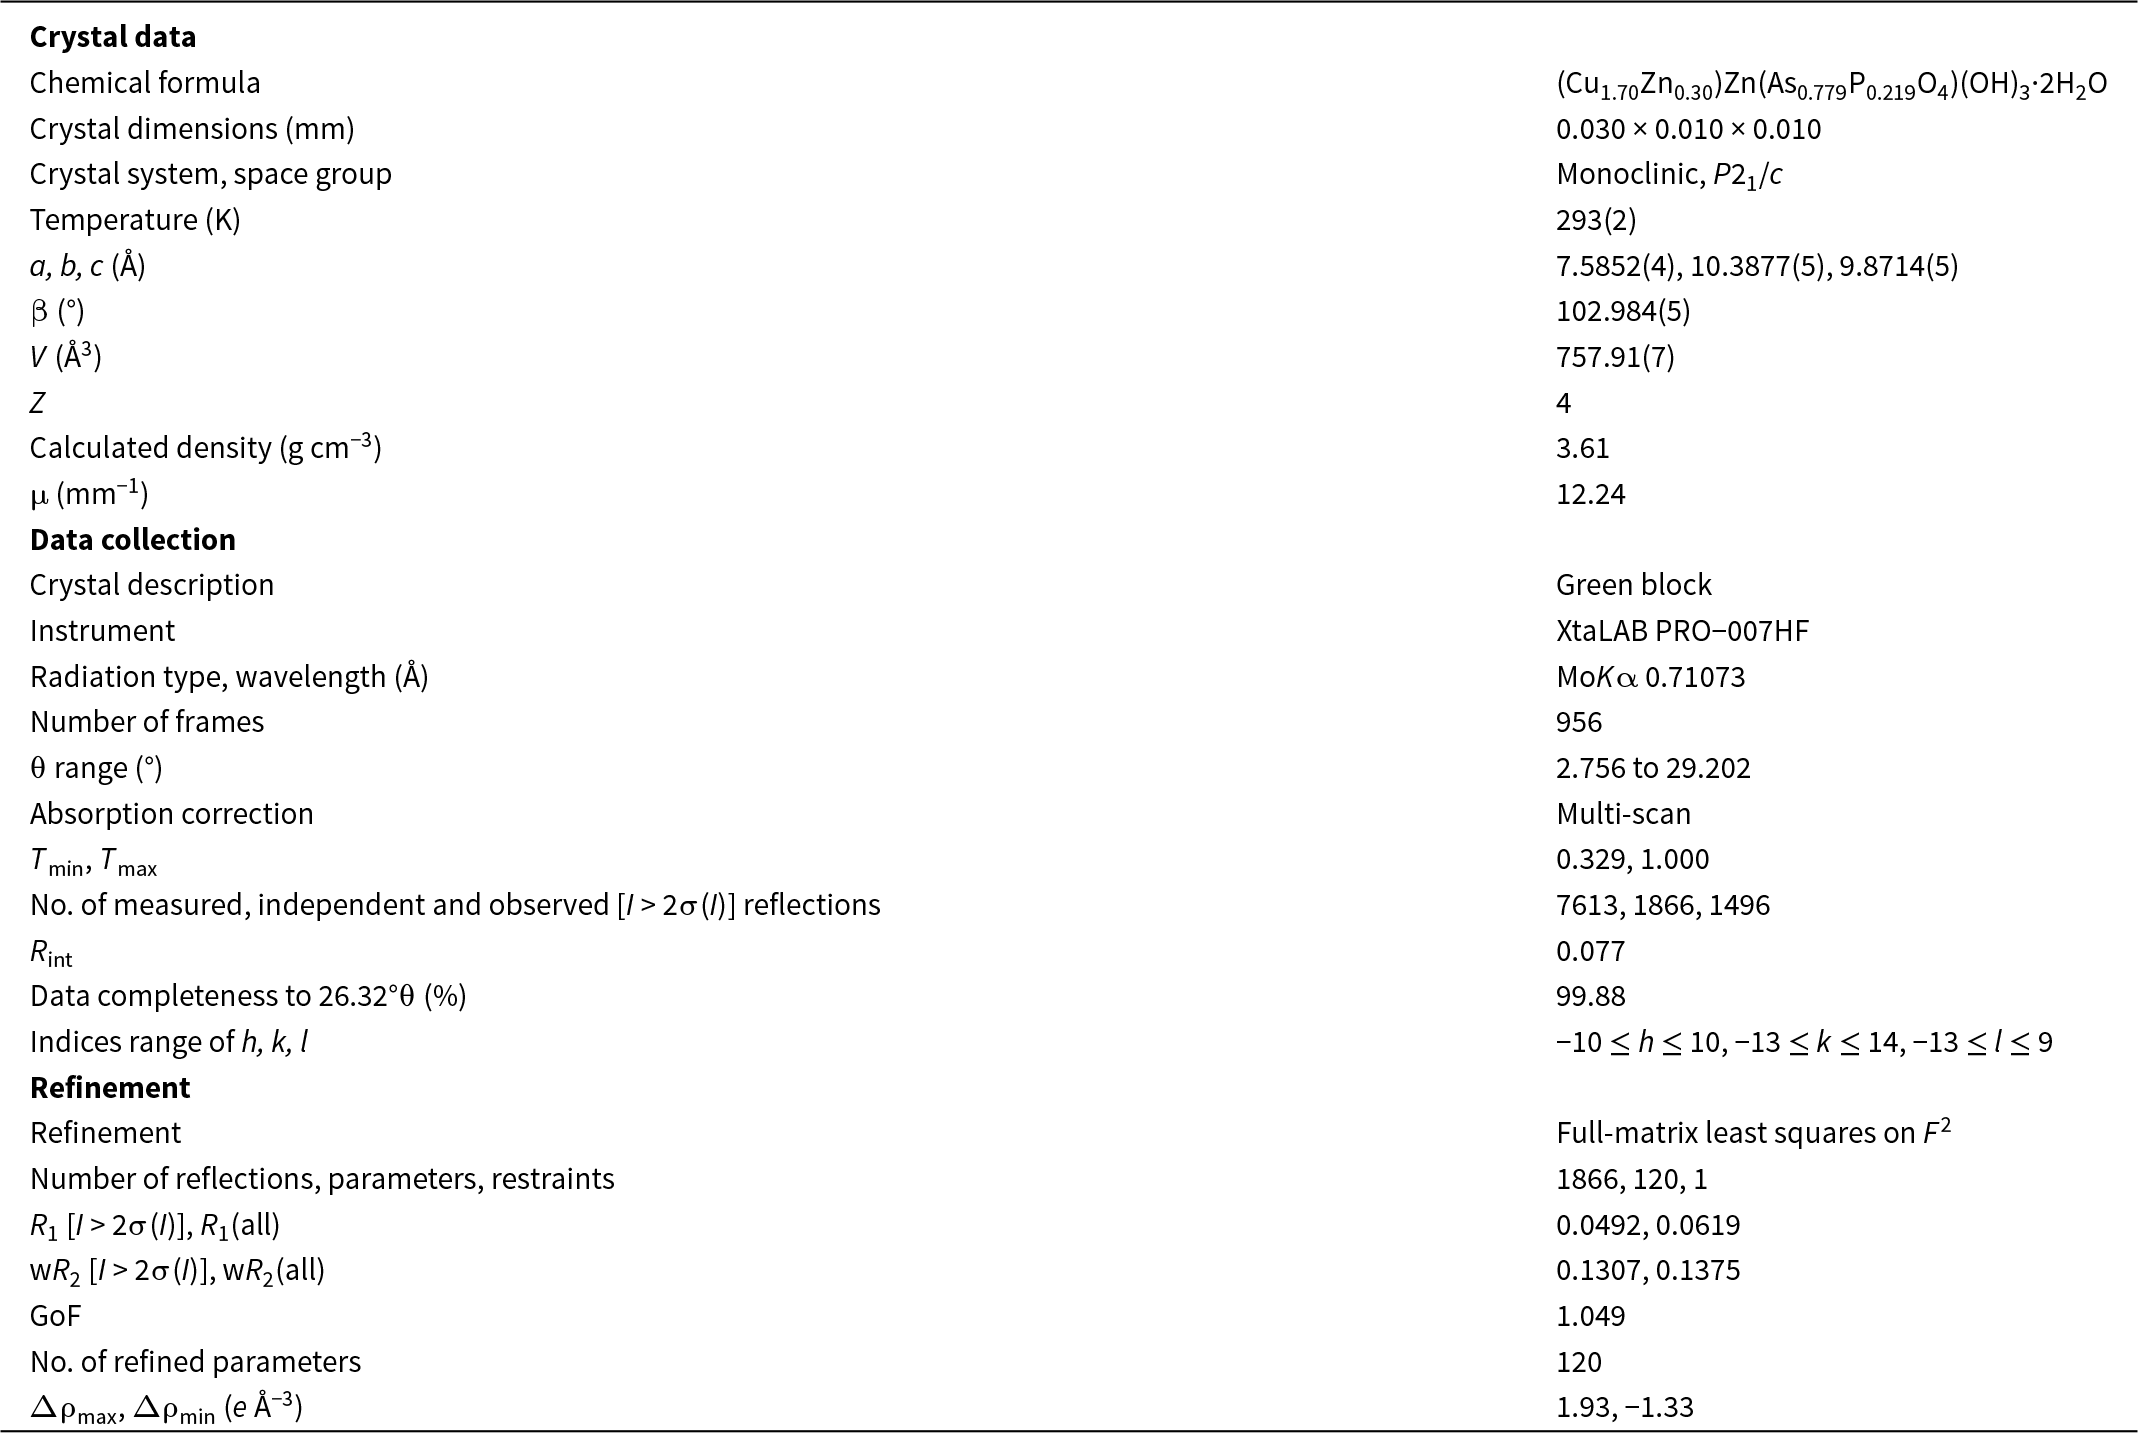
Single-crystal X-ray studies were carried out with the same Rigaku Oxford diffraction XtaLAB PRO-007HF diffractometer. A high-quality single-crystal fragment (0.030 × 0.010 × 0.010 mm in size) was extracted from the designated zone for structural analysis. A hemisphere of intensity data was collected for the fragment of –10 < h < 10, –13 < k < 14, –13 < l < 9 with fair R int = 0.0769. The intensity data were processed using PL and multi-scan absorption corrections. The space group was obtained by the systematic extinction statistics and found to be P21/c. Crystal structure determination and refinement were conducted using OLEX2-1.3 (Dolomanov et al., Reference Dolomanov, Bourhis, Gildea, Howard and Puschmann2009). The structure model was solved with SHELXT using the intrinsic phasing method and refined using SHELXL (Sheldrick, Reference Sheldrick2008, Reference Sheldrick2015). The structure was refined to R = 0.0492 on the basis of 1866 independent reflections with I > 2σ(I). Complete crystallographic data are provided in the CIF in the Supplementary Material.
Results and discussions
Raman spectroscopy
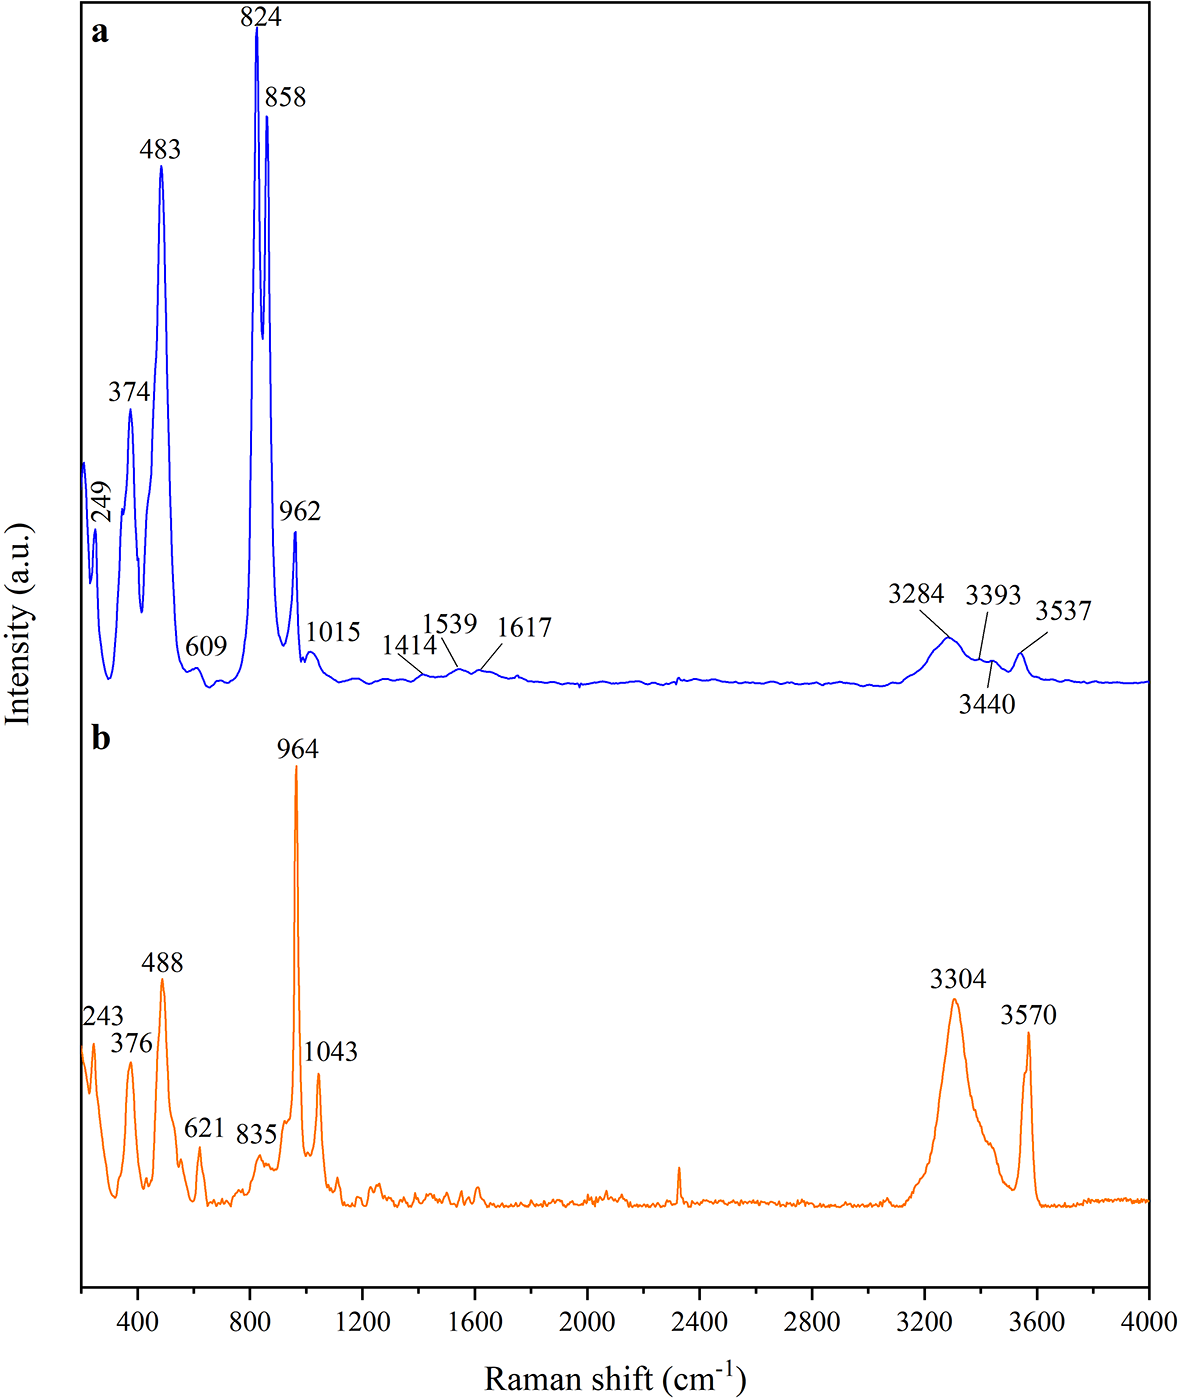
The Raman spectra of arsenoveszelyite and contrasting veszelyite are shown in Fig. 3. For arsenoveszelyite, peaks in the range from 400 to 200 cm−1 corresponding to the lattice mode is reflected at 249 and 374 cm−1.
Raman spectrum of arsenoveszelyite (a) (this study) and veszelyite (b) (RRUFF ID: 070312).

Figure 3 Long description
Two stacked line plots labeled a and b. Spectrum a: The y-axis label is Intensity (a.u). The x-axis label is Raman shift (cm superscript minus 1), ranging from 400 to 4000 with labeled ticks at 400, 800, 1200, 1600, 2000, 2400, 2800, 3200, 3600 and 4000. The trace has multiple sharp peaks between 400 and about 1100, smaller peaks between about 1400 and 1700 and several peaks between about 3200 and 3600. Labeled peak positions are 249 374, 483, 609, 824, 858, 962, 1015, 1414, 1539, 1617, 3284, 3393, 3440 and 3537. Spectrum b: The y-axis label is Intensity (a.u). The x-axis label is Raman shift (cm superscript minus 1), ranging from 400 to 4000 with labeled ticks at 400, 800, 1200, 1600, 2000, 2400, 2800, 3200, 3600 and 4000. The trace has several sharp peaks between about 200 and 1100 and two prominent peaks between about 3200 and 3600. Labeled peak positions are 243, 376, 488, 621, 835, 964, 1043, 3304 and 3570.
Peaks in the range of 1100–400 cm−1 are ascribed to the mode vibrations of (AsO4)3− and (PO4)3− (Farmer, Reference Farmer1974). Two weak peaks related to (PO4)3− are confirmed to be υ 3 (1015 cm−1) and υ 1 (962 cm−1) modes, respectively (Danisi et al., Reference Danisi, Armbruster, Lazić, Vulić, Kaindl, Dimitrijević and Kahlenberg2013). Splitting peaks at 858 cm−1 and 824 cm−1 are assigned to the υ 3 mode of (AsO4)3−, which is attributed to the changes of the As–O bond length ranging from 1.643 to 1.674 Å. The weak peak at 609 cm−1 is ascribed to the υ 2 (PO4)3− vibration. Peaks at 483 cm−1 may correspond to the v 4 and v 2 vibrations of either (PO4)3− or (AsO4)3− groups (Frost et al., Reference Frost, Martens and Williams2002; Ciesielczuk et al., Reference Ciesielczuk, Janeczek, Dulski and Krzykawski2016; Ismagilova et al., Reference Ismagilova, Rieck, Kampf, Giester, Zhitova, Lengauer, Krivovichev, Zolotarev, Ciesielczuk, Mikhailova, Belakovsky, Bocharov, Shilovskikh, Vlasenko, Nash and Adams2022).
The Raman spectrum of arsenoveszelyite indicates the existence of both OH− and molecular H2O. Four wide bands centred at 3537, 3440, 3393 and 3284 cm−1 are attributed to O–H stretching vibrations. The characteristic bands of the H2O vibration are weak and centred at 1617, 1539 and 1414 cm−1 (Danisi et al., Reference Danisi, Armbruster, Lazić, Vulić, Kaindl, Dimitrijević and Kahlenberg2013).
Raman spectroscopy provides an effective means of distinguishing between these two minerals. In arsenoveszelyite, the υ 3 stretching modes of the AsO4 group appear as intense bands at 824 and 858 cm–1. In contrast, veszelyite displays a strong v 1 stretching band of the PO4 group at 964 cm–1 (Fig. 3).
Chemical composition
Back-scattered electron (BSE) imaging reveals distinct chemical zoning in arsenoveszelyite, mainly due to variations in As and P contents (Fig. 2). The type specimen shows lower contrast and higher P in the core and rim, while brighter zones are As-rich. The composition of arsenoveszelyite was defined based on the highest-contrast, As-rich area, which was also used for structural analysis. The chemical data for arsenoveszelyite are presented in Table 1. The total H2O content was not measured directly but was calculated based on stoichiometry and charge balance, yielding 3.03 per formula unit (pfu) of OH– and 2 pfu of H2O.
The empirical formula of arsenoveszelyite, calculated on the basis of Cu + Zn + As + Fe + Si + P = 4, apfu is (Cu1.69Zn0.30)Σ1.99Zn[(As0.81P0.20)Σ1.01O4](OH)3.03·2H2O. The simplified formula is (Cu,Zn)2Zn[(As,P)O4](OH)3·2H2O and the ideal formula is Cu2Zn(AsO4)(OH)3·2H2O, which requires CuO 38.02, ZnO 19.45, As2O5 27.47, H2O 15.06, total 100 wt.%.
The suggested Dana classification of arsenoveszelyite is 42.2 (42: Hydrated phosphates, etc., containing hydroxyl or halogen; 2: (AB)3(XO4)Z q·xH2O). The Strunz classification should be 8.DE (8: Phosphates, arsenates, vanadates; D: Phosphates, etc., with additional anions, with H2O; E: With only medium-sized cations, (OH, etc.): RO4 = 3: 1).
Crystal structure and crystal chemistry of arsenoveszelyite
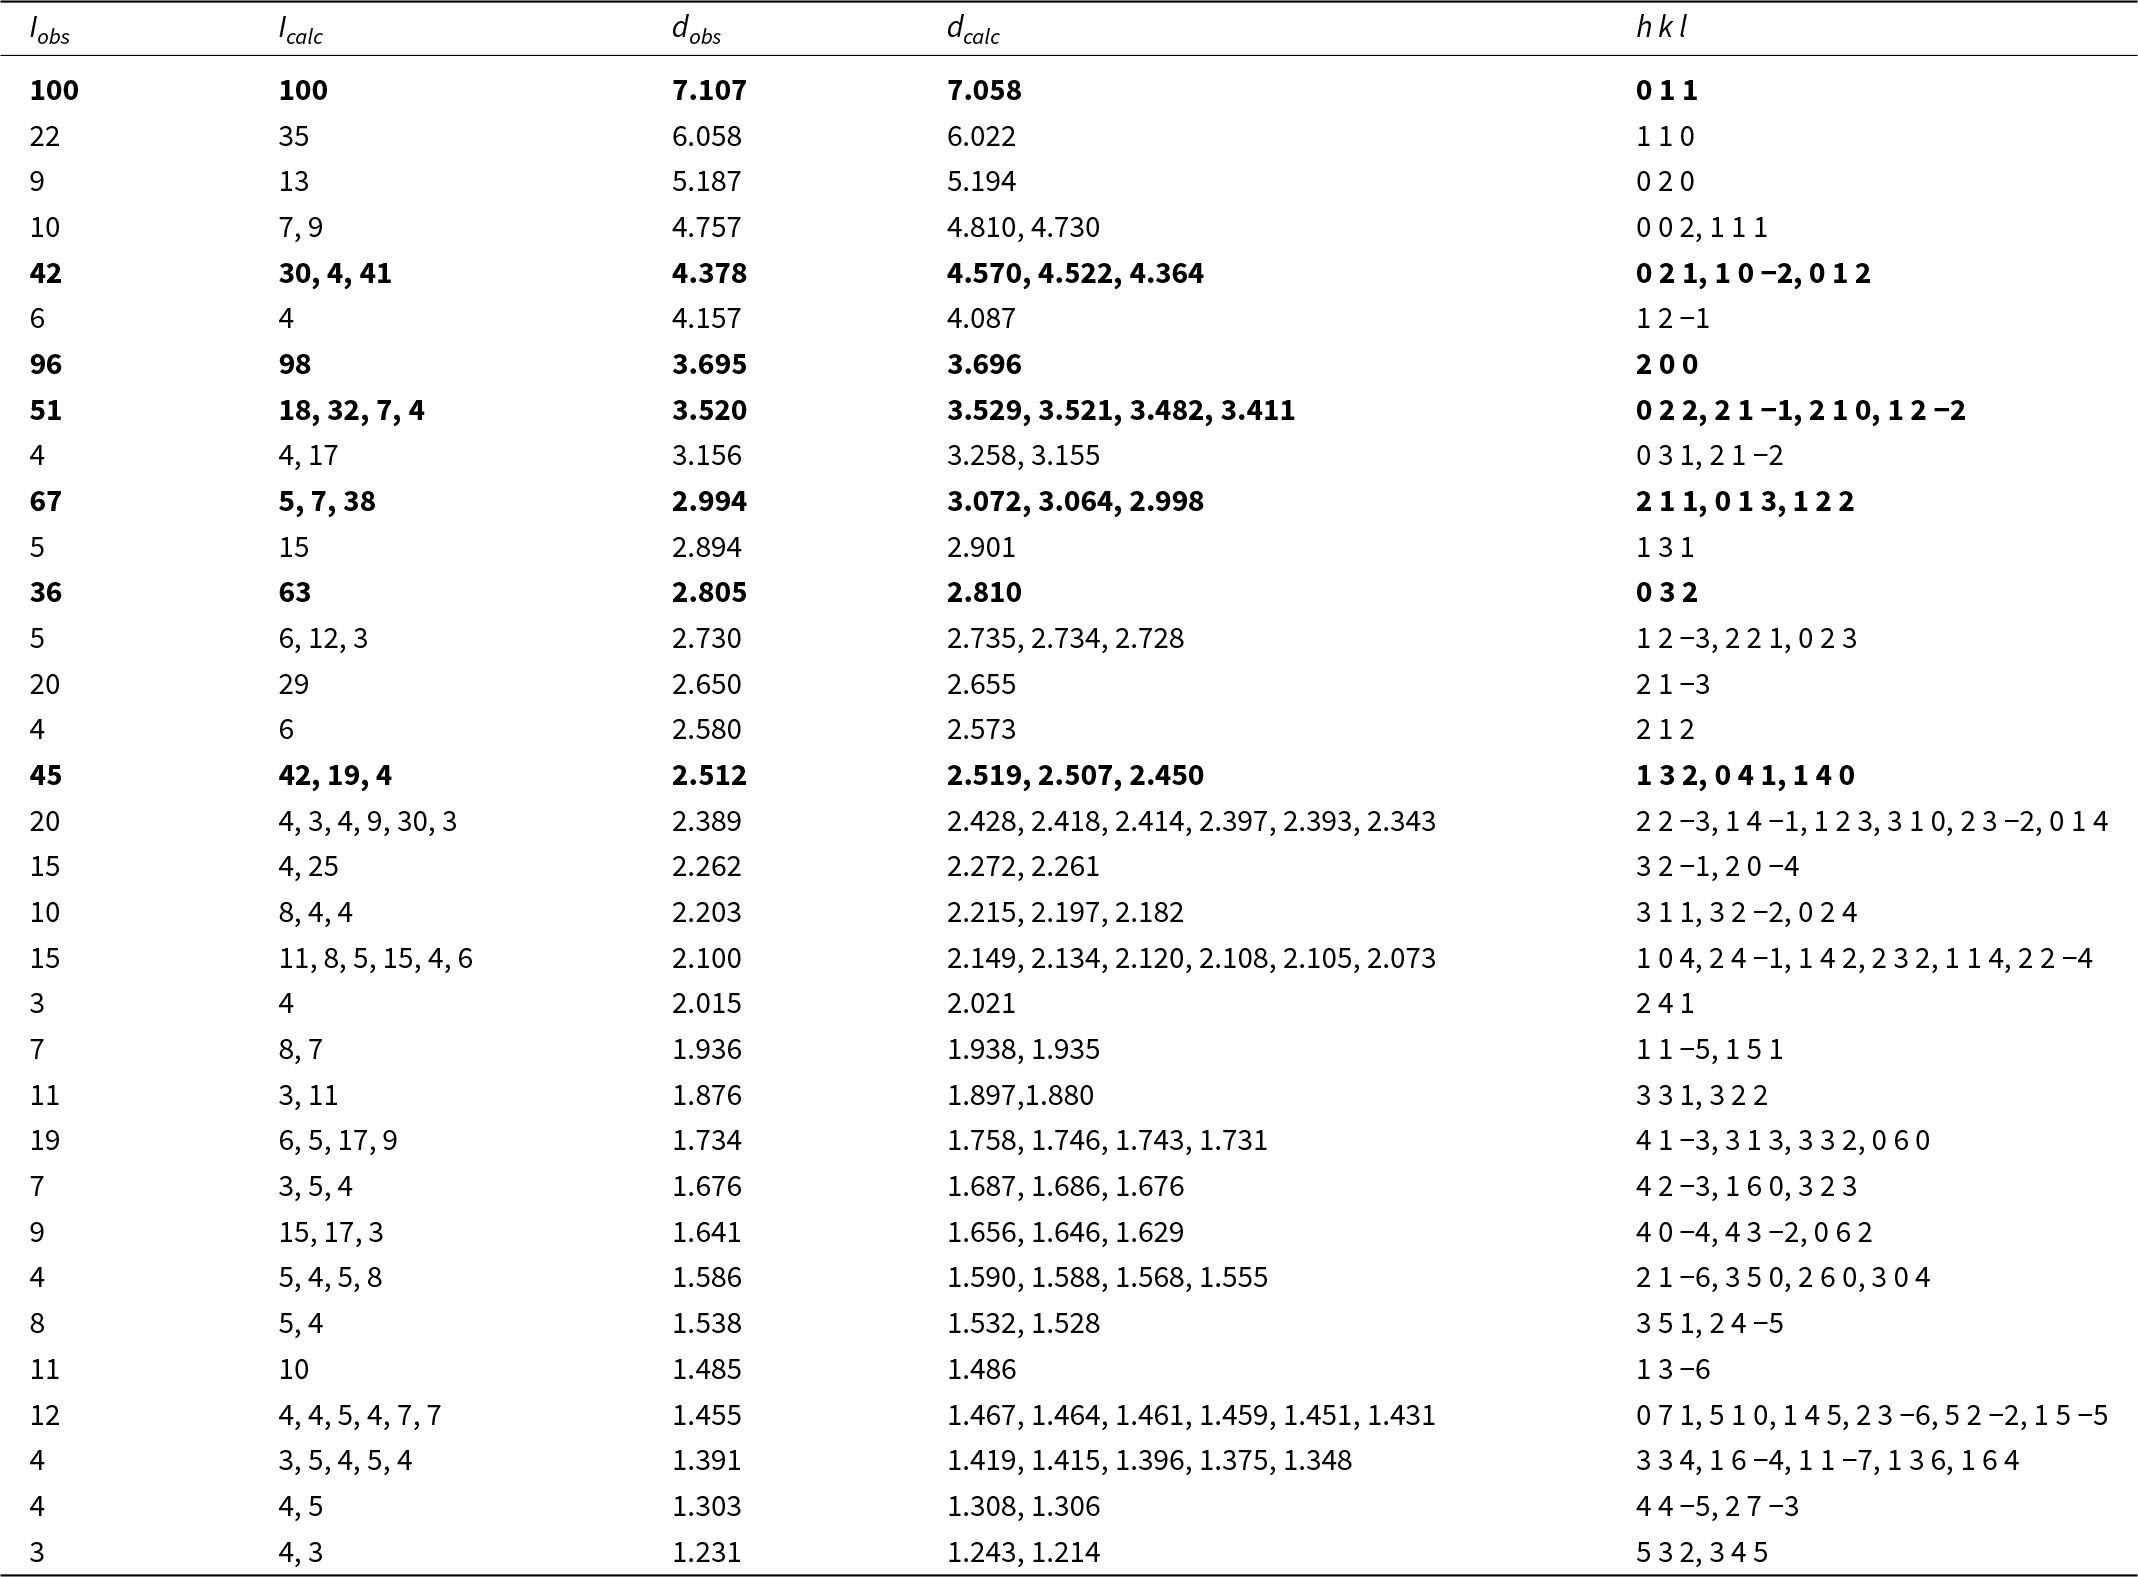
The powder X-ray diffraction data are shown in Table 2. The seven strongest powder X-ray diffraction peaks [d in Å (I, %)] are 7.107(100), 3.695(96), 2.994(67), 3.520(51), 2.512(45), 4.378(42), 2.805(36). The unit cell parameters obtained indexed and refined from the powder diffraction data are: a = 7.5853(1), b = 10.3862(1), c = 9.8727(1) Å, β = 102.980(1)°, V = 757.93(25) Å3.
Powder X-ray diffraction data (d in Å) for arsenoveszelyite

Table 2 Long description
Powder X-ray diffraction peak list for arsenoveszelyite, reporting observed and calculated intensities alongside observed and calculated d-spacings in angstroms and assigned h k l indices. The most intense observed peak is at d 7.107 Å (h k l 0 1 1), with a close calculated d of 7.058 Å and matching intensity. Another very strong peak occurs at d 3.695 Å (h k l 2 0 0), where observed and calculated intensities are both near 100 and d values nearly coincide. Several mid- to high-intensity peaks appear at d 4.378 Å (observed intensity 42), 3.520 Å (51), 2.994 Å (67), and 2.512 Å (45), each paired with one or more calculated lines and corresponding h k l assignments. Many rows list multiple calculated intensities and d values for a single observed peak, indicating overlapping reflections or closely spaced calculated lines. Overall, observed d-spacings track the calculated d-spacings closely from about 7.1 down to about 1.23 Å, supporting the reflection indexing, while intensity agreement varies from close matches to noticeable differences for some peaks.
Notes: The strongest lines are given in bold.
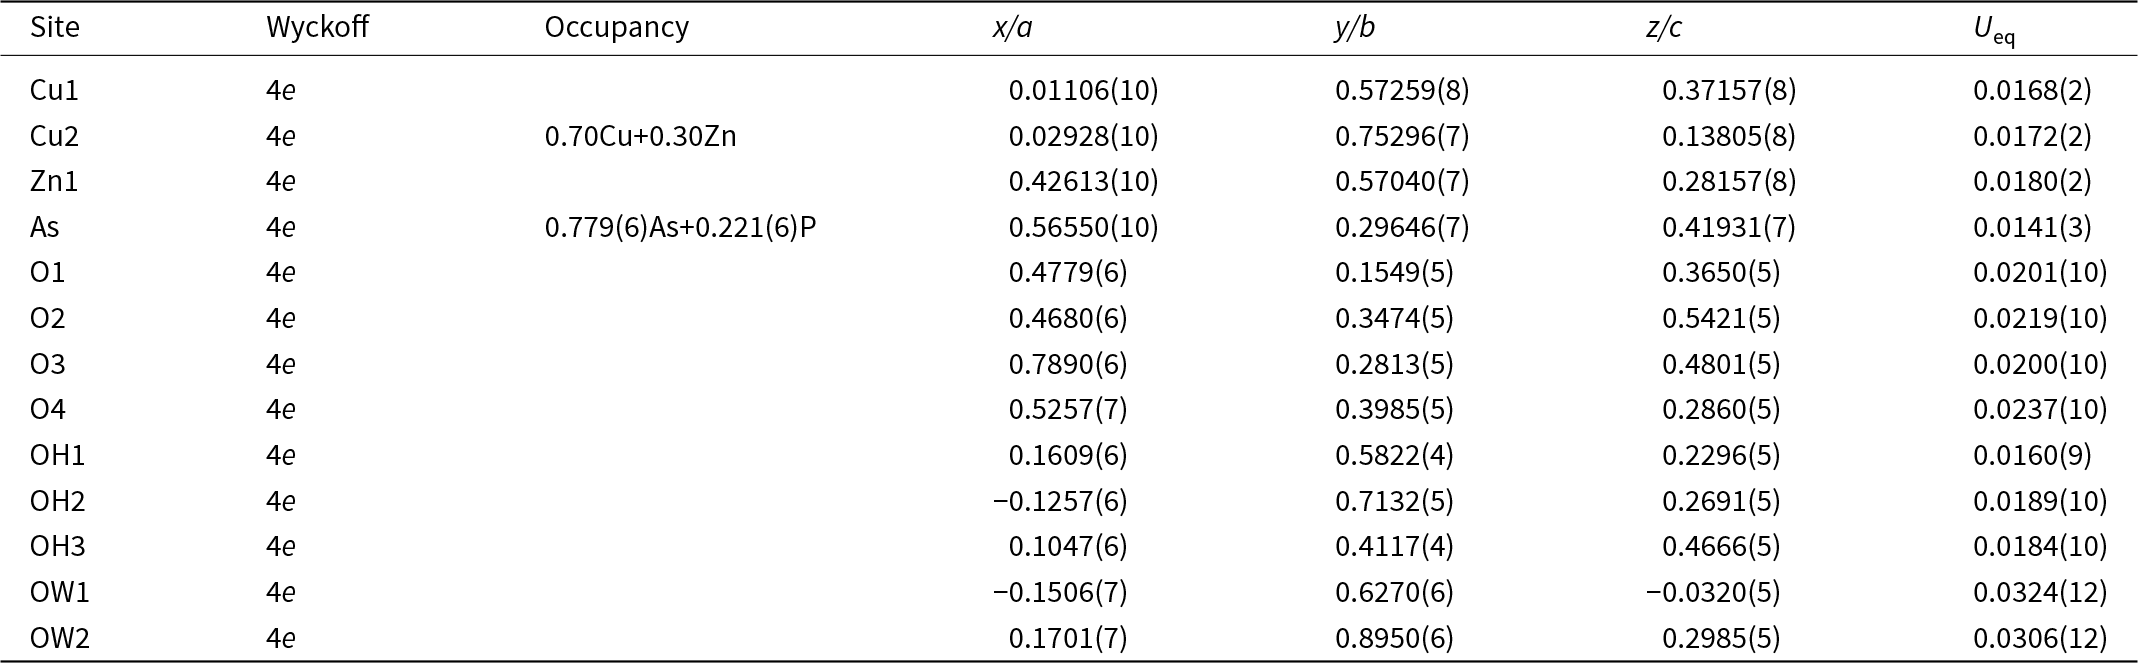
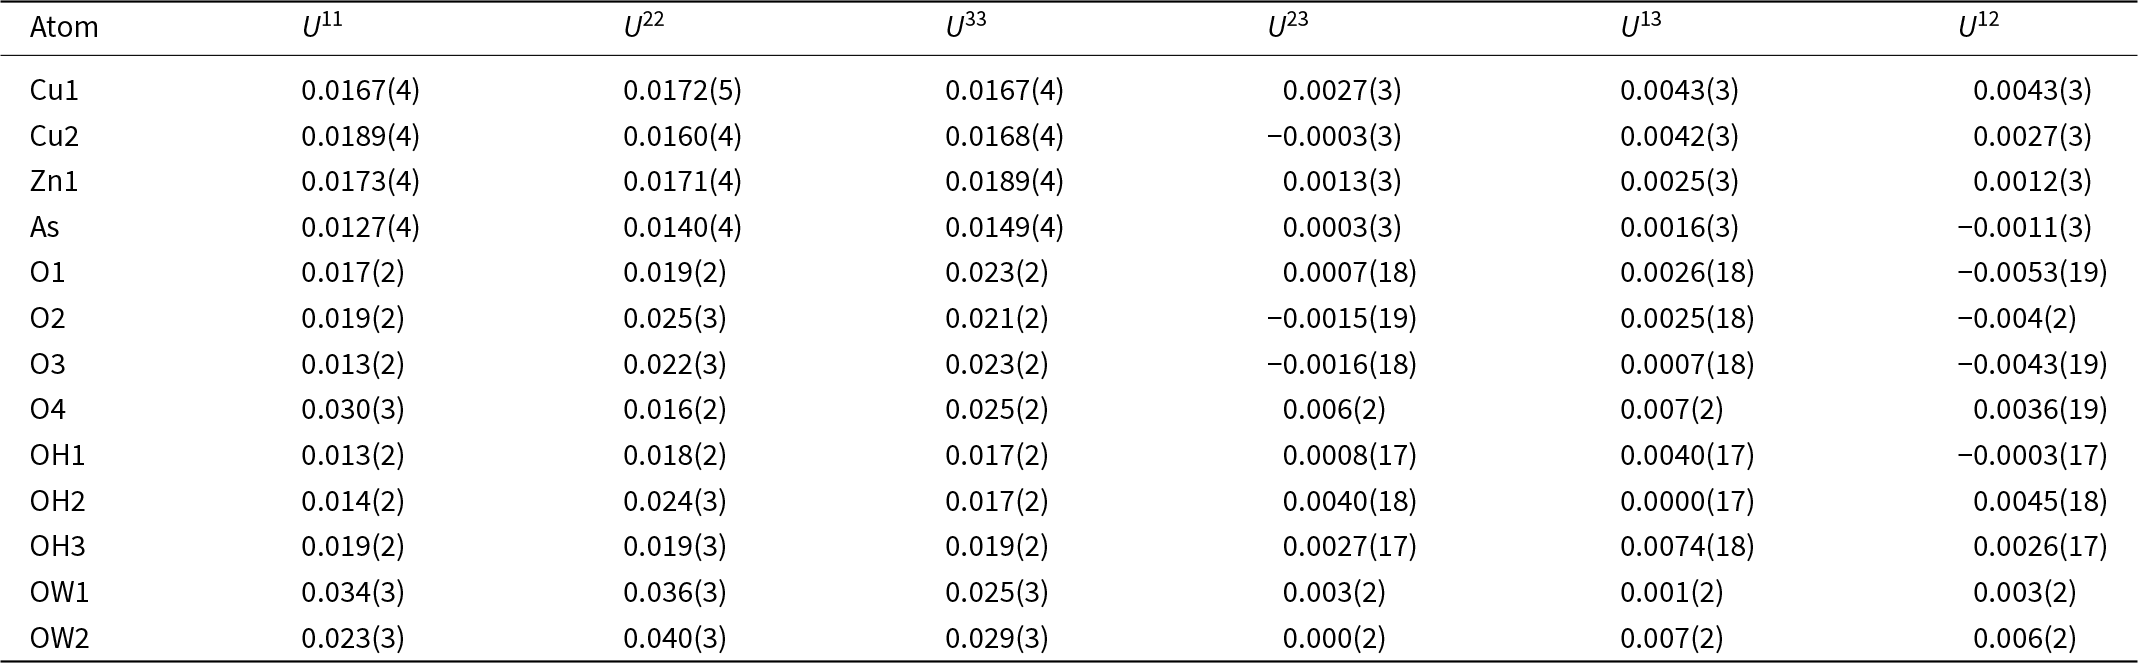
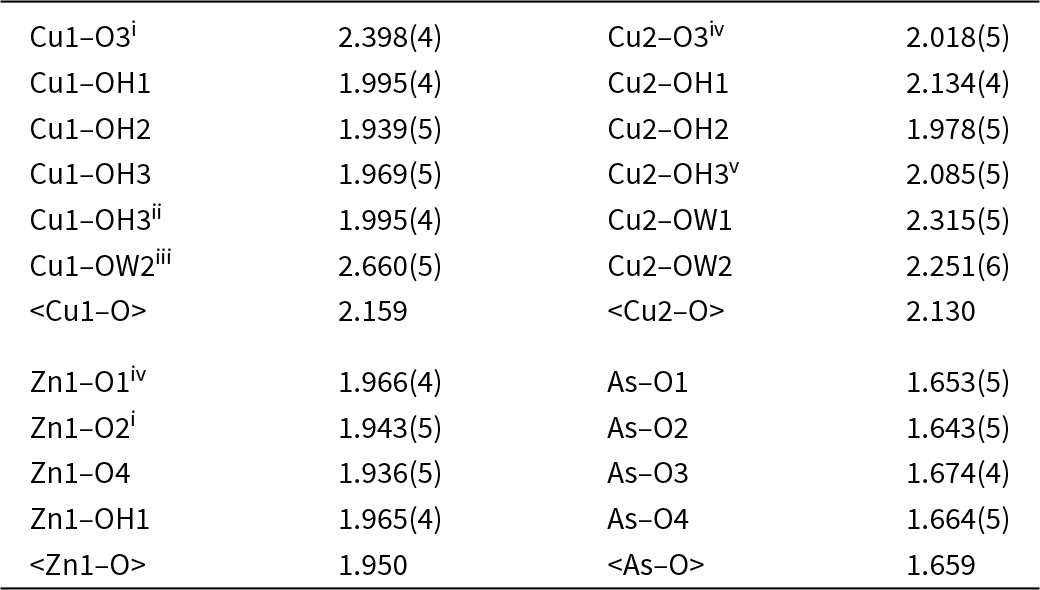
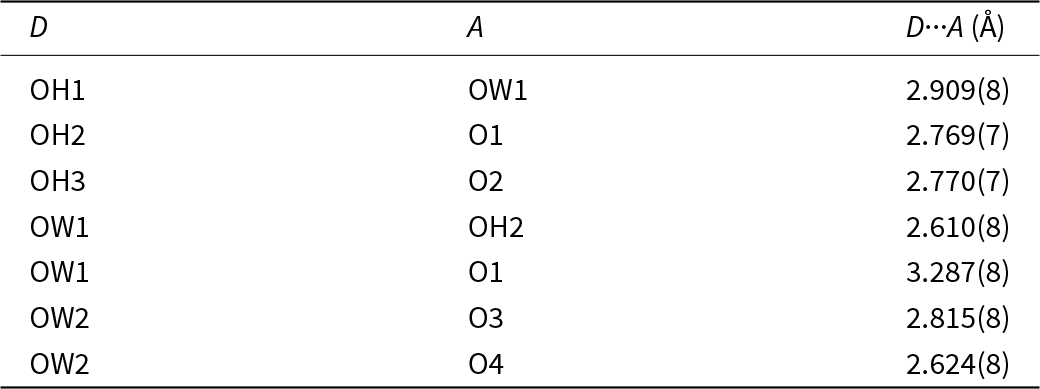
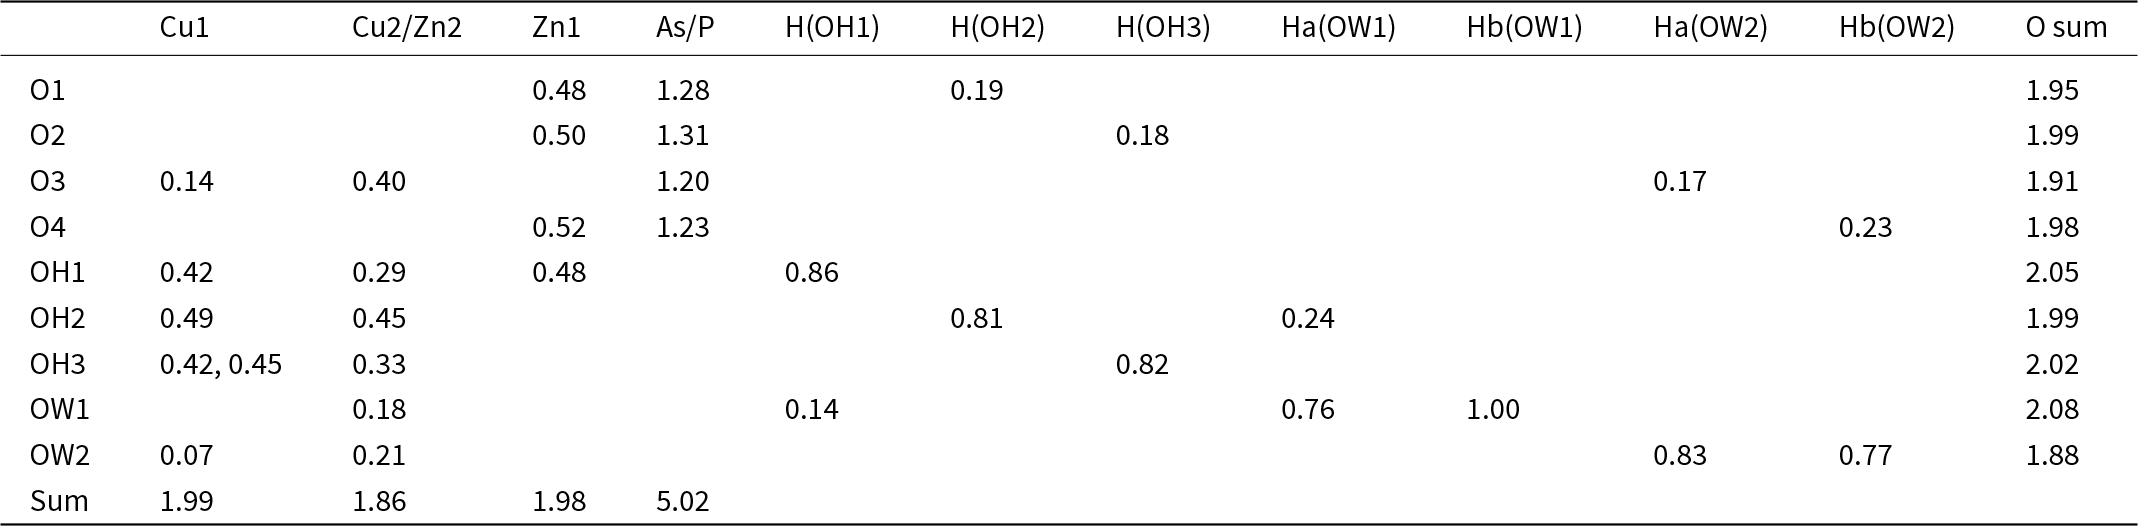
The unit-cell parameters obtained from single-crystal X-ray diffraction are: a = 7.5852(4), b =10.3877(5), c = 9.8714(5) Å, β = 102.984(5)°, V = 757.91(7) Å3 and Z = 4. The structure was solved and refined in space group P21/c (#14). Data collection and refinement details are summarized in Table 3. Atomic coordinates, site occupancies, and thermal displacement parameters are presented in Tables 4 and 5, respectively, while selected bond lengths are listed in Table 6. Although the hydrogen atom positions were not directly determined from the electron density, hydrogen-bonding systems are proposed in Table 7 based on structural features and O···O distances. In the bond-valence calculations, the contribution of the hydrogen-bonding network was taken into account, allowing the assignment of OH groups and molecular water. The bond-valence sums (BVS) of atoms are presented in Table 8.
Data collection and structure refinement details for arsenoveszelyite

Table 3 Long description
Crystal structure and single-crystal X-ray data collection details are reported for arsenoveszelyite, including unit-cell metrics, measurement conditions, and refinement quality indicators. The sample is a green block crystal measuring 0.030 by 0.010 by 0.010 millimeters, measured at 293 K in the monoclinic space group P21/c. Unit-cell parameters are a 7.5852 angstroms, b 10.3877 angstroms, c 9.8714 angstroms, beta 102.984 degrees, volume 757.91 cubic angstroms, with Z equal to 4 and calculated density 3.61 grams per cubic centimeter. Data were collected on an XtaLAB PRO-007HF using molybdenum K alpha radiation with wavelength 0.71073 angstroms, across 956 frames and a theta range from 2.756 to 29.202 degrees, using multi-scan absorption correction with Tmin 0.329 and Tmax 1.000. Reflection counts are 7613 measured, 1866 independent, and 1496 observed, with Rint 0.077 and completeness 99.88 percent to 26.32 degrees theta; index ranges span h minus 10 to 10, k minus 13 to 14, and l minus 13 to 9. Refinement used full-matrix least squares on F squared with 1866 reflections, 120 parameters, and 1 restraint, giving R1 0.0492 for observed and 0.0619 for all data, and weighted R2 0.1307 for observed and 0.1375 for all data. Goodness of fit is 1.049, and residual electron density ranges from 1.93 to minus 1.33 electrons per cubic angstrom, indicating a generally well-behaved refinement with some remaining residual features.
Atomic coordinates and site occupancies for arsenoveszelyite

Table 4 Long description
Atomic site parameters for arsenoveszelyite are given as site label, Wyckoff position, site occupancy, fractional coordinates along a, b, and c, and equivalent displacement parameter Ueq. All listed atoms occupy Wyckoff position 4e. Mixed occupancy occurs at Cu2 with 0.70 copper and 0.30 zinc, and at the arsenic site with about 0.779 arsenic and 0.221 phosphorus. Cu1 has coordinates near x 0.01106, y 0.57259, z 0.37157 with Ueq 0.0168, while Zn1 is near x 0.42613, y 0.57040, z 0.28157 with Ueq 0.0180. Oxygen and hydroxyl sites O1 to O4 and OH1 to OH3 have Ueq values mostly around 0.016 to 0.024, indicating similar atomic displacement across these anion positions. Water oxygen sites show the largest displacement, with OW1 Ueq 0.0324 and OW2 Ueq 0.0306, suggesting greater positional or thermal disorder for water compared with framework atoms. Some coordinates are slightly negative for OH2 and OW1 in x and for OW1 in z, which can occur in fractional coordinates and should be interpreted within the unit-cell periodicity. Values in parentheses indicate measurement uncertainty in the last digits.
Anisotropic displacement parameters (in Å2) for arsenoveszelyite

Table 5 Long description
Anisotropic displacement parameters are listed for arsenoveszelyite atoms, giving U11, U22, U33 and the cross terms U23, U13, and U12 in angstrom squared with uncertainties in parentheses. Water oxygen sites show the greatest motion: OW2 has U22 0.040 and OW1 has U22 0.036, with OW1 also having U11 0.034. The smallest principal values occur for As, with U11 0.0127, U22 0.0140, and U33 0.0149. Copper and zinc sites are similar and moderate, with Cu1 and Cu2 near 0.016 to 0.019 and Zn1 near 0.017 to 0.019 across U11 to U33. Framework oxygen and hydroxyl sites span a wider range, including O4 with elevated U11 0.030 and U33 0.025 compared with other oxygens. Cross terms are generally small in magnitude, often near zero to about 0.007, with the most negative values around minus 0.005 for O1 U12 and O3 U12. Values should be interpreted with their reported uncertainties, and comparisons are most reliable when differences exceed those uncertainty ranges.
Selected bond lengths (Å) for arsenoveszelyite

Table 6 Long description
Bond lengths in angstroms are listed for Cu1, Cu2, Zn1, and As to oxygen or hydroxyl and water oxygen sites, including some symmetry-related contacts. Cu1 bonds range from 1.939 to 2.660, with the longest contact to OW2 and a longer Cu1 to O3 contact at 2.398. Cu2 bonds range from 1.978 to 2.315, with the longest to OW1 and the shortest to O3 at 2.018. Average Cu to oxygen distances are similar, about 2.159 for Cu1 and about 2.130 for Cu2. Zn1 to oxygen distances are tightly grouped from 1.936 to 1.966, averaging about 1.950. As to oxygen distances are shorter, from 1.643 to 1.674, averaging about 1.659. Values with parentheses indicate measurement uncertainty in the last digits, and symmetry codes mark equivalent atoms rather than additional unique sites.
Symmetry codes: (i) –x+1, –y+1, –z+1; (ii) –x, –y+1, –z+1; (iii) –x, y–½, –z+½; (iv) –x+1, y+½, –z+½; (v) –x, y+½, –z+½.
Proposed hydrogen bond distances (Å) for arsenoveszelyite, D = donor; A = acceptor

Table 7 Long description
Hydrogen bond donor to acceptor distances are listed in angstroms for seven donor acceptor pairs in arsenoveszelyite. Distances range from 2.610(8) to 3.287(8). The shortest contact is OW1 donating to OH2 at 2.610(8), followed closely by OW2 donating to O4 at 2.624(8). Three hydroxyl donors show similar distances: OH2 to O1 at 2.769(7), OH3 to O2 at 2.770(7), and OH1 to OW1 at 2.909(8). OW2 forms two moderate length contacts, to O4 at 2.624(8) and to O3 at 2.815(8). The longest and most weakly indicated interaction is OW1 to O1 at 3.287(8), notably longer than all others. Values include uncertainty in parentheses, so small differences among near equal distances may not be meaningful.
Bond-valence sums (BVS) for arsenoveszelyite

Table 8 Long description
Bond-valence contributions are listed for each oxygen-bearing site (O1 to O4, OH1 to OH3, OW1 to OW2) from cations (Cu1, mixed Cu2 and Zn2, Zn1, mixed As and P) and from hydrogen donors tied to hydroxyl and water groups. Oxygen-site totals are close to two for most sites: O1 1.95, O2 1.99, O3 1.91, O4 1.98, OH1 2.05, OH2 1.99, OH3 2.02, OW1 2.08, and OW2 1.88. The lowest oxygen total is OW2 at 1.88 and the highest is OW1 at 2.08, suggesting slightly weaker overall bonding at OW2 and slightly stronger at OW1 compared with the others. Selected cation-to-oxygen contributions include Zn1 to O1 through O4 at about 0.48 to 0.52 and As and P to O1 through O4 at about 1.20 to 1.31. Hydroxyl sites show mixed metal bonding plus hydrogen contributions, for example OH1 combines Cu1 0.42, Cu2 and Zn2 0.29, Zn1 0.48, and H(OH1) 0.86 for an oxygen total of 2.05. Water sites include hydrogen-bond contributions, with OW1 receiving H(OH1) 0.14 plus two water-hydrogen terms of 0.76 and 1.00, and OW2 receiving two water-hydrogen terms of 0.83 and 0.77. Cation totals at the bottom are Cu1 1.99, mixed Cu2 and Zn2 1.86, Zn1 1.98, and mixed As and P 5.02, consistent with expected valence sums given the stated mixed occupancies and the hydrogen-bond method used.
Note: The BVS is calculated with the ECoN21 program (Ilinca, Reference Ilinca2022) and the following site occupancies: Cu2 site is based on the occupancy of 0.70Cu22++0.30Zn22+, As site on the occupancy of 0.78As5++0.22P5+. Hydrogen-bond valences based on O···O bond lengths, are from Brown and Altermatt (Reference Brown and Altermatt1985).
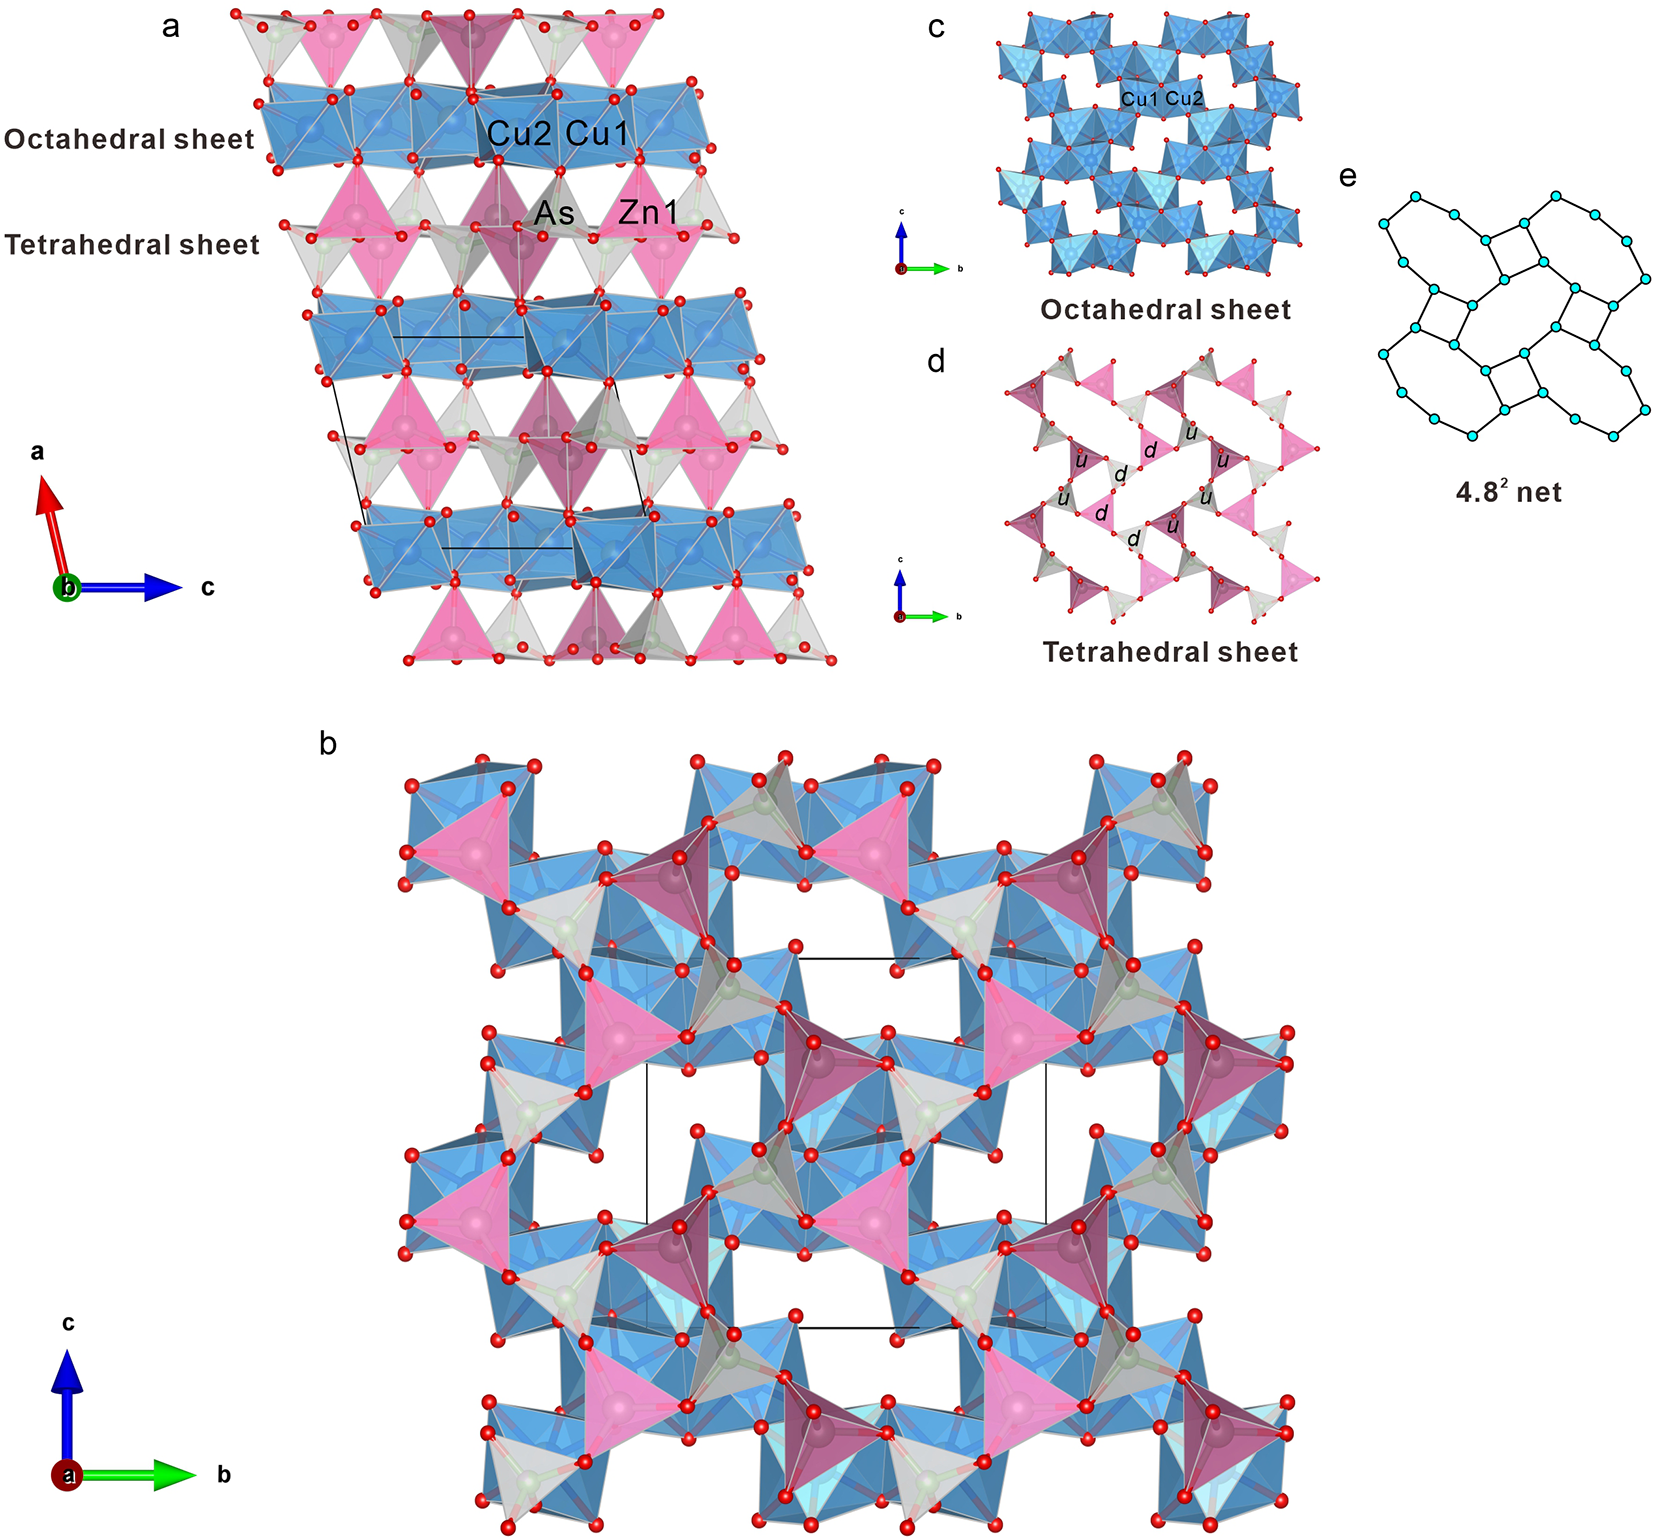
The crystal structure of arsenoveszelyite consists of alternating octahedral and tetrahedral sheets stacked parallel to the (001) plane (Fig. 4a, b). The octahedral sheets are composed of two types of Cu-centred octahedra (Fig. 4c), while the tetrahedral sheets consist of a mixture of Zn- and As-centred tetrahedra (Fig. 4d).
Crystal structure of arsenoveszelyite. The crystal-structure drawings were prepared using VESTA (Momma and Izumi, Reference Momma and Izumi2011). Legend: Cu octahedra = blue; As tetrahedra = grey; Zn tetrahedra = pink; O atoms are shown as red spheres. (a) Projection along the b axis, showing the alternating tetrahedral and octahedral sheets. (b) Projection along the a axis, perpendicular to the layers, illustrating the stacking of tetrahedral and octahedral sheets. (c) Isolated view of the octahedral sheet. (d) Isolated view of the tetrahedral sheet. (e) Idealized 4.82 net corresponding to the topology of the octahedral and tetrahedral layers.

Figure 4 Long description
The image consists of five parts illustrating the crystal structure of arsenoveszelyite. In the first part, labeled ′a′, the projection along an axis shows alternating octahedral and tetrahedral sheets. The octahedral sheet is composed of Cu-centered octahedra, while the tetrahedral sheet includes Zn- and As-centered tetrahedra. The second part, labeled ′b′, presents a projection along another axis, perpendicular to the layers, highlighting the stacking of these sheets. The third part, labeled ′c′, isolates the octahedral sheet, showing its structure. The fourth part, labeled ′d′, isolates the tetrahedral sheet, displaying its arrangement. The fifth part, labeled ′e′, depicts an idealized 4.8 net corresponding to the topology of the octahedral and tetrahedral layers. Each part includes a coordinate axis for orientation, with Cu octahedra, As tetrahedra, Zn tetrahedra and O atoms represented by different shapes and colors.
Octahedral coordination and stereochemistry of Cu2+
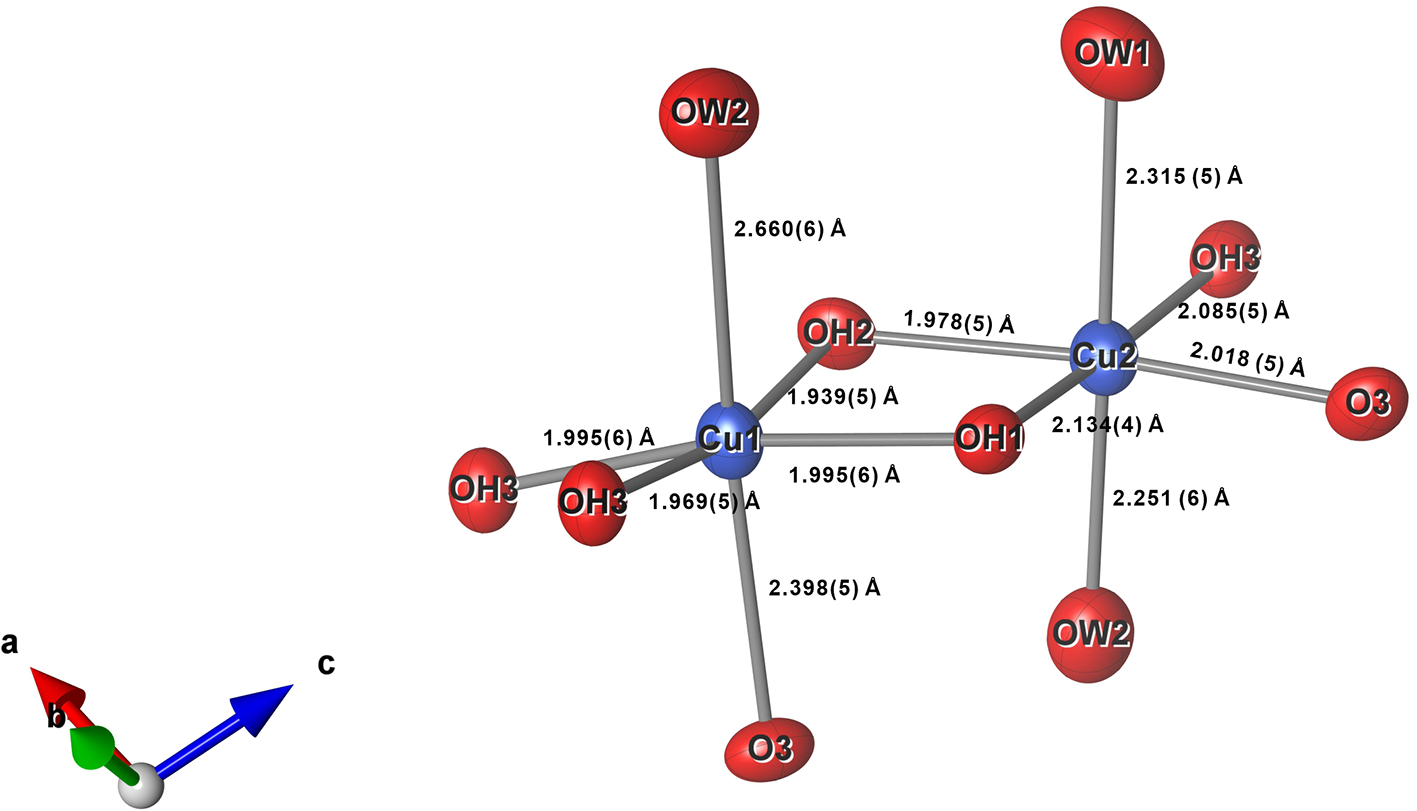
In the crystal structure of arsenoveszelyite, two distinct octahedrally coordinated Cu sites are present. Due to the Jahn-Teller effect, both octahedra exhibit distortions, with detailed bond lengths and coordination environments provided in Table 6 and Fig. 5. The Cu1 site is coordinated by four OH– groups, one H2O molecule, and one O atom, forming a distorted [CuO(OH)4(H2O)]4– octahedron. The Cu1–OH bond lengths are relatively similar, at 1.939(5), 1.969(5), and two equivalent bonds of 1.995(4) Å. The Cu1–O bond length is 2.398(4) Å, and the Cu1–H2O bond (OW2) is significantly longer at 2.660(5) Å. The Cu2 site is coordinated by three OH– groups, two H2O molecules, and one O atom, forming a [CuO(OH)3(H2O)2]3– octahedron. The Cu2–OH bond lengths are 1.978(5), 2.085(5), and 2.134(4) Å. The Cu2–H2O bond lengths are 2.251(6) Å (OW2) and 2.315(5) Å (OW1), while the Cu2–O bond (O3) is 2.018(5) Å.
Displacement ellipsoids and bond lengths for Cu1 and Cu2 polyhedra in arsenoveszelyite. The probability for ellipsoids is 0.75.

Figure 5 Long description
The crystal structure displays two distinct octahedrally coordinated copper sites, Cu1 and Cu2, in arsenoveszelyite. Cu1 is coordinated by four OH groups, one H subscript 2 O molecule and one O atom, forming a distorted octahedron. The Cu1–OH bond lengths are 1.939, 1.969 and two equivalent bonds of 1.995 angstroms. The Cu1–O bond length is 2.398 angstroms and the Cu1–H subscript 2 O bond length is 2.660 angstroms. Cu2 is coordinated by three OH groups, two H subscript 2 O molecules and one O atom, forming another octahedron. The Cu2–OH bond lengths are 1.978, 2.085 and 2.134 angstroms. The Cu2–H subscript 2 O bond lengths are 2.251 and 2.315 angstroms, while the Cu2–O bond length is 2.018 angstroms. The image includes a coordinate system with axes labeled a, b and c.
To further quantify the extent of distortion in the Cu coordination environments, the octahedral distortion parameter (Δoct) was calculated following the method of Wildner (Reference Wildner1992).
The formula is:
 \begin{equation*}{\Delta _{\text{oct}}}\, = \,\frac{1}{6}{\sum\limits_{i = 1}^6 {\left[ {\frac{{\left( {{d_i} - {d_m}} \right)}}{{{d_m}}}} \right]} ^2}\end{equation*}
Where d i is the Cu–O bond length and dm is the average value of the Cu–O bond length.
The Δoct values for Cu1 and Cu2 are approximately 0.0160 and 0.0032, respectively, indicating that the Cu1 site is significantly more distorted. Given that Cu2+ typically exhibits strong Jahn-Teller distortion whereas Zn2+ does not (Wildner and Giester, Reference Wildner and Giester1988; Danisi et al., Reference Danisi, Armbruster, Lazić, Vulić, Kaindl, Dimitrijević and Kahlenberg2013), this suggests that Zn2+ preferentially occupies the less-distorted Cu2 site. However, due to the similar ionic radii and X-ray scattering powers of Cu and Zn, their occupancies cannot be refined independently. Therefore, based on the chemical composition and normalization, the Cu2 site occupancy was constrained to 0.70 Cu and 0.30 Zn during refinement, while the Cu1 site was treated as fully occupied by Cu. In addition to the Jahn-Teller effect, the stronger distortion at Cu1 compared with Cu2 may also be related to their coordination environments. Both Cu sites are in elongated octahedral geometries; however, Cu1 shows pronounced elongation of the Cu1–OW2 and Cu1–O3 bonds, whereas in Cu2 the elongations are mainly in Cu2–OW1 and Cu2–OW2. Notably, the elongated bonds at Cu1 involve coordination to both a water molecule (H2O) and an oxide ion (O2–), leading to a more asymmetric environment, which may further enhance the distortion at this site.
Tetrahedral coordination
The structure contains two types of tetrahedra: [ZnO3(OH)]5– and (AsO4)3–. The [ZnO3(OH)]5– tetrahedron, fully occupied by Zn, is nearly regular, with Zn–O bond lengths of 1.936(5), 1.943(5), and 1.966(4) Å, and a Zn–OH bond length of 1.965(4) Å, giving an average of 1.950 Å. The (AsO4)3– tetrahedron is also nearly regular, with As–O bond lengths of 1.643(5), 1.653(5), 1.664(5), and 1.674(4) Å. Structure refinement indicates partial substitution by phosphorus at this site, as reflected by a reduced scattering factor compared to ‘pure As’; the refined occupancy is 0.779(6)As + 0.221(6)P.
Octahedral sheet topology
The octahedral sheet is formed by edge-sharing Cu1 and Cu2 octahedra, creating 8-membered rings (Fig. 4c). The topology of the central cations within the octahedral rings mirrors that of the tetrahedral rings (Fig. 4b).
Tetrahedral sheet topology and 4.82 network
The tetrahedral sheet is built by corner-sharing [ZnO3(OH)]5– and (AsO4)3– tetrahedra (Fig. 4d). These sheets conform to the 4.82 type among simple 3-connected planar nets composed of alternating squares and octagons (Hawthorne et al., Reference Hawthorne, Uvarova and Sokolova2019). Within each octagonal ring, four tetrahedra have their apical oxygen atoms pointing upward (denoted as ‘u’) and four points downward (‘d’), forming a balanced up–down configuration. Similarly, each square ring contains two tetrahedra pointing up and two pointing down. This overall up–down arrangement of tetrahedra in the sheet can be described symbolically as 4.82 (u2d2)(u4d2)2, where (u2d2) corresponds to the square rings and (u4d2)2 to the octagonal rings (Fig. 4e).
Relationship with other minerals and potential new minerals
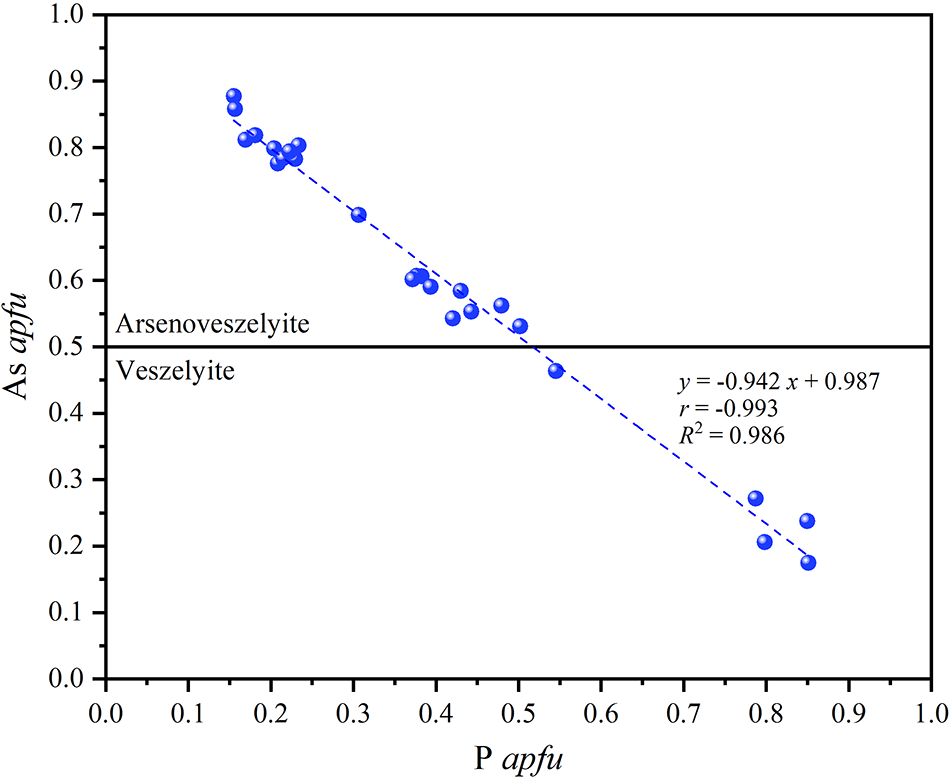
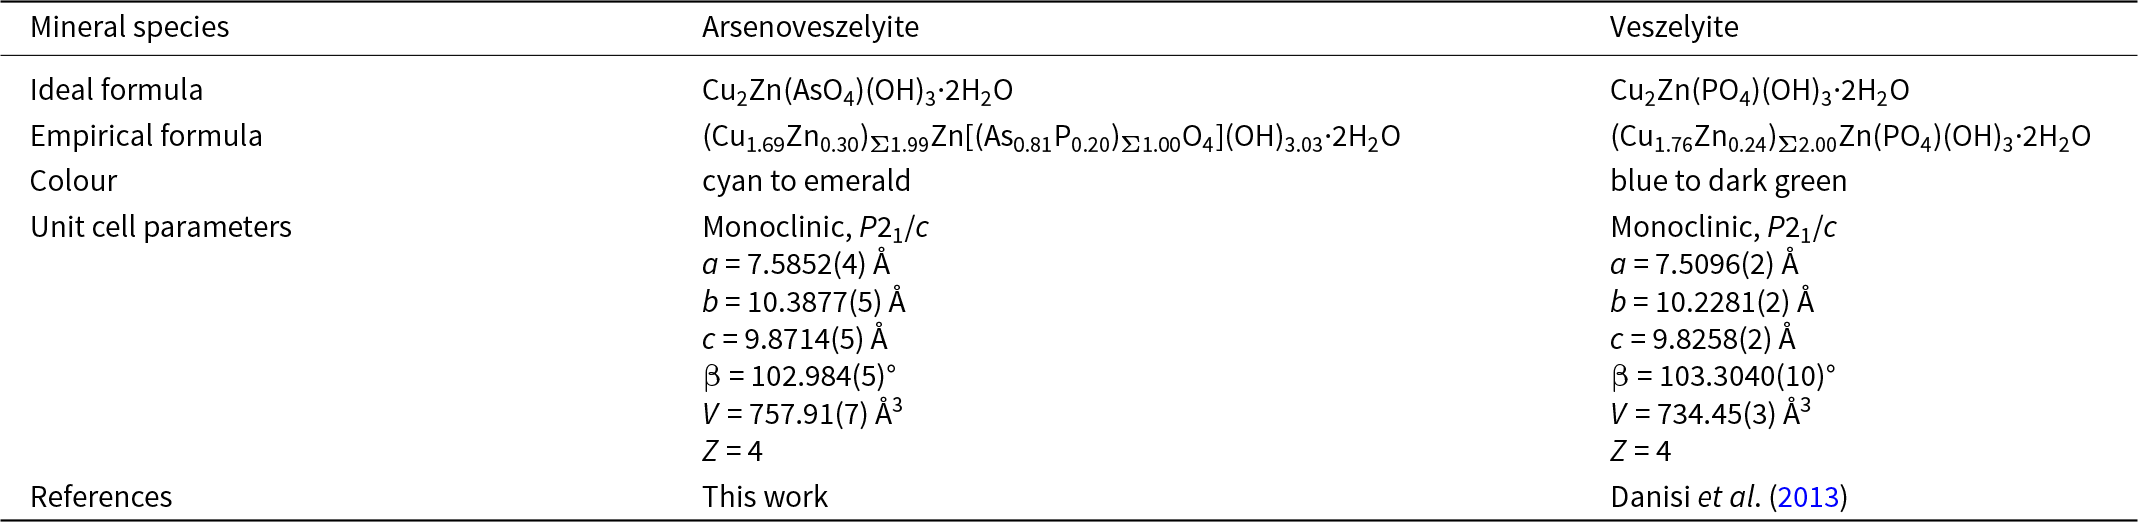
Arsenoveszelyite is the arsenate analogue of veszelyite. Due to the larger ionic radius of As5+ compared to P5+, both the unit-cell parameters and unit-cell volume of arsenoveszelyite are slightly larger than those of veszelyite (Table 9). Based on the 25 compositional points analysed on the grain shown in Fig. 2, apfu were calculated for each point. A correlation plot between As and P apfu reveals a strong linear relationship, with As apfu ranging from 0.15 to 0.85 (Fig. 6). This suggests a likely continuous solid-solution series. The plot clearly distinguishes between veszelyite and arseno-veszelyite.
Plot of As and P (apfu) from chemical analyses illustrating the compositional boundary between arsenoveszelyite and veszelyite.

A comparison for the properties of arsenoveszelyite and veszelyite

Table 9 Long description
Comparison of two copper zinc minerals across chemistry, color, crystallography, and literature source. Arsenoveszelyite has an ideal composition based on copper and zinc with arsenate, hydroxyl groups, and two waters, while veszelyite is the phosphate analogue with the same hydroxyl and water content. The empirical composition for arsenoveszelyite indicates mostly copper with some zinc and a mixed arsenic and phosphorus tetrahedral group, whereas veszelyite remains phosphate dominated. Color differs: arsenoveszelyite is described as cyan to emerald, while veszelyite ranges from blue to dark green. Both are monoclinic in space group P two one slash c with four formula units per unit cell. Unit cell dimensions are close, but arsenoveszelyite has slightly larger cell edges and a larger cell volume than veszelyite, while the beta angle is slightly smaller. Reference sources differ, with arsenoveszelyite reported in the present study and veszelyite values taken from Danisi and coauthors, two thousand thirteen.
In addition to As–P substitution, limited Cu–Zn substitution is also observed. Specifically, at the Cu2 site, Zn content does not exceed Cu in any analysed sample, with the maximum Zn occupancy reaching 0.3 apfu. Should future samples reveal Zn occupancy greater than 0.5 apfu at this site, it may suggest the existence of a distinct Cu–Zn ordered analogue of arsenoveszelyite–veszelyite.
Structurally, the topology and tetrahedral orientations of the tetrahedral sheet in arsenoveszelyite are consistent with those observed in the silicate cavansite (Evans, Reference Evans1973) and the phosphate–arsenate kipushite–philipsburgite–goldhillite series (Ismagilova et al., Reference Ismagilova, Rieck, Kampf, Giester, Zhitova, Lengauer, Krivovichev, Zolotarev, Ciesielczuk, Mikhailova, Belakovsky, Bocharov, Shilovskikh, Vlasenko, Nash and Adams2022).
Supmplementary material
The supplementary material for this article can be found at https://doi.org/10.1180/mgm.2025.10153.
Acknowledgements
We thank Ritsuro Miyawaki and his colleagues for their careful review and valuable suggestions on arsenoveszelyite. We are also grateful to Xiang Wu and Zhaochu Hu for providing access to analytical facilities. We thank Chang Li for taking the photomicrographs of the mineral. This study was supported by the National Natural Science Foundation of China (grants 41672043 and 42302042) and the Fundamental Research Funds for the Central Universities (2-9-2022-030).
Competing interests
The authors declare none.