INTRODUCTION
Natural transmission of trematodes from one host to another involves a multitude of biological phases, many specific to individual life stages, and influenced by abiotic and biotic factors associated with individual habitats that can ultimately affect success rates. The final phase of transmission is infection, which is a variable common to all three larval stages, namely miracidia, cercariae and metacercariae. All stages are capable of passive penetration through host ingestion but only miracidia and cercariae demonstrate active infectivity. Climate change is predicted to have wide-ranging effects on organisms including parasites, with temperature considered to be one of the main affected variables. Recent meta-analyses on the physiological response of trematodes to temperature have established that, in general, most species demonstrate a large degree of thermostability over core temperature ranges for the survival and metabolism of cercariae and miracidia with no evidence of elevated responses in the development and emergence of cercariae over optimal temperatures. In addition, all studies demonstrated a general physiological decline at high temperature (Morley, Reference Morley2011, Reference Morley2012; Morley and Lewis, Reference Morley and Lewis2013). These results have largely contradicted the more established views that temperature invokes a strong linear reaction in trematodes, e.g. Pietrock and Marcogliese (Reference Pietrock and Marcogliese2003), Poulin (Reference Poulin2006). However, it remains to be determined if infectivity, the remaining key trematode transmission variable, also demonstrates the same limited thermal responses. Studies of temperature effects on aquatic invertebrates have shown that different life history stages may demonstrate variable functional biology thermodynamics (Costlow et al. Reference Costlow, Bookhout and Monroe1960; Vernberg and Vernberg, Reference Vernberg and Vernberg1964; Mangum et al. Reference Mangum, Oakes and Shick1972). For trematodes Morley (Reference Morley2012) showed that miracidia demonstrate a greater degree of survival thermostability than cercariae, and in the case of schistosomes both larval stages show differing thermal responses over comparable temperature ranges. It is therefore conceivable that trematode infectivity may also vary between all three larval stages under the influence of similar temperature regimes. Differing levels of susceptibility of endothermic and ectothermic target hosts may also influence the success rate of cercarial infectivity due to their contrasting physiological and behavioural reactions to temperature changes.
Laboratory studies on infectivity are by necessity much simplified and can only crudely reflect the natural environment. In general, these involve exposing target hosts to artificially high numbers of larval stages in confined vessels. This process can be divided into two phases ‘penetration’ and ‘migration and establishment’. ‘Penetration’ is a phase that is generally nutrient independent of the host and involves either active infiltration across the host integument or through natural openings, or passive entry by host ingestion followed by active hatching or excystment. ‘Migration and establishment’ to initial host organs is less well understood but this phase can be either nutrient independent or dependent on the host for success. Most experimental studies consider successful infectivity to be the number of individuals established within the host a few days or weeks after exposure. Genetic variability of host and parasite play key roles in determining infectivity, capable of producing results that can range from 0–100% in any given system (Wakelin, Reference Wakelin1978; Richards and Shade, Reference Richards and Shade1987). A lack of standardization in experimental protocols is also important when comparing variations in results from independent studies, further complicating attempts to comparatively analyse the effects of a single variable such as temperature from the scientific literature. Nevertheless, although such difficulties necessitate a cautious level of interpretation with meta-analysis, worthwhile conclusions are achievable for infectivity studies as shown by Poulin (Reference Poulin2010a , Reference Poulin b ).
Therefore, it is essential in order to develop predictive frameworks of trematode responses to temperature fluctuations driven by climate change, that large-scale analyses of all components of trematode transmission are undertaken, despite the difficulties involved in interpreting data of this kind. In particular, methodological artefacts may be more obvious within thermal studies analysed in this manner, since temperature-driven reaction rates, such as Q 10 or E* which record the factor by which physiological processes change between different temperatures, remain comparable parameters across individual experiments (Bělehrádek, Reference Bělehrádek1935), thus allowing the identification of outliers, demonstrating atypical thermodynamics, easier.
The aim of the present study therefore is to analyse the effects of temperature on infectivity of each of the three trematode larval stages. Data from the scientific literature will be evaluated using the common and most accurate measure of temperature-driven reaction rates, the Arrhenius critical incremental energy of activation (E*).
MATERIALS AND METHODS
Source of data
Data on trematode infectivity were obtained from the scientific literature on laboratory studies undertaken at different constant temperatures. These studies were compiled based on searches of the following databases – ‘Web of Knowledge’, ‘Scopus’, ‘CABI Global Health’, ‘Helminthological Abstracts’, ‘Pubmed’, ‘Google Scholar’, ‘Zoological Record’; using mainly combinations and variations of the following terms – ‘miracidia’, ‘cercariae’, ‘metacercariae’, ‘trematodes’, ‘infectivity’, ‘transmission’, ‘temperature’. In general, studies that had examined temperature effects over at least a 10°C range were only used. Studies that pre-exposed miracidia or cercariae to temperature regimes and infectivity subsequently investigated at room temperature were not used for analysis. In total, 26 freshwater studies on miracidia, 26 on cercariae (15 targeting endothermic hosts and 11 targeting ectothermic hosts with 24 from freshwater sources), and 8 on metacercariae (all targeting endothermic hosts from freshwater sources) were analysed. In order to determine the standard of each study, data on the extent of acclimation the host was exposed to prior to experimentation were also extracted for cercariae and miracidia. Metacercarial studies were all undertaken with endothermic hosts through feeding experiments of parasites, an exposure methodology that traditionally does not involve acclimation of hosts.
Analysis of data
The thermodynamic relationship of trematode infectivity was determined using the critical incremental energy of activation (E*). Due to the complexity and variability of experimental studies on infectivity the E* value was considered to be a more accurate measure of temperature-driven reaction rates in preference to the Q 10 value providing more reliable results from the source data for comparative analysis. This value was calculated using the original intensity data for cercariae and metacercariae, or prevalence data for miracidia, from each source incorporating a range of temperatures that encompassed increases of approximately 10°C, over core temperature ranges as follows: 10–20°C (≈15°C), 15–25°C (≈20°C), 20–30°C (≈25°C), 25–35°C (≈30°C). At low and high ranges measurements encompassing precise 10 °C ranges were not always recorded, but all values were within 1–2°C of this range and such small variations are unlikely to substantially change the E* value generated. In those studies without precise 5°C increments data were extrapolated from measurements above and below the temperature readings, typically within 2–3°C of that required, which had been graphically plotted out to indicate the appropriate value. To ensure maximum infectivity values for analysis of cercariae and miracidia, data from larvae that were less than 3 h old were used for those studies that had compared infectivity related to age. For additional analysis of cercariae and miracidia, data were separated according to geographical distribution as mid-latitude species (36–60°) and low-latitude species (≤35°).
The critical incremental energy of activation (E* or μ) is a measure of temperature-driven reaction rates and represents the energy which molecules in their initial state must acquire before they can participate in a chemical reaction and can be considered a limiting or pacemaker step for complex physiological activity (Hoar, Reference Hoar1983). E* was determined using the following form of the Arrhenius equation (Prosser, Reference Prosser1973):
 $$E^* = \displaystyle{{ - 2.3R({\rm Log} K_2 - {\rm Log} K_1 )} \over {\displaystyle{1 \over {T_2}} - \displaystyle{1 \over {T_1}}}} $$
where K 1 and K 2 are infectivity data at absolute temperatures T 1 and T 2, and R is the gas constant (1·98 cal mole−1). For many enzymatic and biological processes in living organisms E* values usually range from 1 to 25 Kcal mole−1. Normal activation energy is approximately 10 Kcal mole−1 with many respiratory metabolic processes having values typically of 11 or 16 Kcal mole−1, positive values indicating an increased activation energy whilst negative values represent a decreased activation energy (Crozier, Reference Crozier1924; Brandts, Reference Brandts and Rose1967; Hoar, Reference Hoar1983). A value of 13·2 Kcal mole−1 is considered approximately equivalent to a Q 10 value of 2, whilst a Q 10 value of 1 is 0 Kcal mole−1 (Bělehrádek, Reference Bělehrádek1935). Thus for the purposes of determining thermostability we considered values between 8 and −8 Kcal mole−1 to represent thermostability. All E* values were analysed with Student's t-test using the SPSS computer package. T-tests of individual comparisons are undertaken in preference to other tests, such as ANOVA, due to the limitations of the dataset. These include variations in the underlying physiological mechanisms of infectivity between the three life history stages, and differing responses not only of ectothermic and endothermic target hosts, but also responses of individual parasite strains, and variability in the standardization of experimental protocols. Such limitations preclude multiple comparisons and therefore only analyses between two samples were undertaken at any time.
RESULTS
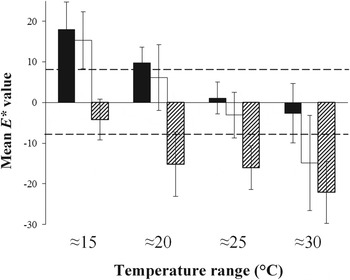
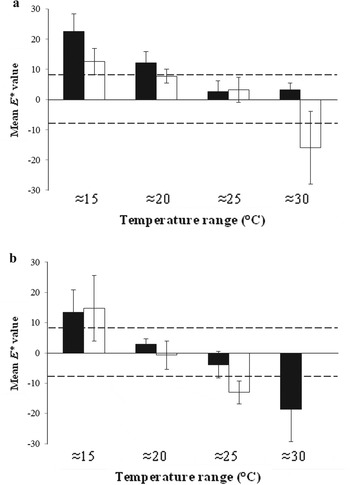
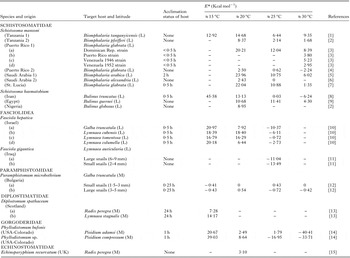
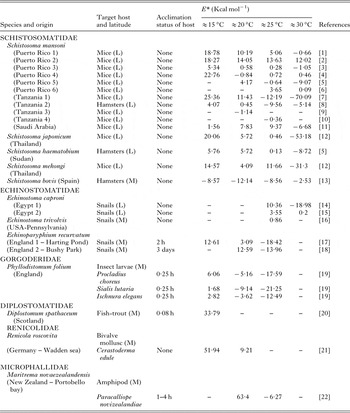
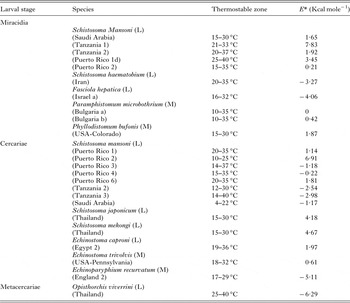
Temperature has a variable effect on the infectivity of all three larval stages (Table 1–3, Fig. 1). Both miracidia and cercariae demonstrate complex patterns of thermodynamics over increasing temperatures (Tables 1 and 2; Figs 1 and 2) which may vary both intraspecifically and interspecifically. In general, most species show a rise in infectivity with increasing temperature reaching a peak typically between 15 and 25°C for mid-latitude species and between 20 and 30°C for low-latitude species, before declining again as the temperature rises above optimum levels. Peak infectivity rates may occur either as sudden sharp increases at a single temperature reading or over wider temperature ranges of 5°C or more. However, notable exceptions occur. For example Schistosoma bovis cercariae demonstrate a decline in infectivity from a peak level at 10°C, whilst cercariae of Maritrema novaezealandensis show an extreme rise in infectivity over ≈20°C followed by an immediate decline (Table 2). Thermostability over a 5–10°C range is a common feature, generally occurring over temperature ranges of peak infectivity, although stability over low temperatures are not uncommon. A number of species demonstrate thermostability over ranges in excess of 10°C (Table 4).
Mean E* values of trematode infectivity over different temperature ranges (black bars, miracidia; white bars, cercariae; striped bars, metacercariae; ----, maximum extent of thermostability −8 to 8 Kcal Mole−1). Error bars are standard deviation.

Mean E* values of miracidia (black bars) and cercariae (white bars) over different temperature ranges from (a) low-latitude species; and (b) mid-latitude species (----, maximum extent of thermostability −8 to 8 Kcal Mole−1). Error bars are standard deviation.

Characteristics, acclimation status, target host, latitude (L-low-latitude, M-mid-latitude) and E* values of miracidial infectivity for each species over different temperature ranges

References: [1] Purnell (Reference Purnell1966a ), [2] Prah and James (Reference Prah and James1977), [3] DeWitt (Reference DeWitt1955), [4] Anderson et al. (Reference Anderson, Mercer, Wilson and Carter1982), [5] Lwambo et al. (Reference Lwambo, Upatham, Kruatrachue and Viyanant1987), [6] Jamjoom and Banaja (Reference Jamjoom and Banaja2007), [7] Upatham (Reference Upatham1973), [8] Chu et al. (Reference Chu, Massoud and Sabbaghian1966), [9] Lo (Reference Lo1972), [10] Gold and Goldberg (Reference Gold and Goldberg1979), [11] Al-jibouri et al. (Reference Al-Jibouri, Al-Mayah and Hassan2011), [12] Samnaliev and Vassilev (Reference Samnaliev and Vassilev1979), [13] Waadu and Chappell (Reference Waadu and Chappell1991), [14] Ubelaker and Olsen (Reference Ubelaker and Olsen1970), [15] McCarthy (Reference McCarthy1989).
Characteristics, acclimation status, target host, latitude (L-low-latitude, M-mid-latitude) and E* values of cercarial infectivity for each species over different temperature ranges

References: [1] DeWitt (Reference DeWitt1965), [2] Sirag and James Reference Sirag and James1982, [3] Stirewalt and Fregeau (Reference Stirewalt and Fregeau1965), [4] Christensen et al. (Reference Christensen, Frandsen and Nansen1979), [5] Ghandour (Reference Ghandour1976), [6] Stek and Sulaiman (Reference Stek and Sulaiman1984), [7] Purnell (Reference Purnell1966a ), [8] Purnell (Reference Purnell1966b ), [9] Wen (Reference Wen1961), [10] Foster (Reference Foster1964), [11] Lwambo et al. (Reference Lwambo, Upatham, Kruatrachue and Viyanant1987), [12] Upatham et al. (Reference Upatham, Kruatrachue and Khunborivan1984), [13] Ramajo Martin and Simon Martin (Reference Ramajo Martin and Simon Martin1984), [14] Evans (Reference Evans1985), [15] Meyrowitsch et al. (Reference Meyrowitsch, Christensen and Hindsbo1991 ), [16] Pechenik and Fried (Reference Pechenik and Fried1995), [17] McCarthy (Reference McCarthy1999), [18] Morley et al. (Reference Morley, Adam and Lewis2007), [19] Lewis (Reference Lewis1976), [20] Stables and Chappell (Reference Stables and Chappell1986), Thieltges and Rick (Reference Thieltges and Rick2006), [22] Studer et al. (Reference Studer, Thieltges and Poulin2010)
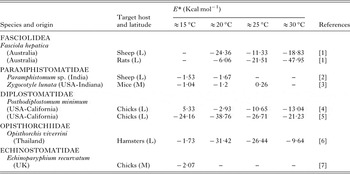
Characteristics, target host, latitude (L-low-latitude, M-mid-latitude) and E* values of metacercarial infectivity for each species over different temperature ranges. No hosts were acclimated to thermal regimes in these studies

References: [1] Boray (Reference Boray1963), [2] Chadhri and Gupta (Reference Chadhri and Gupta1985), [3] Ferrell et al. (Reference Ferrell, Negovetich and Wetzel2001), [4] Colley and Olson (Reference Colley and Olson1963), [5] Kellogg and Olson (Reference Kellogg and Olson1963), [6] Kruatrachue et al. (Reference Kruatrachue, Chitramvong, Upatham, Vichasri and Viyanant1982), [7] McCarthy (Reference McCarthy1989).
Values of E* of trematode larval stages demonstrating thermostability over the relevant stable and wide temperature ranges (L-low-latitude, M-mid-latitude)

In most cases, minimum temperature infectivity thresholds were not investigated for these two larval stages. However, a small number of studies found that, although infectivity declined as the temperature fell, no threshold was recorded and infections were still capable at temperatures as low as 1°C for miracidia of Paramphistomum microbothrium and 4 °C for cercariae of Schistosoma mansoni (Saudi Arabia strain). Nevertheless, a small number of minimum temperature thresholds were apparent, for example miracidia of Phyllodistomum spp. and cercariae of Echinoparyphium recurvatum but these appear to be associated mainly with responses of target hosts to the thermal regimes.
In general, both miracidia and cercariae demonstrate similar infective thermodynamics (Fig. 1). Over core temperature ranges of ≈15, ≈20, ≈25 and 30°C with total (combined low and mid-latitude species) miracidial and cercarial E* values being not significantly different (t test, P≥0·103, t≤0·870). Nevertheless, there were significant differences in thermal responses when both larval stages were separated out into low (≤35°) and mid (36–60°) latitude groups (Fig. 2). For miracidia, E* values of low-latitude species were significantly different between all core optimal ranges (t test, P≤0·027, t≥2·400) except for 30 and 25°C (t test, P = 0·386, t = −0·883) whilst mid-latitude species showed greater variability in thermal responses over most temperature ranges with only significant differences between 30 and 15°C (t test, P = 0·023, t = −2·800). In contrast, E* values for low-latitude species of cercariae were significantly different only between the ranges of ≈15 and ≈25°C (t test P = 0·025, t = 2·439) and for ≈30°C compared to all other ranges (t test P≤0·021, t≥−2·536). Cercariae of mid-latitude species showed significant differences between ≈15 and ≈25°C (t test P = 0·007, t = 3·219) and also ≈20 and ≈25°C ranges (t test, P = 0·018, t = 2·737), but with only one study undertaken at ≈30°C no comparisons with this range were possible. Direct comparisons between the two latitudinal groups showed that differences in miracidial thermodynamics were only significant over the ≈20°C range, with elevated E* values in low-latitude species compared to the relatively stable values in the mid-latitude group (t test, P = 0·018, t = 2·630). For cercariae, comparisons of E* values between mid- and low-latitude species showed that only at the ≈25°C range were there significantly differences (t test, P = 0·001, t = 4·212) with mid-latitude species demonstrating a substantial decline in infectivity compared with the stability shown by low-latitude species.
Comparisons of the thermodynamics of low- and mid-latitude species of cercariae and miracidia showed that in general both larval stages had similar E* values over core temperature ranges, except for substantial differences in low-latitude species at ≈15°C (cercariae E* mean value 12·54, miracidia mean E* value 22·47) and ≈30°C (cercariae E* mean value −15·96, miracidia mean E* value 3·14) (t test, P = 0·017, t = −2·581). In mid-latitude species differences were apparent at ≈25°C (cercariae E* mean value −13·06, miracidia E* mean value −3·86), but were not significant due to a large degree of variation in these values. Nevertheless, this analysis must be treated with caution due to the natural bias of the datasets here.
However, when a comparison is made of the relative thermodynamics of both larval stages infecting only ectothermic hosts, E* values between cercariae and miracidia were significantly different over both ≈20 and ≈25°C ranges (t test P≤0·030, t≥−2·308). Miracidia generally demonstrate thermostability whilst cercarial values decline with increasing temperature, although no comparison at ≈30°C was possible due to only two ectothermic cercarial data sets being available at this range. In contrast, comparisons of cercariae that target ectothermic or endothermic hosts showed significant differences in E* values only over the ≈25°C range with infectivity in ectothermic target hosts substantially declining compared to the stability shown by cercariae targeting endothermic hosts (t test, P = 0·030, t = −2·329).
Metacercariae demonstrate profoundly different infection thermodynamics compared with miracidia and cercariae (Table 3, Fig. 1). Infectivity is almost uniformly at its highest at low temperatures, demonstrating a trend of slight or substantial decline over increasing temperatures up to approximately 20°C where a low level of infective stability is achieved. Metacercariae show a relatively poor level of infection success over typical optimal temperature ranges for miracidia and cercariae. Over core ranges between ≈15 and ≈25°C metacercariae demonstrate significantly different E* values from total cercarial (t test, P≤0·022, t≥−2·469) and miracidial values (t test, P≤0·003, t≥−3·487). At the ≈30°C range, metacercariae show some degree of low level infective stability with E* values still significantly different from total miracidial (t test, P = 0·019, t = −2·565) but not from total cercarial values (t test, P = 0·535, t = −0·634). Significantly different E* values also occurred between metacercariae and cercariae infecting only endothermic hosts at all ranges except for ≈30°C (t test, P≤0·009, t≥−2·961). A comparison between metacercarial infectivity with geographical distribution was not possible as only two studies were undertaken on mid-latitude species.
DISCUSSION
Trematode infectivity is an energy-dependent activity and is influenced by temperature in many ways. For all larval stages the source of energy is derived from stored glycogen, levels of which need to be sufficiently high to enable a successful infection. Glycogen levels in individual trematode larvae can demonstrate much variation associated with the physiological condition and larval retention in the source host (Maldonado and Acosta-Matienzo, Reference Maldonado and Acosta-Matienzo1948; Evans and Stirewalt, Reference Evans and Stirewalt1951; Ginetsinskaya, Reference Ginetsinskaya1988). These factors ultimately can result in unequal levels of infectivity from 1 day to the next (Evans and Stirewalt, Reference Evans and Stirewalt1951).
In addition, trematode infectivity depends on the physiological state and age/size of the target host, which may influence both its immune response and the structural integrity of its tegument (Ghandour and Webbe, Reference Ghandour and Webbe1973; Evans, Reference Evans1985; Ginetsinskaya, Reference Ginetsinskaya1988), and such host-related factors have been shown to influence trematode infection success in many experimental studies (Anderson et al. Reference Anderson, Whitfield and Dobson1978; Landis et al. Reference Landis, Kalbe, Reusch and Roth2012). Infectivity is therefore a complex activity influenced by a range of biotic factors that may predominate over abiotic factors such as temperature.
In the present analysis only a handful of studies were undertaken with marine species. However, both freshwater and marine organisms can potentially be exposed to the same basic range of diurnal temperatures, ranging from as much as 10–11°C or as little as 1–3°C dependent on individual habitat characteristics and thus demonstrate indistinguishable levels of physiological responses to comparable thermal changes (Vladimirova, Reference Vladimirova2000; Dell et al. Reference Dell, Pawar and Savage2011; Yvon-Durocher et al. Reference Yvon-Durocher, Caffrey, Cescatti, Dossena, Giorgio, Gasol, Montoya, Pumpanen, Staehr, Trimmer, Woodward and Allen2012). The present results are therefore equally applicable to both freshwater and marine environments.
Cercarial and miracidial infectivity
From the present analysis both cercariae and miracidia generally demonstrate optimal infectivity over core temperature ranges of ≈20°C for mid-latitude species and ≈25°C for low-latitude species in a similar manner to that established for survival (Morley, Reference Morley2011, Reference Morley2012). However, exceptions are apparent, and, in particular, the unusual cercarial thermodynamics of both S. bovis and Maritrema novaezealandensis may be associated with conditions found in their individual natural habitats or a characteristic associated with these individual species and have previously been considered to potentially reflect atypical seasonal or diurnal transmission windows (Morley, Reference Morley2011; Morley and Lewis, Reference Morley and Lewis2013). Thresholds of minimum temperature infectivity for cercariae and miracidia have rarely been investigated. From the limited available evidence, both types of larval stages are capable of infecting target hosts at very low temperatures, suggesting infectivity is relatively impervious to thermal conditions. However, transmission at these temperatures in the natural environment seems unlikely as other related temperature sensitive thresholds will dominate. For example, miracidia of P. microbothrium remain infective at temperatures as low as 1°C but hatching from the egg does not occur below 10°C (Samnaliev and Vassilev, Reference Samnaliev and Vassilev1976, Reference Samnaliev and Vassilev1979). Similar minimum temperature thresholds for cercarial emergence also exist (Morley and Lewis, Reference Morley and Lewis2013). Thus, where minimum temperature infection thresholds have been determined e.g. E. recurvatum cercariae (Morley et al. Reference Morley, Adam and Lewis2007), they are likely to be entirely due to negative responses of the target host to low temperatures.
Nevertheless, there is some degree of difference in the thermodynamics of cercarial and miracidial infectivity over the same temperature ranges, particularly when cercariae infecting only ectothermic hosts are considered. Miracidia demonstrate greater infection thermostability than cercariae, reflecting similarity in their survival characteristics (Morley, Reference Morley2012), suggesting that for both parameters higher utilization of glycogen in cercariae reduces their viability at a faster rate as temperatures increase. Although swimming activity for both life stages increases at elevated temperatures (Wilson and Denison, Reference Wilson and Denison1970; Rea and Irwin, Reference Rea and Irwin1995), it remains to be determined if cercarial activity is disproportionately changed or another factor is responsible. Thus, the reasons for these differences remain unknown but indicate that cercarial stages are more vulnerable to thermal changes than miracidia and may prove to be the weaker link in the life cycle under climate change.
Mid- and low-latitude species of both miracidia and cercariae demonstrate different thermodynamics over increasing temperature ranges. For low-latitude miracidia there is greater and more consistent sensitivity to increasing temperature than for mid-latitude species, which have a highly variable but generally low sensitivity to thermal changes. These differences either reflect the narrower range of temperatures experienced at low latitudes, or that the majority of examples are from schistosome–pulmonate mollusc combinations providing a more uniform set of results. Certainly the relative standard metabolism of molluscs from different latitudes suggests a lack of common thermal relationships with specific climatic zones but instead reflects those conditions found in individual habitats (Vladimirova, Reference Vladimirova2000; Vladimirova et al. Reference Vladimirova, Kleimenov and Radzinskaya2003), which may influence their suitability as target hosts.
Cercarial infectivity in contrast is more inconsistent. Low-latitude species demonstrate few differences in infectivity between ranges ≈20 and ≈15°C or ≈25°C, and such stability may be associated with the majority of these species used in this analysis targeting endothermic hosts rather than environmental conditions. Similarly, mid-latitude species predominantly target ectothermic hosts with decreasing levels of infectivity between ≈20 and ≈25°C reflecting physiological responses of these hosts to rising temperatures. Differences in direct comparisons between cercarial mid and low-latitude species over ≈25°C range may also reflect a bias in the data set and is mirrored by direct differences in the cercarial infectivity of ectothermic and endothermic hosts at this temperature range. On the other hand, differences between miracidial latitudinal groups at the ≈20°C range are more likely to be associated with the host or parasite thermodynamics.
Strain specific differences in the thermodynamics of infection are apparent in both cercariae and miracidia, not only ranging from slight to substantial over core temperature ranges, but also from thermostability to pronounced increases or decreases in infectivity. These differences appear to be more distinct in cercariae than miracidia and may reflect the wide-ranging climatic conditions to which cercariae are exposed to whilst developing in molluscan hosts.
The large degree of thermostability demonstrated by the survival of miracidia and cercariae and also emergence of cercariae (Morley, Reference Morley2011, Reference Morley2012; Morley and Lewis, Reference Morley and Lewis2013) supports the idea that trematodes are highly resistant to temperature fluctuations and hence variations in infectivity are likely to be associated with other factors. Uniform and readily identifiable patterns of thermal responses in the survival of miracidia and cercariae, especially over core temperature ranges are related to the rate of glycogen utilization (Morley, Reference Morley2011, Reference Morley2012), which is also a major factor for infectivity. Thus, the thermodynamics of glycogen utilization should closely reflect larval survival. That this is not always the case may be unrelated to parasite metabolism, instead reflecting either the physiological and behavioural responses of target hosts to specific temperatures, or compatibility of host–trematode associations, or even different experimental protocols used in the laboratory.
Similarly, cercariae targeting ecto- or endothermic hosts demonstrate divergent thermodynamics over higher temperature ranges. As the success of infectivity declines in ectothermic hosts but remains unchanged in endotherms this suggests that elevated temperatures are unsuitable for trematode establishment in ectotherms. Ectothermic hosts are likely to have a greater intolerance to high temperatures, demonstrating higher mortality levels and disrupted physiological and behavioural homoeostasis as they exceed the limits of their more restricted thermal optima. Undoubtedly the lack of infectivity studies with ectotherms at the range of ≈30°C suggests their reduced ability to act as viable hosts under these temperatures during experimental protocols (Lo, Reference Lo1972; Upatham, Reference Upatham1973). This further supports the view that host susceptibility is the key variable controlling the thermodynamics of trematode establishment in hosts. Nevertheless, ectothermic hosts may adapt to prolonged periods of high temperatures, with a corresponding shift in their thermal optima, and thus susceptibility parameters under these conditions may, in time, ultimately reflect present lower temperature optimal infectivity dynamics.
Metacercairal infectivity
Unlike cercariae and miracidia, optimal infectivity of metacercariae occurs at low temperatures, and then declines at a species-dependent rate as temperatures rise to values typically found under summer conditions. Such a thermal response is related to temperature-dependent metacercarial metabolism and the rate such activity drains the glycogen reserves. At room temperature a reduction in metabolism occurs with age of metacercariae, associated with declining levels of glycogen (Humiczewska, Reference Humiczewska2004). A similar effect is likely to occur with the recently encysted metacercariae used in the present studies over varying temperatures coinciding with an increase or decrease in basal metabolism. Once glycogen levels fall below a given threshold, successful establishment within the target host is unlikely. Thus, under typical summer temperatures when cercariae and miracidia display optimal levels of infectivity, metacercarial infectivity is minimal. This may not necessarily be detrimental because under these conditions maximal cercarial emergence and survival/infectivity will result in the continued production of large numbers of viable if short-lived metacercariae. Therefore, metacercariae appear best-adapted to maintain viable parasites in habitats when temperatures are too low to allow miracidia or cercariae to function optimally and their target hosts may remain unavailable. Nevertheless, all the hosts from the present analysis were endothermic and it is possible that the thermodynamic responses of metacercariae targeting ectothermic hosts may be different from those documented here.
Experimental methodologies and acclimation
Variation in methodologies of experimental infection may influence the success rate of trematode establishment and make comparisons between individual studies difficult to assess (Poulin, Reference Poulin2010a , Reference Poulin b ). However, in the present analysis it is the thermodynamic relationship over temperature ranges of each individual study rather than direct comparisons of relative infection success that is being measured, and hence variations in methodologies are likely to be less influential. Nevertheless, other factors important to experimental thermal biology do come in to play. In particular acclimation has already been shown to have an important role in cercarial emergence (Morley and Lewis, Reference Morley and Lewis2013).
Acclimation remains a cornerstone in studies on thermal biology, to ensure disturbances caused by introducing organisms to new conditions are minimized (Precht et al. Reference Precht, Laudien, Havsteen, Precht, Christophersen, Hensel and Larcher1973). It has been found to occupy a key role in the thermodynamics of cercarial emergence where poorly or non-acclimated studies generated false positive results (Morley and Lewis, Reference Morley and Lewis2013) and was a significant factor influencing cercarial infectivity in the study of Studer and Poulin (Reference Studer and Poulin2014). Unfortunately, acclimation has been inconsistently applied in temperature studies on infectivity of the present analysis with periods of acclimation for target hosts ranging from zero to a few days. The extent of acclimation required may be dependent on the type of target hosts (ectothermic or endothermic) within the life cycle. As all endotherms in the present analysis are terrestrial mammals, whose contact with infective trematode larvae occurs via partial immersion in water or consumption of aquatic animals harbouring metacercariae, the degree of host acclimation required is questionable. Nevertheless, the relationship between endotherms and their parasites can be influenced by hot or cold conditions which alter their endocrine and immune status thereby influencing host–parasite dynamics (Morley and Lewis, Reference Morley and Lewis2014). Under natural conditions terrestrial mammals would be acclimatized to ambient air temperatures that are close to water temperatures. The same may not be true for endotherms under experimental conditions. For example, blood flow to peripheral vessels of the skin can be increased or decreased under exposure to localized temperature changes (Marples, Reference Marples1965) as may occur in certain experimental parasite-exposure protocols, potentially influencing initial cercarial penetration and migration and ultimately parasites establishment.
The degree of acclimation necessary for these experimental studies remains to be determined. Certainly thermal acclimation periods for molluscan respiration take at least 2–3 days, although some littoral molluscs naturally subjected to frequent and abrupt changes in temperature require almost no acclimation (Vladimirova, Reference Vladimirova2000). On the other hand, thermal shock studies on snail susceptibility to miracidia suggest an acclimation period in excess of 4 h is necessary (Ittiprasert and Knight, Reference Ittiprasert and Knight2012).
Furthermore, post-exposure maintenance temperature may also influence results, especially when target hosts are returned to room temperature conditions following exposure to infective larval stages. If such experimental procedures influence infectivity success the validity of these protocols to reflect parasite viability in the natural environment requires further investigation.
Both host species and size can influence the thermodynamics of cercarial and miracidial infectivity creating a complex pattern of results. Certain host species appear more susceptible to trematode establishment with increasing temperatures. DeWitt (Reference DeWitt1955) found that the length of time of the association between individual host and parasite strains in the laboratory appear to influence the compatibility of the temperature-associated relationship, which in turn resulted in increased thermostability after a 6-year period. This complexity is eloquently illustrated by the work of McKindsey and McLaughlin (Reference McKindsey and McLaughlin1995) on Cyclocoelum mutabile miracidia undertaken over a narrow temperature range of 6°C. Yet with such a uniform experimental approach, the multifaceted influences of various species and sizes of target host on infectivity were evident, thus highlighting the difficulties of making generalities on temperature effects all too obvious.
Concluding remarks
For the purpose of creating predictive frameworks of trematode transmission dynamics under climate change, the variable thermodynamics of infectivity demonstrated in the present study raises a number of issues. If the responses of infectivity to temperature remain unreliable on a broad scale should this variable be included in any predictions? As this is the last link in the chain of events that takes trematode larvae from one host to another the question remains as to whether infectivity is the least or most important parameter influencing transmission success. It is therefore as a first step necessary to be able to rank in importance each link in the chain that forms transmission and to determine if this rank holds true for all species and trematode life history stages. It has already been determined in general that cercarial development, emergence and survival and miracidial survival are poorly influenced by temperature over optimum temperature ranges (Morley, Reference Morley2011, Reference Morley2012; Morley and Lewis, Reference Morley and Lewis2013), although other parameters have yet to be properly assessed. Nevertheless, a few exceptions to these general trends do occur. Although representing only a small minority, these outliers are of incredible interest and require further study to determine the mechanisms of their contrasting thermodynamics. It is possible that with more standardization of experimental protocols, general patterns of trematode infectivity under the influence of temperature may become discernible. Such an approach would require large-scale infectivity experiments on larval trematodes and their target hosts, but this may not be practically possible or ethically desirable.
The present study suggests that temperature, although capable of influencing successful trematode infections, is overall not a prime variable in determining the viability of transmission and that variation in infectivity may be associated with thermal effects on target host and other factors rather than direct effects of temperature on the larval trematodes. It is more likely that the levels of compatibility between host and parasite, particularly host susceptibility, relative to species and age, will determine infectivity and any influences of temperature may be masked by these more dominant host factors. Therefore, temperature appears to have a limited direct effect on trematode infectivity and that variation in host susceptibility will determine any changes in parasite establishment under different thermal regimes.