I. INTRODUCTION
Numerous articles have reported on growth of tantalum pentoxide (Ta2O5) thin films and their charge transport mechanisms in metal–insulator–semiconductor (MIS)Reference Atanassova and Paskaleva1–Reference Wang, Lin, Chen and Lin4 and metal–insulator–metal (MIM)Reference Ezhilvalavan and Tseng5, Reference Ezhilvalavan and Tseng6 configurations. In all these articles, the Ta2O5 films have been fabricated with various techniques such as chemical vapor deposition, physical vapor deposition, and anodization. Tantalum oxide films in both MIS and MIM configurations have defects that influence the electrical properties of the films. For example, they have variations in the interfacial charge densities at the Si/Ta2O5 interface and high dielectric loss and leakage current density due to Si diffusion and Si oxidation at high temperatures.Reference Dimitrova, Arshak and Atanassova7–Reference Chen, Nielsen, Rymaszewski and Lu9 Thin Ta2O5 MIM films processed under different gas-ambient conditionsReference Kerrec, Devilliers, Groult and Marcus10, Reference Atanassova, Tyuliev, Paskaleva, Spassov and Kostov11 demonstrate increase in relative permittivity with increasing annealing temperature. Ezhilvalavan et al.Reference Ezhilvalavan and Tseng12 and Pignolet et al.Reference Pignolet, Mohan Rao and Krupanidhi13 measured relative permittivity >50, which exceeds the theoretically predicted value of 40 for β tantalum oxide.Reference Andreoni and Pignedoli14–Reference Shibata16 Such high relative permittivity was attributed to the movement of tantalum cations across the sampleReference Pavlovic17 analogous to tantalum anodization under high fields.Reference Verkerk, Winkel and de Groot18 Other defects such as oxygen vacanciesReference Kimura, Mizuki, Kamiyama and Suzuki19–Reference Lau, Leong, Han and Sandler20 and their accumulation near grain boundaries and film–electrode interfaces may also be responsible for such high polarization response. A comprehensive understanding of the point defect and microstructural origins of high permittivity and dielectric loss values in tantalum oxide films is still lacking.
Microstructural features such as grains, grain boundaries, and electrode–insulator interfaces potentially contribute to the dielectric polarization with independent relaxation time constants (τ = ρε) due to their unique resistance (or resistivity, ρ) and capacitance (or permittivity, ε) values. Linking frequency-dependent impedance behavior to film microstructure is essential for understanding the role of interfaces and intragrain impedances on the overall dielectric relaxation of amorphous and polycrystalline Ta2O5 films.
In general, film microstructure is controlled by deposition process, substrate chemistry, and morphology. Plasma-enhanced chemical vapor deposition (PECVD) is a common fabrication technique for amorphous oxide films in MIS structures.Reference Kim, Ahn, Cho, Ahn, Lee, Chun and Lee21 Crystallization occurs in PECVD tantalum oxide films treated above the temperature of 700 °C. In addition, significant interdiffusion between the oxide film and the silicon substrates occurs at high temperatures and the electrical properties are dominated by the Si–Ta–O interfacial layer.Reference Jeon, Han and Park22 Anodization processes can be used to process amorphous Al2O3, Ta2O5, and Nb2O5 oxide layers with thicknesses of ∼100 nm.Reference Lohrengel23 Microcrystalline regions in anodized films are sparsely distributed across the area; the crystalline regions preferentially grow at grain boundaries of the anodized metal substrate. In fact, the crystalline regions are known to control important electrical properties such as dielectric breakdown; however, the overall volume fraction is insufficient to gain a significant understanding of the electrical properties of the crystalline phase.Reference Leach and Pearson24 On the other hand, sol–gel-derived crystallized Ta2O5 films above 700 °C exhibit multigrain dense microstructure; however, the properties are mainly controlled by residual carbon content inside the films.Reference Ohishi, Maekawa and Katoh25 Sputtered tantalum oxide films offer the opportunity to create micron-thick oxide films in which the grain boundary interface impedance is small in comparison to the bulk impedance. In this study, a thorough scientific investigation of the dielectric relaxation properties of pulsed-DC sputter-processed thick amorphous and polycrystalline Ta2O5 films with Pt electrodes was conducted using dielectric impedance spectroscopy.
II. EXPERIMENTAL PROCEDURE
Tantalum oxide thin films were prepared using pulsed-DC-reactive magnetron sputtering and were deposited on 150-nm-thick Pt-coated Si (with 10-nm-thick TiO2 and 1000-nm-thick SiO2 as intermediate adhesive layers) substrates. A 75-mm diameter, 99.5% pure tantalum target was used for sputtering. Before deposition, the vacuum chamber was evacuated to the base pressure of ∼1 × 10⁻⁴ Pa using a turbomolecular pump. In addition, the target was presputtered at a source power of 50 W for 5 min in an ultrapure Ar (99.99%) atmosphere at 0.7 Pa with the substrate kept shielded. A pressure of 3.3 Pa was maintained during film deposition by introducing 15 sccm of ultrapure O2 (99.99%) into the chamber using a standard mass flow controller (MKS, Andover, MA). This flow rate was selected so that the sputtering was in the reactive mode and did not produce oxygen-deficient films. The cathode voltage and partial pressure of O2 were controlled through the flow rate of O2.Reference Sethi, Sunal, Horn and Lanagan26 Thin films of tantalum oxide were deposited at 400 W for 60 min. The prepared films were stoichiometric with the O:Ta atomic percentage ratio of 72:28 as determined by EDX analysis. The estimated deposition rate was 27 nm/min. The substrate temperature was monitored during deposition using a shielded K-type thermocouple and was fixed at 115 °C.
The as-deposited tantalum oxide films were heat-treated in a Rapid Thermal Annealer (A.G. Associates, San Jose, CA) at temperatures between 600 and 800 °C for 1 min in an open atmosphere. The crystallinity of the films was characterized by grazing angle x-ray diffraction (Scintag, Cupertino, CA, XDS 2000) using Cu Kα radiation. To determine the lower bound of crystallite size, the X of the crystalline films was calculated using the Scherrer formulaReference Cullity27  where X is the mean size of the ordered crystalline domain, B is the diffraction peak’s full width at half maximum, k is the shape factor (=0.85), λ is the x-ray wavelength, and θ/2 is the Bragg diffraction angle. Peak broadening was corrected for the instrumental broadening by using an instrument standard NIST Si 640 (NIST, Gaithersburg, MD).
The cross section of the Ta2O5 films was examined by transmission electron microscopy (TEM) to evaluate microstructural features in the films. The cross-sectional TEM samples were prepared by mechanical polishing to 20–30-μm thickness, followed by ion milling at low temperature to perforation. In addition, morphology of the film surface and structure of as-deposited and rapid thermal-annealed films were studied with a field-emission scanning electron microscope (FE-SEM).
A set of 2-mm-diameter circular Pt electrodes (∼150-nm thick) was sputtered onto the tantalum oxide films using a shadow mask for electrical characterization in the MIM configuration. Subsequently, all films were annealed at 550 °C for 1 h to improve the top electrode–oxide contact interface. Impedance spectroscopy was performed on the capacitors from 20 Hz to 1 MHz using an HP4284A LCR meter (Agilent Technologies, Santa Clara, CA) at various fixed temperatures between 25 °C and 250 °C. In addition, for low-frequency (LF) (15 mHz–1 kHz) and high-temperature (190–260 °C) impedance measurements, an HP3562A dynamic analyzer (Agilent Technologies, Santa Clara, CA) was used. Equivalent circuit modeling of the impedance data using resistor (R), capacitor (C), and constant phase element (CPE) circuit elements was performed using Zview software to investigate the relaxation phenomena in these films.
III. RESULTS AND DISCUSSION
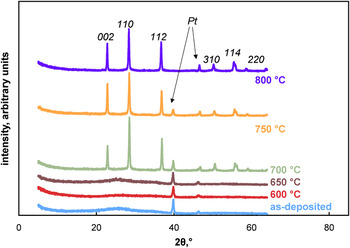
X-ray diffraction results shown in Fig. 1 indicate that Ta2O5 film crystallization occurs above 650 °C.Reference Beckage, Knorr, Wu, Lu and Rymaszewski28 At lower annealing temperatures (≤650 °C), these films possess a typical amorphous hump between 2Θ angle of 20° and 30°. The x-ray diffraction patterns of films annealed above 650 °C were indexed to the orthorhombic β Ta2O5 phase (JCPDS #97-007-5335). The crystallite dimension (calculated from the XRD data) is independent of annealing temperature, and the dimensions were 39.2, 39.4, and 41.6 nm (with an error of ±10%) for the films annealed at 700, 750, and 800 °C, respectively.
X-ray diffraction patterns of as-deposited and annealed Ta2O5 films deposited on Pt-coated Si substrates. All peaks were indexed to the β Ta2O5 phase. The Pt peaks appear on the samples due to Pt top electrodes. (color online)

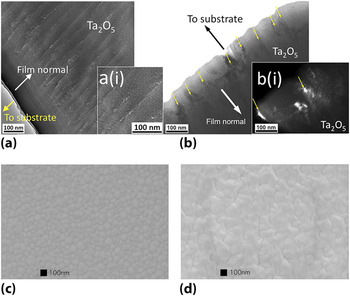
TEM examination of the microstructure shows that both the amorphous film [represented by 600 °C annealed film, Fig. 2(a)] and the polycrystalline film [represented by 700 °C annealed film, Fig. 2(b)] possess columnar morphologies, with columns parallel to film normal direction. Each column was surrounded by low-density volume that consists of clusters of the voids, resulting in the formation of low-density “interfaces” between columns. Bales and ZangwillReference Bales and Zangwill29 have explained the growth mechanism in detail to account for low-density volumes between columns in amorphous films. Consequently, the interfaces between the columns show brighter contrast than the area within the columns in TEM image [Fig. 2(a)]. The film morphology follows the structure zone model.Reference Thornton30 The columnar structure of the as-deposited amorphous film is preserved during annealing and crystallization as shown in FE-SEM images [Figs. 2(c) and 2(d)]. In TEM images of film annealed at 700 °C [Fig. 2(b)], the columnar morphology of the polycrystalline films is exhibited by the periodical dark contrasts in bright field (BF) image [marked by the parallel small yellow arrows in Fig. 2(b)] and bright contrasts in dark field (DF) image [marked by the arrows in the inset Fig. 2b(i)]. It appears that residual amorphous structure (examined in BF and DF images) still exists between the columns, which is confirmed by electron diffraction pattern (not shown here). The amorphous regions in both the amorphous (600 °C) and the polycrystalline (700 °C) films have the “medium range order” microstructure, i.e., a paracrystalline structure, as was shown in the previous work for the amorphous Ta2O5 filmsReference Sethi, Olszta, Li, Sloppy, Horn, Dickey and Lanagan31 examined by the fluctuation electron microscopy.Reference Treacy and Gibson32–Reference Voyles, Treacy and Gibson34 The crystallite sizes obtained through XRD (using Scherrer’s formula stated earlier) for all polycrystalline films are in agreement with the FE-SEM top–down microstructures shown in Figs. 2(c) and 2(d). These physical observations were used to develop a circuit model to explain the material behavior.
Transmission electron microscope images of films annealed at (a) 600 °C, bright field (BF) image with inset [a(i)] showing higher magnification and (b) 700 °C, BF image with inset showing dark field image. Also shown are the top–down FE-SEM images of the same films annealed at (c) 600 °C and (d) 700 °C. (color online)

Table I summarizes the small-signal permittivity, loss, and AC conductivity at 1 kHz of as-deposited and annealed Ta2O5 films measured at 35 °C. Annealing of films increased the permittivity with increase in temperature up to 51 °C (at 1 kHz) for 800 °C-annealed samples. The permittivity of the films crystallized at 800 °C is consistent with the earlier report.Reference Ezhilvalavan and Tseng12 Both the dielectric loss and conductivity measured at 35 °C exhibited a similar trend as permittivity with annealing temperature. These trends were found to be consistent in the frequency range of 20 Hz–1 MHz (not shown here).
Permittivity, dielectric loss, and conductivity at 1 kHz of as-deposited and annealed Ta2O5 thin films measured at 35 °C.

All films were annealed at 550 °C after top electrode deposition.
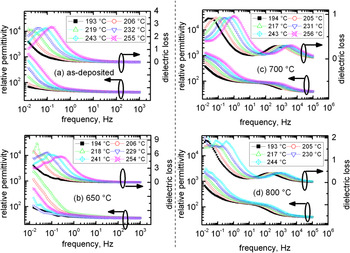
The dielectric dispersion studies at various temperatures indicated that both as-deposited and annealed films exhibited a dielectric loss peak in the sub-hertz range (defined as LF) in the temperature range of 193–255 °C as shown in Fig. 3. Appearance of such dielectric loss maxima signifies either a relaxation phenomenon related to localized charge transport or dipolar reorientations. The dipolar contribution and charge transport such as hopping in a potential well with steep barriers are localized and do not contribute to the DC conductivity.Reference Bottcher and Bordewijk35 In addition, loss peaks shifted towards higher frequency with an increase of measurement temperature, indicating shorter relaxation time constants due to larger thermal excitation. The polycrystalline films annealed at temperatures above 650 °C show an additional dielectric loss peak at around 1 kHz (defined as high frequency, HF), which can be seen in Figs. 3(c) and 3(d). Furthermore, variation of the real part of permittivity with frequency in the crystallized samples was shown to have distinct plateau at HF, with permittivity approaching 100 between the HF and LF regions.
Dielectric permittivity and loss tangent of (a) as-deposited and annealed tantalum oxide films at (b) 600 °C, (c) 700 °C, (d) 800 °C as a function of frequency and temperature. (color online)

Presence of multiple peaks in the frequency response of dielectric loss indicates that the sample can be modeled as an assemblage of electroactive elements with different relaxation time constants (different RC values). For multiple relaxation peaks, a single relaxation process, represented by a discrete or distributed Debye-type response, could not give a complete description of the overall relaxation phenomenon of the dielectric films.Reference Jonscher36 Both LF and HF peak values in the complex permittivity formulation as a function of temperature follow the Arrhenius law:

where ω p is the peak relaxation frequency, ω 0 is the pre-exponent frequency factor (∼1012–1013 Hz), E a is the activation energy, k is Boltzmann’s constant, and T is the temperature. The activation energy for LF mechanism was found to be between 1.14 and 1.44 eV, with the pre-exponent factors close to phonon frequency of ∼1012 Hz. However, the activation energy and pre-exponent factors for HF mechanism for the crystallized samples were between 0.71 and 0.74 eV and 109 and 1010 Hz, respectively. No statistically significant variation occurs in the activation energy of polycrystalline films for the HF relaxation with the change in annealing temperature. In some cases, these multiple peaks are associated with the excitation process of charge carriers of different trap sites.Reference Kutty and Ezhilvalavan37
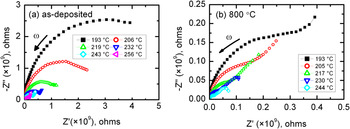
Figure 4 shows the complex impedance for the amorphous and polycrystalline films represented by as-deposited and 800 °C-annealed films, respectively. Both exhibit broad peaks with asymmetric arcs signifying either a non-Debye-type relaxation or Debye-type relaxation with the distributed relaxation time behavior. There is a significant change in the impedance spectra after crystallization, with the overall impedance decreasing significantly.
Complex impedance of (a) as-deposited and (b) 800 °C-annealed Ta2O5 films as a function of frequency and temperature in the range of 190–255 °C. (color online)

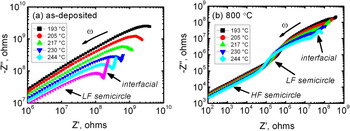
Different regions of the complex impedance spectra can be separated in the log–log complex impedance plot as shown in Fig. 5. The impedance response in the amorphous films can be seen as a combination of two semicircles with only a tail of second semicircle observed at high temperature. This semicircle can potentially be the response of interfacial polarization. A new semicircle at low impedance becomes evident upon postcrystallization at 800 °C as seen in Fig. 5. It should be noted that the axes scales in Figs. 5(a) and 5(b) are different. Interestingly, for the LF semicircle, the impedance spectrum remained unchanged in the frequency domain and the activation energy was independent of the electrode material for the samples with gold (work function is 5.1 eV) and platinum electrodes (work function is 6.35 eV). A non-ohmic electrode interface with the defect-pinned Fermi level may explain this result.Reference Jõgi38 In addition, the high-field leakage current density was found to be independent of the voltage polarity in these films, and thus the frequency diverging partially visible arc (Fig. 5) could be due to interfaces within the sample and/or film–electrode interface. The impedance plots for the crystallized films exhibited three semicircles: one each for the grains, grain boundaries, and film–electrode interfaces, where the latter is partially observed. Close observation of the complex impedance plots confirmed that the LF regime peaks of the amorphous films were consistent with the peak frequency maxima of grain boundaries in well-crystallized films. On the basis of these observations, the LF regime peaks in the amorphous films could be due to paracrystalline grain boundaries representing the residual amorphous phase in the polycrystalline material and the bulk phase in the amorphous material as mentioned before. The high activation energy of ∼1 eV for LF regime suggests that charge migration is due to oxygen vacancy. In fact, the LF regime activation energies were found to be close to oxygen vacancy migration energy (∼1.0–1.2 eV)Reference Ramprasad39 through grain boundaries as is evident from other oxide systems.Reference Lau, Leong, Han and Sandler20, Reference Saraf, Wang, Shutthanandan, Zhang, Marina, Baer, Thevuthasan, Nachimuthu and Lindle40, Reference Yang, Lian, Dickey, Randall, Barber, Pinceloup, Henderson, Hill, Beeson and Skamser41
Complex impedance in a log–log plot for (a) as-deposited amorphous and (b) 800 °C-annealed polycrystalline Ta2O5 films. (color online)

To better assess the role of different microstructural features in terms of their contributions to dielectric properties in the tantalum oxide thin films, complex impedance was further analyzed. An equivalent circuit model was utilized to separate the bulk and interfacial impedance contributions and to address the overall relaxation behavior within these films. It was determined that the frequency-dependent impedance (Z CPE) elements are useful to characterize our films. The impedance of the CPEs can be expressed as

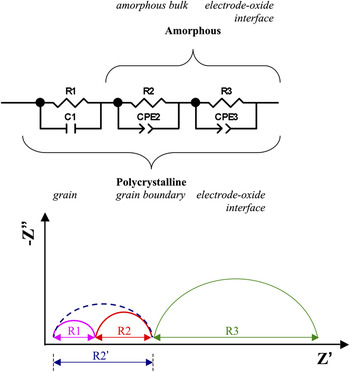
where ω is the frequency, T is a scale coefficient, and the power index p varies in the range of −1 < p < 1. A consequence of this simple equation is that the phase angle of the CPE impedance is independent of the frequency and has a value of −(90p) degrees. When p equals to 0, 1, and −1, CPE represents an ideal resistor, capacitor, and inductor, respectively. Circuit modeling of impedance revealed that the amorphous films can be modeled as a series combination of two parallel R–CPEs, whereas the polycrystalline films consisted of a series combination of two parallel R–CPEs and a parallel R–C as shown in Fig. 6. Thus, the specific circuit elements for the polycrystalline films are R1–C1, R2–CPE2, and R3–CPE3 and those for the amorphous films are R2–CPE2 and R3–CPE3. Remnants of the columnar microstructure were found in the crystalline films; however, the columnar boundaries become discontinuous with crystallization. The grain boundaries of the crystallized films were represented with series circuit elements with respect to the grains and interface.
Equivalent circuit of amorphous and polycrystalline Ta2O5 films with the corresponding complex impedance plot. (color online)

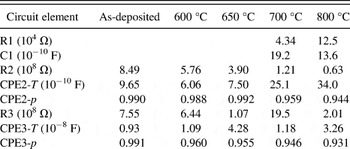
The impedance responses of the as-deposited and annealed films were modeled and analyzed using these equivalent circuits and Z plot curve-fitting routines. In the equivalent circuit shown in Fig. 6, it was found that the capacitance C1 ranges over a few nF, CPE2-T is in the range of hundreds of pF, and CPE3-T is in the range of tens of nF, as listed in Table II. CPE-T is the scale coefficient of a CPE as defined in Eq. (2). The circuit models presented here are representative of the sample, even though many combinations are possible. We have chosen the one that was given in the data set with minimum errors and correlates with the observed microstructure. Duggan et al.Reference Duggan, Saito and Niwa42 also found a similar parallel circuit model for RF-sputtered tantalum oxide films. The quality of the circuit model fit is determined through coefficient of determination. The coefficients of determination (R 2) for the fits at different annealing temperatures shown in the table are between 93% and 98%, indicating that the fits are reasonable.
Electrical circuit elements for the equivalent circuit of Ta2O5 films studied in this work at 219 °C.

CPE-T and CPE-p are the scale coefficient and power index of a CPE, respectively, as defined in Eq. (2). R 2 is the coefficient of determination for the fit data.
In many of the polycrystalline materials, in particular negative temperature coefficient of resistance (NTCR) materials, the interfaces exhibit higher capacitance values because of smaller thickness and lower resistances attributed to the accumulation of defect/trap sites in their vicinity.Reference Abram, Sinclair and West43 In general, high capacitances greater than tens of nF correspond to electrode–film interface. The capacitance of a grain in NTCR materials is generally lower than that of a grain boundary and corresponds to HF arc in the complex impedance plot, whereas the grain boundary exhibits an LF arc. Thus, in the case of the amorphous films, fitted capacitance values suggest that the CPE2 corresponds to the amorphous bulk and CPE3 corresponds to the electrode–film interface. These modeling parameters in turn indicate that the impedance response is dominated by the electrode–oxide interface at LF, whereas it is controlled by the film-bulk contribution in the amorphous samples in HF regime. In the case of the polycrystalline films, a brick wall model can be assumed in series with electrodes and in such cases the bulk response C1 and CPE2 would correspond to grain and grain boundary, respectively. The capacitance of a grain is generally lower than that of a grain boundary and corresponds to HF arc in the complex impedance plot, whereas the grain boundary exhibits an LF arc. The equilibration of defects is more complete in the grain boundary region than in the grain region, which further justifies the use of a CPE for the grain and a C for the grain boundary. The CPEs take into account property gradients in the thin film structure.Reference Jonscher44–Reference Morrison, Jung and Scott45 Significant increase in the CPE2-T (Table II) is observed with increase in annealing temperature of the films, suggesting a decrease in grain boundary thickness and corresponding increase in the grain size. The power indices of most of the CPEs in these circuits were above 0.9, and such power law dependence of AC conductivity (σ∝ωn), where ω is the frequency and n is the power exponent, is typical of disordered materials. The power exponents (CPE-p) were found to be equal to ∼0.98 and 0.91 for the amorphous and polycrystalline films, respectively. Both were found to be within the same range of CPE power indices.
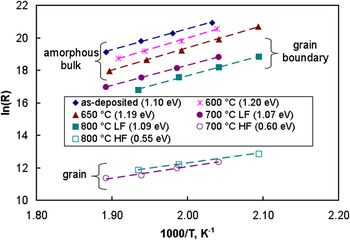
The activation energies from complex impedance can be correlated with the activation energy of the charge carriers within the grains, grain boundaries, and amorphous bulk. Resistances were calculated as a function of measured temperatures from the fit of the semicircles corresponding to each of these relaxation mechanisms. The intercepts on the real axis of the complex impedance semicircles were taken as resistances of various electroactive microstructural features in the films, and the associated annealing temperature-dependent activation energies were calculated using Eq. (3).

where R is the resistance, R 0 is a constant, E a is the activation energy, k is the Boltzmann constant, and T is the absolute temperature. Figure 7 shows the variation of resistance as a function of temperature for as-deposited and annealed films. All resistance contributions show a negative temperature coefficient for resistance. In the case of polycrystalline samples, an insignificant change in the above activation energy was observed, indicating the same conduction mechanism for different annealing temperatures. Overall, the amorphous film and crystalline grain boundary resistances were found to decrease with an increase in the annealing temperature. This is speculated to be either due to the formation of more porous grain boundaries as grains densified at higher annealing temperatures or to the improvement in the crystallinity at higher annealing temperatures, as shown by XRD. The reduction in resistances as a function of annealing temperature was consistent with the high-field leakage current measurements (not shown here).
Variation of amorphous bulk and crystalline grain boundary and grain resistances (R s) with temperature (T) for Ta2O5 films. The values in brackets in the legend are the activation energies. (color online)

The grain resistances in polycrystalline Ta2O5 films possess an activation energy of ∼0.55 eV. Previously, it has been suggested that the grain conduction could be due to electronic transport because the oxygen vacancies are electronically compensated.Reference McHale and Filler46 Electronic compensation can happen via the variations in Ta oxidation states between Ta4+ and Ta5+. Thus both electronic transport and oxygen vacancy charge migration potentially exist in the case of polycrystalline films annealed at and above 700 °C, whereas only oxygen vacancy charge migration is observed in the amorphous films. As oxygen vacancy charge movement controls the overall film resistance for polycrystalline films, it appears that the electronic transport is in the noncontinuous phase, namely the grains.
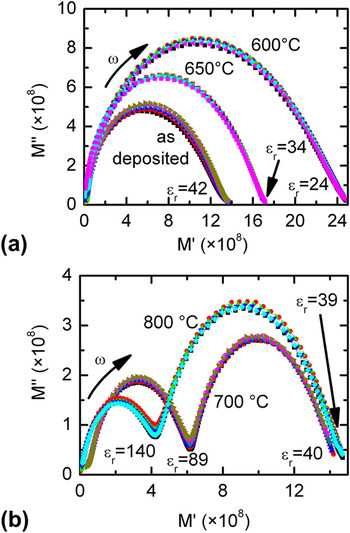
The information about modulus responses for different electroactive features in the films was extracted using complex M* plots as M* ∝ 1/C*. The linear relationship between the capacitance, C*, and electric modulus, M*, in the complex plane is stated in Eq. (4).Reference Kyritsis, Pissi and Grammatikakis47

where C′ and C″ are the real and imaginary parts of capacitance and M′ and M″ are real and imaginary parts of electric modulus, respectively. Thus the intercept of the complex modulus on the real axis corresponds to 1/C′. Figures 8(a) and 8(b) show the complex electric modulus for the amorphous and polycrystalline Ta2O5 films. The diameter of the semicircle shown in Fig. 8(a) corresponds to the inverse of the real part of permittivity of the amorphous phase. In Fig. 8(b), the right semicircle corresponds to M′ of the crystalline grain and left semicircle corresponds to M′ of the grain boundary. Permittivity values were calculated using the semicircle diameters and geometrical factors of the samples and are also shown in Fig. 8. It can be seen that a significant contribution from the grain boundaries enhances the overall relative permittivity even though the bulk grain permittivity has little variation in crystallized samples. Earlier reports indicated that overall relative permittivity in tantalum oxide films could reach as high as 50 with high temperature annealing.Reference Ezhilvalavan and Tseng12, Reference Pignolet, Mohan Rao and Krupanidhi13 The current investigation illustrates that the grain permittivity in polycrystalline tantalum oxide films is consistent with the established value for the β crystalline phase of Ta2O5.Reference Andreoni and Pignedoli14, Reference Shannon48 Significant variations in the grain boundary interfaces are responsible for such large permittivity values (Table I).
Complex electric modulus of (a) amorphous and (b) polycrystalline Ta2O5 films as a function of frequency and temperature in the range of 190–255 °C. (color online)

IV. CONCLUSIONS
Amorphous and crystalline Ta2O5 films were prepared with pulsed-DC reactive magnetron sputtering. Annealing studies indicated that high-temperature heat treatment (>650 °C) induced the equilibrium polycrystalline phase (β crystalline phase) in tantalum oxide films. Dielectric relaxation as a function of annealing conditions showed that the apparent increase in relative permittivity with increase in annealing temperature is not a bulk property of tantalum oxide. Other contributions such as grain boundaries and/or film electrode interfaces were responsible for apparent rise of relative permittivity in high-temperature crystallized samples (>650 °C). In this study, we found that the bulk grain relative permittivity is close to the theoretical relative permittivity of β crystalline phase of Ta2O5. Furthermore, two types of relaxation mechanisms were found in these films as a function of annealing conditions. Dielectric and impedance relaxation studies suggest that the LF-regime large activation energies (∼1.1–1.2 eV) are likely associated with oxygen vacancy charge migration of oxygen vacancies through various grain boundaries/interfaces, whereas HF-regime activation energies (∼0.6–0.7 eV) are likely due to electronic charge carrier migration within the grain and/or bulk of the film.
ACKNOWLEDGMENTS
This research was conducted under MURI grant from Office of Naval Research under the contract number N000140510541. The authors thank Dr. Matthew Olszta for his help with the TEM analysis, Jennifer Sloppy and Elizabeth Dickey for their discussions on tantalum anodization, and Sean Pursel for his help with SEM analysis.