Electoral accountability – the notion that citizens use the vote to influence government action – is a central tenet of democratic theory.Footnote 1 It informs active scholarly and policy debates about the quality of government, including how to devise policies to improve the well-being of poor people in poor countries.Footnote 2 But does democracy work as theorized? Do citizens use their vote to hold politicians accountable for delivering, or failing to deliver, much needed goods and services? Despite the centrality of this question, surprisingly little high-quality empirical evidence has been brought to bear on it, particularly in developing country contexts. In this article we contribute a new (and surprising) empirical answer, and explore mechanisms that account for our findings.
We test the accountability hypothesis in its purest form: do dramatic improvements in key service areas, those with direct implications for public health (water provision, sewerage, and refuse collection), lead to increased electoral returns to the incumbent? We consider four Southern African democracies, and present two primary sets of empirical tests of whether accountability works as commonly assumed. First, we exploit extensive variation in the degree of change in service delivery coverage between 2001 and 2011 in South Africa, the largest democracy in Southern Africa. Combining data from the 1999 and 2009 national elections, 2000 and 2011 local elections, and the 2001 and 2011 censuses, we study how variation in the change of service provision across these three different services relates to changes in voting for the incumbent African National Congress (ANC).
Strikingly, these analyses show that changes in access to services are negatively associated with changes in support for the incumbent. We then analyze Afrobarometer data, spatially linked to the census and electoral data, to probe whether this result also holds for individual voters. The key findings replicate at the micro-level in South Africa, as well as in Botswana, Lesotho and Namibia; controlling for a host of covariates and potential confounders, access to services systematically predicts lower support for the incumbent. These findings are not simply artifacts of the data, which predict numerous other relationships precisely as would be expected. Of course, because our study is based on observational data there are good reasons to be concerned about potentially spurious relationships and omitted variable bias. We attempt to address a range of such concerns, and these analyses leave us cautiously confident about our findings.
Crucially, our results cannot be explained away by differences in local partisan control. We do find that citizens in opposition-controlled municipalities are much less likely to vote for the national party in power the more services are expanded, even though the national party in power can credibly claim some credit for such services. Yet even where the dominant party is in control of local government, both our aggregate data and survey data show that service delivery is negatively associated with incumbent voting. These findings cut against conventional expectations, and demand further exploration. We suggest a number of theoretically and contextually motivated mechanisms, and find some evidence in favor of at least two.
First, increases in service delivery appear to heighten citizens’ awareness of, and exposure to, corruption. Corruption is a salient political issue in most developing democracies, and so increased exposure to corruption may induce shifts in voting behavior. Second, we find that increases in service delivery appear to change voter expectations, ratcheting them upward. Once voters are provided with basic services, they may revise their expectations of government provision upward, seeking out alternative parties. Finally, we find mixed evidence that our results may be driven by relative deprivation, wherein voters care less about what they have in absolute terms, and more about what they have relative to others.
These findings suggest that voters engage in ‘nuanced accountability’. As expected, they pay attention to service delivery, and those who receive services are more likely to acknowledge that the government has done a good job in this regard. Yet voters do not cast their ballots simply on the basis of the presence or absence of services, but consider factors such as process and their own evolving expectations.
Our study has important implications for a number of literatures in political science and development. First and foremost, we contribute a new empirical answer to the question of whether electoral accountability works as is often assumed. The answer is surprising – improved service provision is not associated with increasing incumbent vote share in any of the four cases examined. We find that voters are instead quite nuanced in their assessments of and reactions to government performance. Second, our findings speak to broader questions about the relationship between democracy and development, in which there has not been a consistently pro-poor bias, at least relative to non-democracies.Footnote 3 Finally, our findings suggest that policy researchers interested in establishing positive feedback loops between voters and politicians should be cautious about the workings of straightforward accountability.
VOTER BEHAVIOR UNDER ELECTORAL ACCOUNTABILITY
How do citizens behave in their capacity as principals in developing democracies? A simple but largely untested assumption underlying democratic theory is that citizens will be straightforwardly more likely to reward incumbent politicians with their votes when politicians deliver services.
Testing this assumption is critical for shedding light on generations of scholarship investigating the material consequences of democratic government.Footnote 4 Recent empirical work on the determinants of service delivery has focused largely on comparisons between democracies and non-democracies.Footnote 5 While illuminating, such studies necessarily place a ‘black box’ around the specific machinations of democratic government, and largely do not parse out the roles of citizens and politicians. Our goal is to better understand how democracies work in practice, with a specific focus on the role of citizens in elections.
The concept of ‘electoral accountability’ is rooted in the twin expectations that politicians are concerned about how citizens will vote, and that citizens will use their votes to punish (reward) politicians for bad (good) performance.Footnote 6 While the first expectation – that politicians seek re-election so long as it benefits them – is relatively uncontroversial and easy to observe, the second demands more careful examination. Underpinning this expectation is an assumption about how citizens will behave if they observe government providing the goods that they say they desire. In particular, within societies in which basic services (such as piped water, sanitation and refuse collection) are demanded but not universally provided, can we safely assume that citizens will be more likely to vote for the government that provides them?
While such expectations are intuitively plausible, scholars have sought to better understand where democratic theory might break down in practice. Indeed, in recent years, much research on democratic governance in developing country contexts has focused on the structural and institutional constraints on citizens’ abilities to act as effective principals. A prominent explanation from this literature is that ‘informational asymmetries’ are to blame. That is, the lack of availability of quality information about government performance amongst poor voters in poor countries can explain their sometimes surprising behavior.Footnote 7 A number of recent interventions have thus sought to increase the quality of accountability through deliberate information campaigns, though with decidedly mixed results.Footnote 8 Relatedly, Gottlieb highlights that an additional problem may be that voters lack context concerning what to expect from politicians, and finds that by providing information about standards and expectations, citizens are more likely to sanction poor performers.Footnote 9 Similarly, research on Kenya’s 2007 elections suggest that voters may rely on racialized or ethnicized national discourse to guide their decisions, clouding material accountability.Footnote 10
Notwithstanding the important findings from these studies, a central question still remains: absent informational, social and structural barriers of the types described above, do citizens behave as democratic theory predicts? That is, are they more likely to vote for incumbents when they receive services? The closest study to the research we endeavor here is a recent analysis of the relationship between road provision and voting in contemporary Ghana, in which the author finds that an improvement in road quality leads to an increase in the incumbent party’s vote share.Footnote 11 While Harding’s contribution is significant, his study considers one form of government service, in one country. Further, given the substantial positive externalities associated with road access, it is not clear whether the effect is generated through satisfaction with roads per se, or with economic returns caused by road infrastructure. It is important to consider this relationship in a range of other contexts, and we attempt to build on Harding’s findings and insights, particularly by focusing on visible and attributable goods. Specifically, Harding and Stasavage, in a discussion of how governments are responsive to voters, follow Mani and Mukand, who argue that governments are more likely to shift resources to outcomes that are less ‘noisy’ or more ‘attributable’ to government.Footnote 12 Harding makes a similar argument about voters’ assessments of public goods, and finds that Ghanaian voters hold politicians accountable for road investment (a visible and attributable good), but not for education quality (more noisy and less attributable).Footnote 13 Relatedly, scholars have raised concerns about the likelihood of electoral accountability when citizens are unsure about who to credit or to blame for services under conditions of divided governments or diverse coalitions.Footnote 14 Powell and Whitten highlight the need to take account the ‘clarity of responsibility’ when analyzing the effects of economic and political factors on voting outcomes.Footnote 15
The weight of theoretical expectations about voter behavior in the context of incomplete infrastructural service delivery are relatively straightforward: all else equal, when new services are provided, attributable and visible, and the party in power is also easy to observe, voters should be more likely to perceive their own lives as having improved, to credit the government for such improvements and, most importantly, to favor the incumbent in the electoral arena. Such expectations motivate our research, but our findings point in exactly the opposite direction. After describing our research design and results, we return to our theoretical discussion, advancing and testing additional hypotheses concerning the explanation for those results. We note that we do not present the latter theoretical discussion here because we seek to be transparent about the order of inquiry in our research – we wish to make clear that we theorized about the negative relationship between increased service delivery and change in incumbent vote share only after those first-order results were apparent to us.
RESEARCH DESIGN, STUDY CONTEXT AND DATA
Our research design combines analyses of fine-grained local-level data within one country (South Africa) with a range of analyses of individual-level data in four Southern African democracies. At the aggregate level, we first exploit variation in the provision of services within political units over time. Within a first-differences design, we estimate the average association between the change in service delivery (our explanatory variable, for various services) and the change in incumbent vote share (our dependent variable), within political units over time. Our unit is the political ‘ward’, specifically the 2011 ward boundaries.Footnote 16 The first-differences design absorbs time-invariant or slow-moving confounders, but we also control for the change in a range of important demographic and socio-economic covariates. We include a number of baseline level covariates. The design rules out a large swathe of potential confounders, isolating the effect of change in service delivery assuming voting behavior in units follow similar (parallel) trends over time.
We complement this with regression and matching analyses at the individual level using data from several rounds of the Afrobarometer, spatially linked to the aggregate-level data. We replicate our individual-level results in Botswana, Namibia and Lesotho, three of South Africa’s neighbors. Together, our analyses paint a fairly consistent relationship concerning the association between service access (at the individual level, and various levels of aggregation) and attitudes towards government and votes for the incumbent.
South African Politics and Service Delivery
We focus primarily on the case of post-apartheid South Africa. This case is well suited to answering our primary question because we are able to observe, using high-quality, high-resolution data, wide variation in patterns of change in visible and attributable service delivery (water, sewerage and refuse collection).Footnote 17 During the fall of apartheid, the African National Congress (ANC), then led by Nelson Mandela, campaigned on the provision of basic services to the newly enfranchised black majority with the slogan ‘a better life for all’. South Africans came to expect drastically improved service delivery, and this has remained salient throughout the post-apartheid era. Since the first multi-racial, democratic election in 1994, the state has vastly expanded basic infrastructure and services across the country while still falling far short of universal delivery. The fact that the ANC has controlled national government since 1994 leaves little ambiguity about responsibility for new service provision. Notwithstanding, South Africa’s is still a competitive electoral system, and there is variation in who voters choose to support. In particular, there is political heterogeneity at the local level, where roughly one-quarter of municipalities have been controlled by an opposition party. Beyond South Africa, Botswana, Lesotho and Namibia are similarly well suited for testing electoral accountability.
At the individual level, we further focus our analyses on black South Africans, who constitute the overwhelming majority (~80 per cent) of the population. This group was most severely excluded from citizenship and service provision during apartheid.Footnote 18 Other race groups in South Africa – notably Coloureds and Asians/Indians – also lacked access to basic services to a degree in the early 1990s, but their small numbers and geographic concentration make them less suitable for the types of analyses we undertake here.
We assume that preferences for basic services are universal, but these preferences and their salience can be demonstrated empirically. In responding to open-ended questions about what problems government should address, we find across five rounds of survey responses that 25.2 per cent of black South Africans mentioned water, electricity or other basic services (not including housing, security or poverty, which were also important concerns); and of those living in areas without easy access to water or electricity, that proportion jumps to 37.9 per cent. Service delivery is ubiquitous in political discourse. Protests focusing on the quality of service delivery occur regularly throughout the country, and politicians regularly campaign on service delivery issues.Footnote 19
While South African elections have been labelled a ‘racial census’, there is a strong suggestion in prior research that voters do appear to care about party positions and government achievements.Footnote 20 Similarly, outside of the South African case, researchers in sub-Saharan Africa find that economic concerns can be crucial in voting decisions.Footnote 21 It is worth noting, however, that prior studies of South African voting behavior have analyzed survey data from an earlier era of the post-apartheid history, when normative attitudes towards the ruling ANC party were much more likely to be favorable among the black population owing to the organization’s pivotal role in national transformation. We contribute to this literature by studying objective measures of government performance, rather than perceptions thereof – in later sections we discuss the correspondence between actual government performance and stated perceptions.
It appears to us that voters in South Africa likely care about service provision and government performance. This service provision is a responsibility shared by a range of government structures at different levels, in part determined by the service of interest. Services like education and policing are typically administered more nationally, along with electrification (due to dependence on the national grid). All three services we study in this article – water, sanitation and refuse – are primarily administered at the local level. Access and quality are largely determined by the particular municipal council, who serves as the front-end ‘retailer’.Footnote 22
Moreover, while we consider a range of government services, we do not analyze two substantively important services, electrification and education. Electrification has documented knock-on economic effects in local communities,Footnote 23 which renders testing electoral accountability difficult (we may instead be picking up the association between economic development and voting). Electricity theft also occurs throughout South Africa, making it hard to extract from census self-reports whether households actually have government-provided access. It is quite plausible that any measurement error induced by theft would act as a confounder, making inferences hard to draw. More than any other service in South Africa, electricity provision is constrained by both stock and flow delivery.Footnote 24 Finally, the expansion of electrification services has been so extensive – in 2011, 85.1 per cent of South African households used electricity as their primary source of lighting – that we have less variation to explore. None of the above problems affect water, sanitation or refuse collection in a similar way.
We also do not study education, despite it being a major budget priority for the South African government. Education is a much less attributable good, because it is hard for voters to monitor the performance of local teachers and schools.Footnote 25 Moreover, on the metric collected through the national census – percentage of children enrolled in school – there has been very little change over time. Again, these problems do not affect the services we study.
The Logic of Service Provision
Our research design requires that changes in service delivery over time are independent of time-varying confounding variables. While the first-differences design is advantageous, because services are not randomly assigned we should remain cautious. The primary challenge to our approach is that service provision may be politicized and targeted strategically. If this were the case, the trends in political behavior in areas with high changes in service delivery may be very different from low-change areas, generating spurious results. Fortunately, available evidence suggests that this is not a major concern.
Service provision in South Africa is governed by the principles of the Batho Pele initiative, launched in 1997 by Mandela’s government, which created relatively transparent formula-based allocations for local financial support. Despite the uniformity of goals, there remains heterogeneity in the roll out of services to those in need. As most implementation of service delivery is administered by municipal governments, the quality and reach of services is often defined by the capacity of the municipal governments themselves. While parties are able to ‘deploy’ politicians, technocrats and bureaucrats to some areas, the vast majority of municipal workers are sourced from local communities. The primary input for service delivery is, however, financial disbursements. These are national government allocations from the treasury, which determine the fiscal resources available to particular local governments, with some funds earmarked for particular portfolios.
There are two central components to disbursements from the national treasury. The first, which represents the bulk of transfers, is known as the ‘Local Government Equitable Share’, and defined by formula. The formula, reviewed every few years by a committee, typically up-weights the transfers to municipalities with higher numbers of poor households (hence ‘equitable’). The second is known as ‘Local Government Conditional Allocations’, which comprise smaller transfers of task or project specific funds to municipal governments. These conditional transfers are often highlighted as particularly ‘political’, given that there is more discretion and less transparency in determining their recipients. Typically, however, the conditional component is dwarfed by the equitable share component, so the national government has limited discretion in this regard.
There is very little reliable research into whether the disbursements from national government are politically motivated. The most sophisticated analysis of political bias in treasury disbursements is by Kroth,Footnote 26 who analyzes the disbursements to the provinces (not the municipalities). Kroth finds that there is some distortion in the (provincial) equitable share specifically around election years – the ANC seemingly directs more funding to less competitive places. This fact makes our negative findings all the more remarkable; if the ANC is engaged in any financial targeting, it appears to be targeting the places where it is doing best, rather than places that are trending toward the opposition.
One suggestive test is whether baseline ANC vote share predicts changes in service delivery over time. To test this, we regressed ward-level changes in service delivery (2001–2011) on a range of baseline covariates (those we also control for in our main specifications) and, in two specifications, ANC vote share in 1999 (national) and 2000 (local). The results, presented in the appendix, show zero or close-to zero, non-statistically significant estimates in twelve out of sixteen tests. Of the four statistically significant results, three are at the 10 per cent significance level only.
Together with the evidence presented by Kroth,Footnote 27 this suggests that the ANC has limited discretion to influence the geographic distribution of local service delivery, and when it does, it does so in ways that likely could not account for our negative findings.Footnote 28
Data
Our first analyses use aggregated voting data drawn from polling-place election returns from the 1999 and 2009 national, and the 2000 and 2011 local elections.Footnote 29 We combine these with aggregate data from the South African censuses of 2001 and 2011, which enumerated household access to water, flush toilets and regular refuse collection, as well as a range of social and demographic factors of interest. We aggregate the data to the 2011 ward level (n=4277). While the ANC has remained hegemonic in South African politics, there is substantial local-level variation in the ANC’s electoral performance over time.Footnote 30
Wards are redistricted in South Africa every five years. We constructed our panel data using the 2011 political geography (the current geography at time of writing), and retroactively fit older data to these new boundaries, using lower-level electoral and census units that fit into the 2011 boundaries.Footnote 31
South African census data is nested within enumeration areas (roughly 60,000–90,000 observations, depending on year). These data were released pre-aggregated to the 2011 ward and municipal levels by Statistics South Africa (Stats SA, the census bureau).Footnote 32 The election data were made available at the polling-place level (roughly 15,000–22,000 observations, depending on year). The polling place polygons fit, in almost all cases, cleanly into the 2011 wards, so we aggregate from the polling place up to the 2011 ward and municipal levels. For ease of interpretation, all variables are rescaled to range from 0 to 1.
Of course, not all changes in service provision are entirely attributable to direct government action: some services, especially those that reach inside the household (such as installing a flush toilet), are privately provided, and we do not have data that allow us to distinguish the share of government action. Nonetheless, we believe that our data still provide a strong basis for testing the core theories of democratic governance. First, if we make the reasonable assumption that the public/private mix of new service provision is relatively evenly distributed across space, we may make unbiased estimates of the effects of new services. Second, the services we consider almost always rely on a degree of government-provided infrastructure whether or not the final point of delivery is publicly provided. Third, given the widespread discourse around government’s failure to provide basic services, we assume that frustrations towards lack of services will be directed at the government, and it would not follow from conventional theory that those who managed to attain services on their own would systematically punish the government for this state of affairs. Finally, with respect to the South African case, we are not aware of any evidence of rival parties seeking to attract voters by targeting them with the private provision of local public goods in the manner ThachilFootnote 33 finds in the case of India.
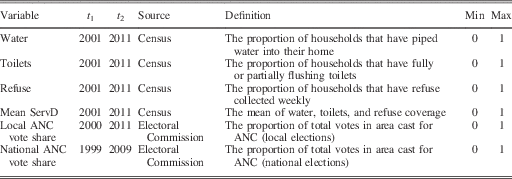
The set of key aggregate-level measures are presented in Table 1, including a ‘mean service delivery’ measure that combines the three services of interest. Our final dataset is a two-wave panel, with t 1 in the early 2000s (1999–2001), and t 2 around 2010 (2009–2011). To these key variables we also add a number of economic and demographic covariates from the census. This ensures that our results are not driven by a number of plausible confounders, including unemployment levels, income levels, population size, gender proportions, the formality of dwellings, the proportion of whites in the area, and the share of each ward that falls within a traditional authority area. Several of these variables actually drive the formula-based budget allocations.Footnote 34
Key Aggregate-Level Variables

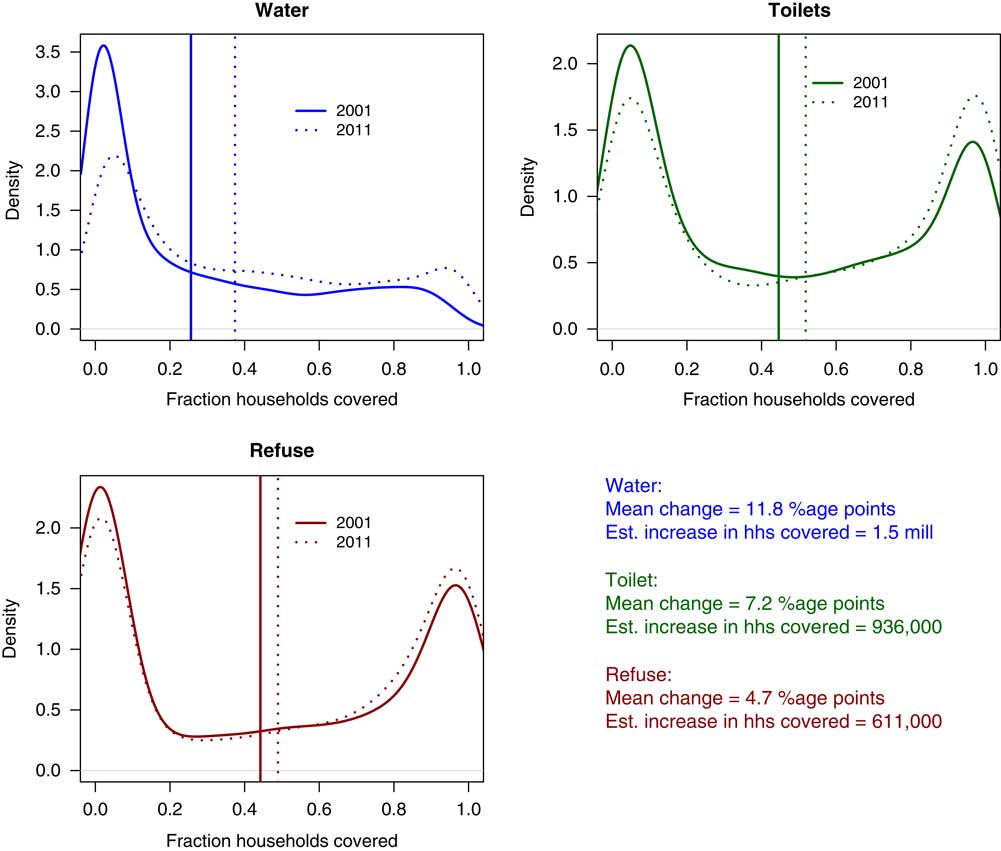
There is substantial variation across wards in terms of how service delivery coverage has changed between 2001 to 2011. Figure 1 shows the relative distribution of these services in 2001 and 2011. Water delivery has improved most dramatically: the national coverage of households increased by 11.8 percentage points between 2001 and 2011, meaning that roughly 1.5 million more households were provided access to piped water in those ten years. Sewerage and refuse show more modest improvements, with increases of 7.2 and 4.7 percentage points, respectively, implying new access for at least 936,000 and 611,000 households.Footnote 35 Note that Figure 1 depicts shifts in coverage percentage at the ward level – a small increase in the number of wards with 90 per cent coverage may represent a dramatic increase in the number of people who have access to services. There is also considerable variation over geographic space, presented in a series of figures in the Appendix.
South African basic service provision: 2001 and 2011 (household coverage within wards). Note: Each panel presents the distribution of service delivery coverage for households for a given service, at the ward level, in 2001 (solid line) and 2011 (dashed lines). The vertical lines are the year means (2001 is solid, 2011 dashed). The bottom right panel presents some key figures from the graphs. First, the percentage changes for each service. Second, the estimated number of new non-White households that have received services since 2001. This was estimated in a very simple fashion by taking the estimated number of households in South Africa (≈ 13 million – in 2001 there were roughly 12 million households in South Africa, and in 2011 roughly 15 million). This was then multiplied by the change in coverage.

ANALYSES OF WARD-LEVEL ADMINISTRATIVE AND VOTING DATA
Our aggregate-level analyses use a first-difference regression, specified as follows, for ward i, clustered by municipality j:
 $$\Delta y_{i} \, \, {\equals}\, \, \alpha {\plus}\beta \Delta x_{i} {\plus}\delta \Delta w_{i} {\plus}\phi m_{i} {\plus}\eta _{j} $$
Our outcome of interest is
 $$\Delta y_{i} $$
, the change over two-periods in ANC vote share.
 $$\alpha $$
is the intercept,
 $$\Delta x_{i} $$
is the change in a particular service in question, while
 $$\Delta w_{i} $$
is a matrix of covariates (also differenced to capture change over time). m
i
are baseline covariates – including the baseline of the service in question – included to weaken the parallel trends assumption.
 $$\eta _{j} $$
is the error term, always estimated at the municipal (cluster) level.
 $$\beta $$
is the primary coefficient of interest, an estimate of the correspondence between changes in service provision and changes in ANC vote share.
With only two time periods, the first-differences specification simply regresses a single change on a single change, plus some error term, and time period fixed effects fall away. This specification is robust to time-invariant confounders at the ward level, and is thus a superior test compared to conventional cross-sectional regressions in that a number of plausible confounders, such as non-varying or slow-moving geographic, economic, socio-cultural or demographic features, is far lower. Yet to interpret the coefficient
 $$\beta $$
as causal, we must assume that
 $$\Delta y_{i} $$
and
 $$\Delta x_{i} $$
are not jointly determined by a time-varying confounder that has been omitted from the regression. We include a number of time-varying covariates that could be driving our results, such as employment and income levels. We further include some baseline covariate levels in 2001, to essentially ‘weaken’ the parallel trends assumption.
Main Results
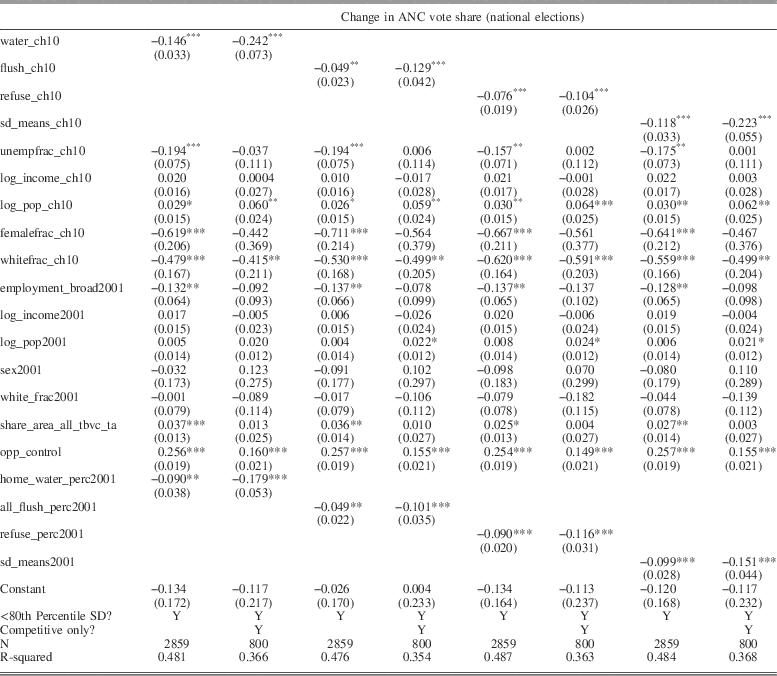
Our main results, estimated for changes in ANC vote share in national elections, are presented in the top four rows of Table 2.Footnote 36 We present two sets of results for each service using two samples. The first is the ‘full’ sample, and includes all data less those observations in the top quintile of baseline service coverage. We exclude the top quintile of baseline service coverage to ensure that the results are not compromised by ceiling effects. In areas where baseline service coverage was already extremely high or almost universal, there was no possibility of substantive improvement. That is, if baseline service coverage is very high then changes are likely mechanically small, and if the ANC electoral performance is trending in some way we may recover a spurious relationship between the two driven by the ceiling effect. In the second sample, the ‘competitive sample’, we also discard observations in which baseline ANC vote share fell outside of the window 30–70 per cent. We do this because it is precisely in these competitive areas that we would expect electoral accountability to be most present, and to again ensure that ceiling effects are not driving our results.
Effect of Change in Service Delivery on Change on National ANC Vote Share

***p<0.01; **p<0.05; *p<0.1.
Standard errors clustered by municipality.
Tables produced using Stargazer (Hlavac Reference Hlavac2013).
Strikingly, we find that greater improvements in service provision typically predict declines in ANC electoral performance, systematically so at the national level, and for certain services at the local level. For those services (refuse and sewerage) that do not negatively predict changes in ANC electoral performance at the local level, we find quite precise zero estimates. The substantively significant results are also broadly speaking statistically significant at conventional levels. In sum, the results show either negative or precisely null relationships between changes in service delivery and changes in the ANC’s vote share. In general, it also seems from our sample that voters are more sensitive to changes in water than changes in refuse and sewerage, as the magnitudes are generally larger.
All coefficients – both for the full sample and the competitive sample – are negative and statistically significant at conventional levels in Table 2. In terms of magnitude, the findings are also notable. Consider column 1 of Table 2, in which a −0.146 coefficient implies a decrease in ANC vote share of 14.6 percentage points were water coverage to move from 0 (no coverage) to 1 (full coverage). The mean change in water provision from 2001 to 2011 at the ward level was an increase of roughly 0.12, or 12 percentage points. Thus a change of mean magnitude would result in an estimated average decrease of 14.6×0.12, roughly 1.75 percentage points of ANC vote share. An alternative substantive interpretation can use the standard deviation of change in the service of interest. For toilet provision, a standard deviation of the change was 0.19, so a single standard deviation change would result in an estimated average decrease of 4.9×0.19, roughly 0.93 percentage points of ANC vote share.Footnote 37
Heterogeneity by Local Municipal Incumbent
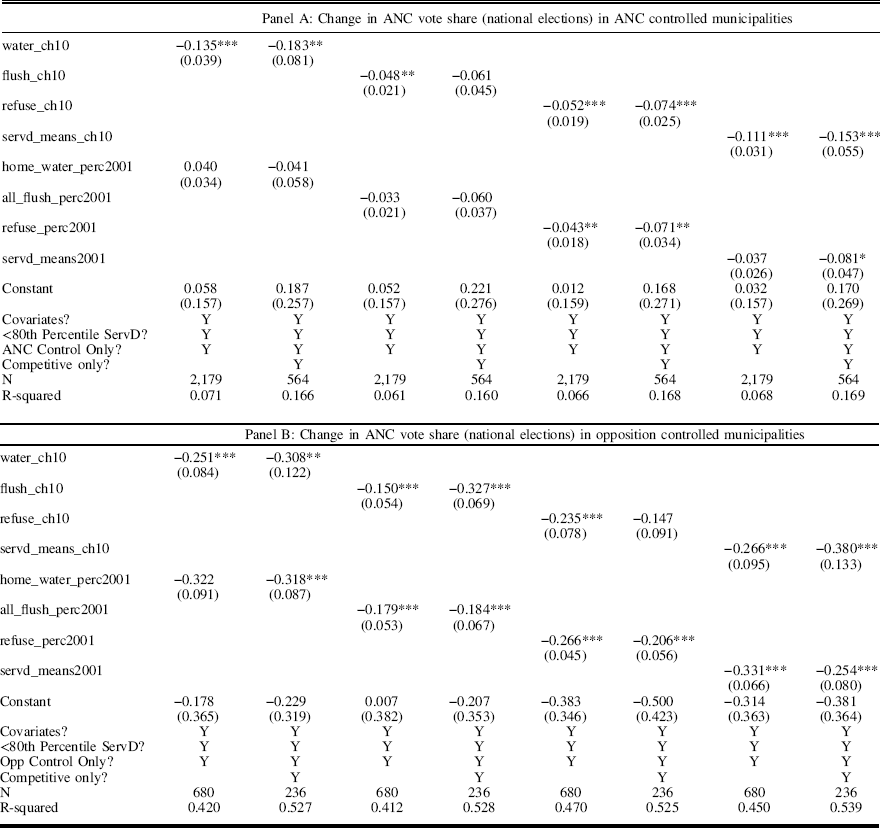
We decompose these results in two ways. First, we consider heterogeneity by local municipal incumbency status. We define ‘opposition municipal control’ as the ANC not having the majority of seats in the municipal council over the entire period 2000–2011.Footnote 38 To recover the heterogeneity in effects, we re-estimate our previous specifications on the two sub-groups, ANC-controlled municipalities and those that were not. The results are presented in panels A and B of Table 3.Footnote 39 The results in the top four rows of both panels largely corroborate the previous findings – the ANC loses vote share when service delivery improves. Note, however, that the magnitudes of the coefficients in panel B (those areas not systematically controlled by the ANC) are somewhat larger than the coefficients estimated in panel A (ANC areas), suggesting that those living in opposition areas respond more intensely to changes in service delivery than those not.
Heterogeneous Effects of Change in Service Delivery on Change on National ANC Vote Share

***p<0.01; **p<0.05; *p<0.1.
Standard errors clustered by municipality.
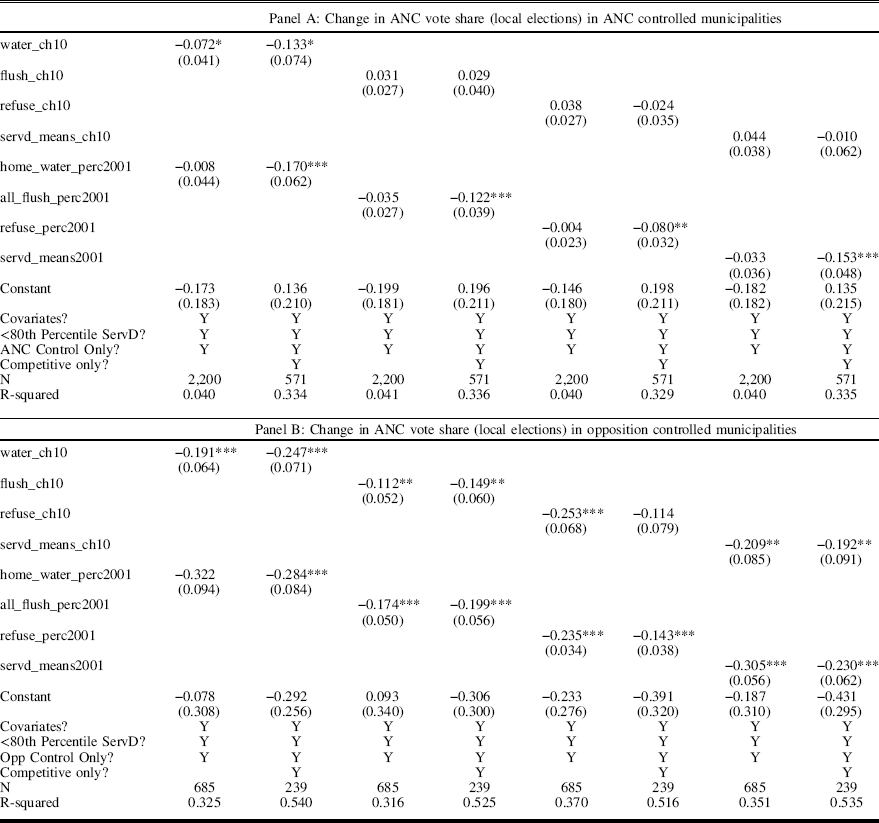
We next consider the effect of service delivery in local elections. These results, from the same specifications outlined above and again decomposed by municipal incumbency status (ANC- or opposition-controlled), are presented in panels A and B of Table 4. At the local level we find that increases in water provision affects ANC vote share negatively – albeit the effect appears to be about half as strong as in the national elections. For other services the effect estimates are approximately zero – sometimes slightly positive, sometimes slightly negative, never statistically distinguishable from zero.
Heterogeneous Effects of Change in Service Delivery on Change on Local ANC Vote: ANC Municipalities Only

***p<0.01; **p<0.05; *p<0.1.
Standard errors clustered by municipality.
By contrast, in opposition areas, the negative effects remain with substantively similar magnitudes, statistically distinguishable from zero. This suggests to us that in local elections improvements in service delivery only affect the national incumbent’s vote share in areas they do not systematically control – opposition areas. The dominant party does gain electoral advantage for increased service provision in these local contests.
This difference in effects in local and national elections requires some further consideration. Why do negative effects appear across the board in national elections but less so in ANC-controlled municipalities in local elections? There are a number of plausible explanations, most notably that the electorates in national and local contests (which are off-cycle) are different. Turnout in South Africa is roughly half as high in local elections as national elections, suggesting that there may be strong self-selection into the local electorate. These voters may be stronger partisans (who are more likely to vote, and more likely to be activated by the machine), more sophisticated and knowledgeable, and thus better able to make sharper inferences about who is responsible for service delivery. Moreover, as Holmes and ShoupFootnote 40 argue, the ANC has been less successful in framing its power as inseparable from the post-apartheid state at the local level, where ‘policy-oriented frames’ have proven to be more important. Whatever the source of the difference, we see these two sets of results as complementary, together suggesting that the ANC is, at the very least, not rewarded for service provision. This one subtlety notwithstanding, our results generally suggest an across the board negative effect of service delivery provision on ANC vote share, stronger in opposition-controlled areas and in national elections.
ANALYSES OF INDIVIDUAL-LEVEL SURVEY DATA
The analyses and discussion above highlight that gains in government-provided service provision are generally inversely related to changes in ANC vote share. The negative relationships are plausibly understandable in the context of opposition-controlled municipalities, though even in these cases they require that voters differentially allocate responsibility between the ANC-led national government and opposition-led local governments, a task which may be difficult given the centralized nature of the country and that service delivery has been a central ANC issue since 1994. Moreover, the general lack of a positive relationship between service delivery and vote share even in ANC-controlled municipalities remains surprising from the perspective of conventional electoral accountability theories.
It is important to consider whether our results might simply be driven by some ecological fallacy. Given this, is there evidence that individual voters respond in this manner? Using Afrobarometer data we take advantage of survey responses to questions about household service access as well as enumerator-reported assessments of service infrastructure. In order to analyze the effects of local-level coverage (as discussed in the prior section), we spatially joined our aggregate service delivery data to the Afrobarometer.Footnote 41
We focus on six outcome variablesFootnote 42 All variables are recoded for analysis on a 0–1 scale, and the vote_ANC variable is recoded as a dummy variable that takes a value of 1 for all respondents indicating the African National Congress party, and a value of 0 for all other responses.
The use of survey data complements the analyses presented earlier, but some limitations are notable: despite the availability of five rounds of survey data, we cannot measure over time changes in public opinions and voting intentions at the individual level because the Afrobarometer survey is not a panel. Further, some areas are added and some dropped over time. And because representative random sampling for the survey is conducted only at the district level, and sample sizes at the municipal or ward levels are small, we cannot assemble an area panel to analyze changes in opinion at that level. As such, we use the Afrobarometer in a pooled cross-sectional fashion, including various time and area fixed effects, along with a rich set of covariates, to absorb as much variation and potential confounding as possible. We adopt a simple ordinary least squares approach to estimation.Footnote 43
The Afrobarometer provides two types of data for analyzing services: direct questions to respondents about household service access, and enumerator-recorded data about the presence or absence of visible services in the enumeration area. In terms of the former, we consider responses to questions about the presence of water for household use as being outside the compound, inside the compound or inside the house (responses coded as 0, 0.5 and 1.0, respectively) and about the presence of a toilet or latrine, allowing for answer of none, outside the compound, inside the compound or inside the house (responses coded as 0, 0.33, 0.67 and 1.0). And in terms of enumeration area data, we consider binary response variables to questions about the presence or absence of a piped water system and a sewage system.
We are able to join individual-level data from several rounds with the geo-coded service delivery data analyzed in the previous section, which allows us to analyze the relationship between service delivery patterns (at the individual, enumeration area, ward and municipal levels) and individual attitudes, perceptions and behavioral intentions. Thus, in contrast to the analyses in which we estimated the effects of changes, in the current section, we present estimates of the relationship between levels of service provision and individual attitudes and behavioral intentions. Because the majority of black South Africans lacked such services in the immediate post-apartheid period, we believe that that in analyses of this group, observed service levels are a proxy for within-household change in service delivery. Nonetheless, our analyses are clearly of ‘level’ data, not ‘change’.
South African Results
Our analyses of individual-level data are highly consistent with the aggregate-level analyses presented above.Footnote 44 Specifically, we estimated models of our key outcome variables as a function of service delivery and a series of individual-level covariates, including whether the individual lives in an urban area, gender, holds a cash-paying job, level of education (which should capture income and wealth), age and home language. As discussed above, we consider only the responses of black South Africans. Following the findings described above, we compare results for those in ANC-controlled and opposition-controlled municipalities.
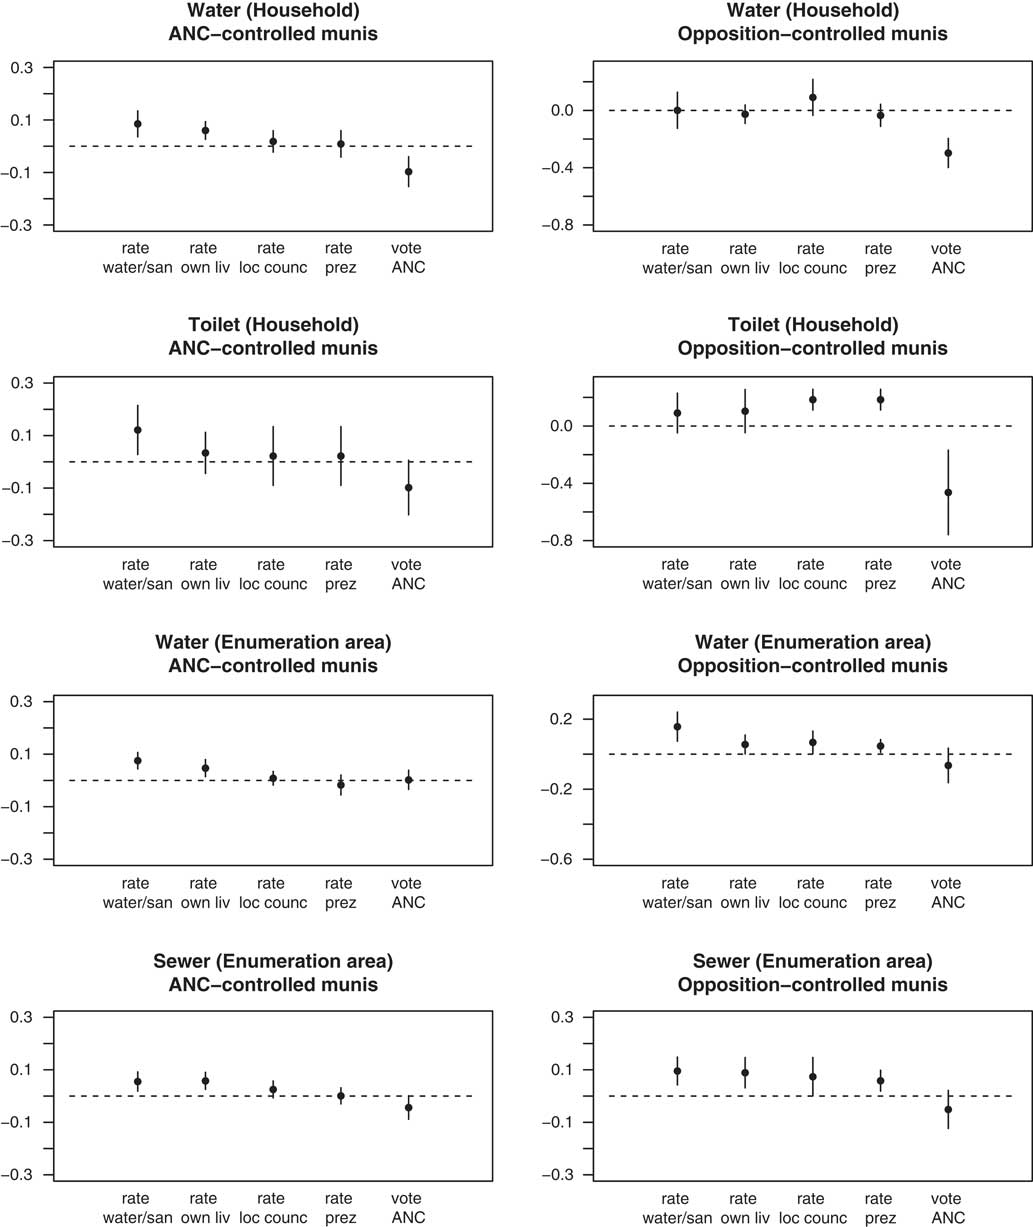
In Figure 2, we report our analyses of the effects (under some assumptions) of self-reported service delivery data at the household and enumeration-area levels. Across ANC- and opposition-controlled areas, having services in the household or in the enumeration area positively predicts how likely the individual is to rate the quality of water and sanitation services (though the estimated effect of water in opposition-controlled areas is zero). We interpret these findings as strong evidence that there is not an informational problem at hand: citizens are aware of the services they are receiving and, consciously or not, they attribute those services at least in part to government action.
Service access effects on attitudes and voting intentions of Black South Africans. Note: Each panel presents estimated coefficients from five OLS regressions. In each regression, the titled service delivery item is the independent variable, and the survey response listed on the X-axis is the dependent variable. Each coefficient is estimated with survey wave and municipality fixed effects, and standard errors are calculated by clustering data at the municipality-level. Lines represent 95% cluster-robust confidence intervals. Individual-level controls include gender, age, education-level, dummy variables for home language (Xhosa or Zulu, with other as missing category) and urban residence. Note that data about own water were only contained in rounds 4 and 5; and data about own toilets were only contained in wave 5.

At the household level, we do not find conclusive relationships between service access and attitudes about living conditions or ratings of government. However, when considering service infrastructure in the enumeration area, this is generally associated with better individual ratings of living conditions across all types of wards. Service provision does not have a particularly consistent association with ratings of local councilors or of the president, but some estimates are positive in the context of opposition-controlled municipalities.
Most strikingly, seven of eight estimates show a negative relationship between service access and intention to vote for the ruling ANC party in a hypothetical presidential election. These are all substantively and statistically significant in the four estimates of the effect of household service access. From the perspective of conventional theories of electoral accountability, it is not entirely surprising that in opposition-controlled areas that voters would credit good service to the opposition party, leading to a greater share of potential ANC voters towards the opposition. That said, it is not fully obvious that they should respond in this way given that basic service provision was articulated as a national priority by the ruling ANC party and a substantial share of funds available to local governments is transferred from the national government (as discussed above).
What is certainly surprising from the perspective of conventional theories of electoral accountability is that even in ANC-controlled areas, where party-based attribution is unambiguous, we still find a sizeable, negative and statistically significant relationship between service provision and intention to vote for the ANC. And these patterns fully accord with the results we observed in our aggregate analyses.
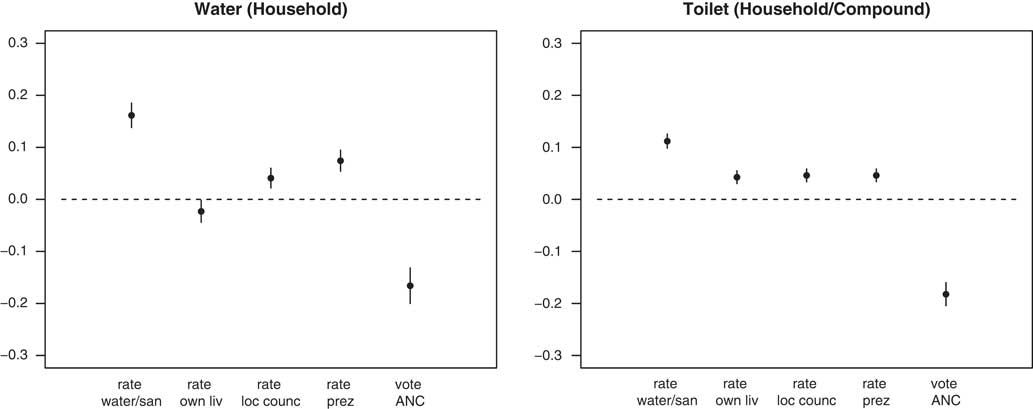
To demonstrate that our results are not driven by specific modeling assumptions, we re-estimate the effects of individual-level service access using matching within our sample of individual respondents,Footnote 45 but owing to sample size constraints, only within ANC-controlled areas. That is, we consider ‘treatment’ to be access to a particular service, and we pre-process our data to identify respondents who are similar in all observable characteristics that could simultaneously predict treatment and outcomes.Footnote 46 Again, we cannot claim that treatment is randomly assigned, but our matching analyses more closely resemble an experimental design.
Although pre-processing comes at a substantial cost in terms of loss of sample size, as we show in Figure 3, we find again that individual-level access to services is associated with substantially better ratings of government services, but also substantial decreases in likelihood of voting for the ANC. We present the estimates of average treatment effects on treated individuals (ATT) and find that the probability of voting ANC is reduced by 16.6 percentage points for those with water, and by 18.2 percentage points for those with toilets.Footnote 47
Household, enumeration-area service delivery and citizen attitudes and intentions, matching estimates (ANC-controlled municipalities). Note: Each panel presents ATT estimates of the listed service delivery item from calculations of difference in means between ‘treated’ and ‘untreated’ groups. Afrobarometer survey items listed on the X-axes are the outcome variables from separate analyses. Lines represent 95% confidence intervals.

In short, the dominant party in power not only fails to get voting credit in the opposition-controlled localities, but even where it is unambiguously in control and responsible for government service, service access is associated with greater likelihood of an opposition vote.
General Patterns in Southern Africa
Do our findings generalize to the rest of democratic Southern Africa? Botswana, Namibia and Lesotho are all similar to South Africa in important ways: they are all middle-income countries, characterized by substantial within-country variation in service delivery; with improvements in delivery in recent years; with a dominant but slowly declining liberation party in power; and relatively strong democratic institutions and rule. While fine-grained voting and service delivery data are not currently available to us for any of Botswana, Namibia or Lesotho, we are able to test the extent to which our findings apply at the individual level, using data from the Afrobarometer.
To the extent possible, we replicate our individual-level analyses, though given the relatively small population sizes and absence of regional data, we do not control for regional fixed effects or cluster standard errors at a regional level. Exactly as before, we estimate a series of regressions of individual ratings of government water and sanitation services, individuals’ self-ratings of their own living conditions, ratings of their local government officials, ratings of the president and finally, their stated inclination to vote for the ruling party in the next election. (We are not able to subset these analyses according to local government control, however.)
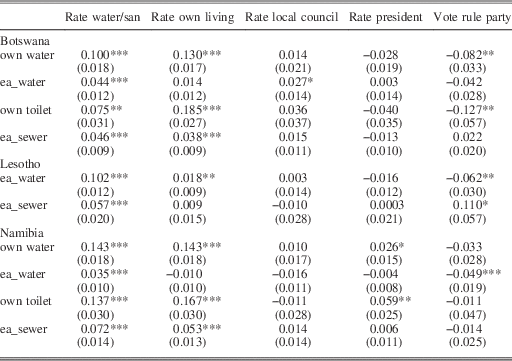
As summarized in Table 5, and elaborated in a series of more detailed tables in the Appendix, we find strikingly similar relationships in all three countries to what we find in the South African case. When individuals have access to water or toilet services in their own homes, or if water or sewerage infrastructure is available in the enumeration area in which the respondent resides, individuals are more likely to rate government water and sewerage services as being significantly better as compared with the ratings provided by those without such services.
Replicating Results in Other Southern African Democracies

***p<0.01; **p<0.05; *p<0.1.
Note: Cells report OLS regression estimates, with standard errors in parentheses. Each cell is from a separate country-level regression, and full tables are reported in the appendix.
However, as we move across the columns from left-to-right, from evaluation of services to support for incumbents, the effects generally shift from positive-to-negative. In particular, service provision is negatively associated with incumbent party support in eight of the ten estimates, four of which are significant at the 95 per cent level. As in South Africa, citizens in other Southern African democracies appear to be less likely to vote for the party in power when they report access to infrastructural service.
Discussion
Our empirical findings appear to challenge standard theories of electoral accountability. At both the aggregate level and the individual level, across four country cases, we find almost no evidence of any positive association between access to service delivery and intentions to vote for the incumbent party. This is particularly surprising in light of the fact that both our aggregate and individual-level measures of service provision are associated with self-reports of access to, and quality of, services. In other words, these services are visible to voters, and they attribute government effort to that service provision. However, this information does not positively predict a vote for the dominant incumbent party.
Can this collection of findings be interpreted as causal? Service delivery is clearly not randomly assigned, and our findings, both aggregate and micro, could possibly be confounded by factors that simultaneously affect changes/levels of service provision and changes/levels of voting-relevant attitudes and behaviors. For example, our results could be confounded if the purposeful strategy of South Africa’s ANC was to target service delivery in areas of growing discontent with its government such that, where we see increased service provision, we find declines in government support that was not itself a response to service delivery. Frankly, this seems implausible, particularly in light of the discussion presented earlier. Moreover, given the consistency of our results at the individual level, in which we control for municipality fixed effects, we do not believe it would be possible for the government to target services so narrowly in favor of possible discontents that this could be picked up in our analyses, and additional qualitative research (interviews with local analysts familiar with local government services and strategies) further convinces us of the unlikelihood of this alternative explanation. A final concern is that the results may be explained by the dynamics of electoral clientelism. ANC local elites, particularly in traditional authority areas, may trade off public goods against patronage goods, with the hope that more direct patronage may draw voters at higher rates.Footnote 48 We suspect that this dynamic does not drive our results, as our results are robust to excluding those provinces in which traditional authorities are most powerful.Footnote 49
Our central contribution has been to demonstrate a robust and counter-intuitive association in an important, natural setting, one that is substantively important for understanding the relationship between democratic governance and human development. We now attempt to explain why we may have observed these patterns in our data.
THEORETICAL ELABORATION: EXPLAINING THE WEAKNESS OF ELECTORAL ACCOUNTABILITY
While it is one thing to find that service delivery has no observable effect on attitudes or behaviors towards the incumbent, we find a negative association between service provision and incumbent voting. As discussed earlier, this may not be particularly surprising in localities controlled by the opposition if service provision is (perhaps deservedly) credited to that party. But the persistence of either null or negative relationships in incumbent-controlled areas demands further explanation. And as discussed earlier, we emphasize that we initiated our theorizing only after observing the surprising results. In this section, we outline and offer tentative probes of a range of plausible mechanisms, and here we focus on the South African case, again because of the richness of data available to us. Throughout these analyses we restrict our data to black South Africans in ANC-controlled municipalities only.
Relative Deprivation
One possible shortcoming of the conventional model of democratic accountability is that it does not calibrate preferences in a relational manner. Individuals’ overall satisfaction with government may be strongly conditioned by a sense of relative deprivation and privilege, which in turn tends to be affected by what others around them are receiving.Footnote 50 For example, it is possible that the aggregate results reflect intensified dissatisfaction among those without services in areas that are enjoying higher levels of service provision. In a similar vein, perhaps voters only reward the incumbent for infrastructural investment in services when such services are excludable, and when they are members of the group with access. That is, if almost everyone in the community enjoys services, the level of provision becomes ‘normalized’ and individual citizens may be less likely to reward the incumbent government.
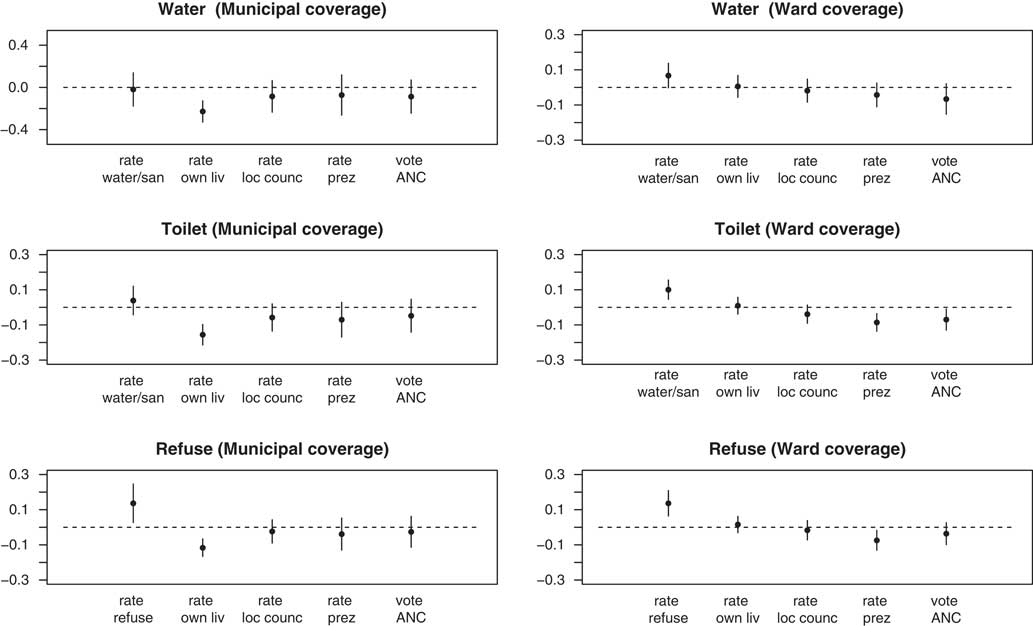
In order to assess this proposition, we consider how individual citizens respond to the outcomes analyzed above, but in response to changes in aggregate level service provision at the municipality and ward levels. As reported in Figure 4, we find some important similarities, and also some potentially revealing differences when compared with analyses of the effects of service provision at the household level. We find that higher levels of municipal coverage for individual i’s municipality and ward generally predict higher individual ratings of the respective government services. In general, vote intentions and ratings of local council or president are not strongly predicted at the individual level by these aggregate data (with few significant results), though the point estimates of the relationship with ANC vote intention are still uniformly negative.
Local-level service coverage effects on citizen attitudes and voting intentions. Note: Each panel presents estimated coefficients from five OLS regressions. In each regression, the titled service delivery item is the independent variable, and the survey response listed on the X-axis is the dependent variable. Each coefficient is estimated with survey wave fixed effects, and standard errors are calculated by clustering data at the municipality- or ward-level (depending on analysis). Lines represent 95% cluster-robust confidence intervals. Individual-level controls include gender, age, education-level, dummy variables for home language (Xhosa or Zulu, with other as missing category) and a dummy variable for urban residence; and at the municipal-level, we control for log of population. Recall that these regressions only include round 2, 2.5 and 5.

And yet, interestingly, those individuals living in municipalities with higher levels of service delivery are more likely to report substantially lower satisfaction with their individual living conditions. We do not observe this relationship with respect to ward-level data, which provides a more proximate portrait of the infrastructural environment in which the respondent resides. Clearly, this suggests, all else equal, that as municipal conditions improve, black South Africans are less likely to rate their own living conditions favorably, which is consistent with a ‘relative deprivation’ effect.
However, if relative deprivation were truly driving the core results with respect to voting intentions and behaviors, we would expect to observe a negative effect from service coverage levels on likelihood of ANC voting among those who lack services. In fact, we find that while higher levels of municipal-level service coverage are associated with lower self-ratings of individual living conditions and of living conditions compared to others, voting patterns trend in the opposite direction: amongst those without household services, better ward-level water coverage and toilet coverage is associated with a higher likelihood (not significant) of voting for the incumbent ANC. These results are presented in the Appendix. In short, we find mixed evidence with respect to a relative deprivation mechanism driving citizens away from the ANC.
Perceived Corruption
Separate from the quality of services delivered, perhaps voters are disappointed with the process of delivery. The actual provision of government services entails closer contact with government officials and government contractors. During the process of service installation, citizens may observe, or at least perceive, that politicians and those working for government are privately enriching themselves, either by legal or illegal means. Indeed, author interviews conducted in June 2015 with local councilors in South Africa revealed that councilors themselves are often the ones who make decisions about which firms will receive the government contracts (known as ‘tenders’) to deliver the services, and these decisions are frequently made based on personal connections and/or in exchange for private favors. When observed by constituents, this may lead to heightened discontent with the party in power. In the South African context, this explanation seems particularly plausible, and corruption is a central issue in the media and in political discourse.
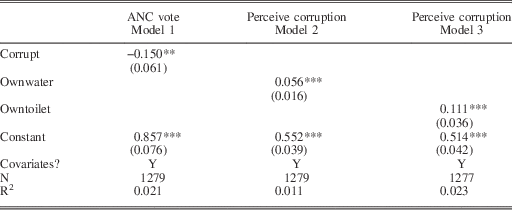
In fact, we find some evidence consistent with this mechanism. Again, when considering black voters in ANC-controlled localities, Table 6 shows that those who report perceiving corruption are substantially less likely to vote for the ANC, and secondly that those with access to water and toilets within their household tend to perceive higher rates of corruption than those without. Admittedly, this is only preliminary evidence of the plausibility of this mechanism – we cannot, from these analyses, demonstrate that these correlations are linked in a causal manner. But when combined with investigator-conducted interviews, these findings are highly suggestive.
Service Provision and Perceptions of Corruption (AB round 5 Data, Black Respondents in ANC-Controlled Municipalities)

***p<0.01; **p<0.05; *p<0.1.
Clustered (municipality) standard errors in parentheses.
Voter Strategies and Changing Expectations
The patterns we observe could occur because voters view the ANC as a party whose primary programmatic platform is to provide basic services. If that is so, those who have received services may feel that they no longer need the ANC to deliver, and may become less likely to vote for the ANC. On the flip-side, those without services may ‘double-down’ and vote for the ANC in the hopes that they too might receive services in the future.
Were this mechanism at work, we should find that those who have received services express different preferences for government action. In particular, they should be less likely to demand basic service provision, and those preferences ought to be good predictors of support for the incumbent. We find exactly this: those who have water access are less likely to list water as a government priority. Among those black citizens in ANC-controlled areas without any home water service, 10.8 per cent said that water should be a top priority for government, whereas just 5.2 per cent of those with home water said this should be a top priority.Footnote 51 We see this as suggestive evidence that this mechanism may be at work. Specifically, the results imply that voters are not using information about service provision to weed out ‘good’ politicians or parties from ‘bad’. Rather, they are using this information to calibrate their expectations of the party’s programmatic platforms. For voters who already benefit from basic service provision this core program is less valuable, and they will not be motivated to vote for it.
CONCLUSION
Our motivation for this study was to investigate the electoral implications of the recent expansion of infrastructural services in an important democratic region. We test a core assumption underlying most theories of electoral accountability. Specifically, a powerful normative justification for democratic government is that voters should hold politicians responsible for service delivery. And by voting for the incumbent where service delivery has occurred, this will send a clear feedback signal to governments, and help to sort the quality of elected leaders. Our analysis demonstrates that reality deviates substantially from such straightforward predictions: in South Africa, voters who receive services, whether in incumbent- or opposition-controlled localities, are generally less likely to support the dominant ANC party. This basic pattern – what we call ‘nuanced accountability’ – appears to hold in the other three regional democracies, Botswana, Lesotho and Namibia.
The broader implication of these findings – whether they are ‘good’ or ‘bad’ news for the welfare-enhancing effects of democratic governance – depend on the mechanism that explains this pattern, and how political parties react to evidence of declining incumbent support in the wake of service expansion. One dismal prediction is that parties in power could infer that service delivery is counter-productive for returning to power. If incumbents are punished because improvements lead to feelings of ‘relative deprivation’, they might choose to keep everyone deprived. But we find only mixed support for that account.
On the other hand, if the quality of service provision in opposition-controlled localities is a key driver of even national election vote choices, that may bode well for competitive democracy and provide some challenge to the notion of an ‘incumbency advantage’. Within incumbent-controlled localities, if the mechanism is ‘changing expectations’, it could be the case that incumbent parties will work even harder to meet those demands in a timely manner in order to maintain and to build electoral support. And if corruption is attenuating the effect of electoral gains from service delivery, perhaps parties in power will work harder to control such behavior. What is clear is that voters are responsive to changes in service delivery, but we find that the ways in which they respond are more nuanced than previously understood. While loyalties for revolutionary/liberation parties, and racial/ethnic identities are surely still important predictors of voting behavior, our findings contribute to an emerging literature highlighting that African voters are also driven by programmatic concerns. Additional research will be needed to more definitively address the questions of why voters have behaved in the manner we find, and with what consequences for government action.
Finally, it is worth asking whether the Southern African context is exceptional, and whether we should expect similar or different outcomes in other countries? Other young democracies across the world share many of the region’s characteristics: ruled by dominant parties, profoundly unequal and racially or ethnically polarized. Whether or not citizens in other countries react to the delivery of services in the same manner is a pressing question that should be addressed.