Nomenclature
-
 $\alpha $
-
angle-of-attack, degree
-
$\beta $
-
sideslip angle, degree
-
$\mu $
-
bank angle, degree
-
$p$
-
roll rate, degree·s-1
-
$q$
-
pitch rate, degree·s-1
-
$r$
-
yaw rate, degree·s-1
-
${\delta _a}$
-
right elevon angular deflection, degree
-
${\delta _e}$
-
left elevon angular deflection, degree
-
${\delta _r}$
-
rudder angular deflection, degree
-
$Q$
-
dynamic pressure, pa
-
$S$
-
reference area, ft2
-
$b$
-
lateral-directional reference length, ft
-
$c$
-
longitudinal reference length, ft
-
${\rm{C}}_l^{\delta a}$
-
rolling moment increment coefficient for right elevon
-
${\rm{C}}_l^{\delta e}$
-
rolling moment increment coefficient for left elevon
-
${\rm{C}}_l^{\delta r}$
-
rolling moment increment coefficient for rudder
-
$C_m^{\delta a}$
-
pitching moment increment coefficient for right elevon
-
$C_m^{\delta e}$
-
pitching moment increment coefficient for left elevon
-
$C_m^{\delta r}$
-
pitching moment increment coefficient for rudder
-
$C_n^{\delta a}$
-
yawing moment increment coefficient for right elevon
-
$C_n^{\delta e}$
-
yawing moment increment coefficient for left elevon
-
$C_n^{\delta r}$
-
yawing moment increment coefficient for rudder
-
$C_L^\alpha $
-
lift increment coefficient for
$\alpha $
-
$C_Y^\beta $
-
side force coefficient for
$\beta $
-
$C_L^{\delta a}$
-
lift increment coefficient for right elevon
-
$C_L^{\delta e}$
-
lift increment coefficient for left elevon
-
$C_Y^{\delta r}$
-
side force increment coefficient for rudder
-
${I_x},{I_y},{I_z}$
-
roll, pitch and yaw moments of inertia respectively, slg-ft2
- AFAC
-
adaptive fixed-time anti-saturation compensator
- DO
-
disturbance observer
- ESD
-
Oextend state disturbance observer
- FTD
-
finite-time tracking differentiator
- HFV
-
hypersonic flight vehicle
- NDO
-
nonlinear disturbance observer
- NN
-
neural network
- NN-ABC
-
NN-based anti-saturation backstepping control
- PSMC
-
predictive sliding mode control
- RBFNNDO
-
radial basis function neural network disturbance observer


1.0 Introduction
Hypersonic flight vehicle (HFV) can fly faster than Mach 5 with its altitude typically ranging from 20 to 100 km [Reference Ding, Yue and Chen1, Reference Liu, Lin, Wang, Huang, Yan and Li2], and its time-varying dynamic model is also featured with the characteristics of strong coupling, nonlinearity and multisource uncertainties. The above characteristics pose great challenges to the designing of HFV controllers [Reference Liu, Lin, Huang and Yan3, Reference An, Wang, Huang and Liu4]. Unfortunately, the linear flight control methods for HFVs have certain limitations, for which reason related studies on nonlinear control methods are required for HFVs. In recent years, most of the existing studies primarily focused on nonlinear control methods such as backstepping control [Reference Yang, Shao and Shi5, Reference Sartori, Quagliotti, Rutherford and Valavanis6], sliding mode control [Reference Wang, Zong and Su7–Reference Liu, Lin, Huang and Yan9], intelligent control [Reference Ning, Cao, Han, Wang and Yin10, Reference Zhang, Wang, Tang and Bao11], adaptive control [Reference Han, Zhang, Hu, Shin and Wang12, Reference Li, Wen and Zhou13], fault tolerant control [Reference Han, Hu, Shin, Tsourdos and Xin14], etc.
The backstepping control method is a typical nonlinear approach based on Lyapunov stability control theory. The backstepping control method has been widely applied in various research fields. In 2019, Sun et al. developed nonsmooth backstepping controllers for the altitude and velocity subsystems to achieve a fixed-time convergence [Reference Sun, Pu and Yi15]. This approach is capable of filtering out noises and acquiring uncertainty estimations while ensuring tracking accuracy. Later in 2022, Zhao et al. [Reference Zhao, Jiang and Yang16] proposed a decentralised actuator fault compensation scheme for HFV using model transformation based backstepping control method. It must be noted that backstepping control requires calculating the derivative of virtual control signal, which may result in explosion of complexity [Reference Xia, Zhang, Feng, Wang and Zhuang17]. In order to solve the above problem, command filters are utilised to approximate the output of the filter to the derivative of the virtual control variable [Reference Farrell, Polycarpou and Sharma18–Reference Yu, Shi and Zhao20]. It is known that the command-filter-based backstepping control method can only ensure that the system is bounded, the convergence region may still be affected by the tracking error of the filter.
Since the control system is susceptible to external disturbances and uncertainties, the technology of disturbance observer (DO) has been developed to enable anti-disturbance capability for the controller. Researchers use disturbance observers to compensate for tracking errors brought by external disturbances and to ensure the stability and dynamic performance of the closed-loop dynamic system. In 2012, Zong et al. investigated a hybrid control framework that combined a nonlinear disturbance observer (NDO) with backstepping for controlling the flight of HFV [Reference Zong, Ji, Zeng and Liu21]. Cheng et al. proposed a new disturbance suppression scheme in 2017 to address the problem of uncertainty, which firstly used predictive sliding mode control (PSMC) to reduce the mismatch model uncertainty of the outer loop subsystem, and then proposed a PSMC based on NDO to solve the mismatch disturbance problem of the inner loop subsystem [Reference Cheng, Wang and Tang22]. Subsequently, Wang et al. designed a non-singular fast terminal sliding mode controller based on finite time NDO to eliminate disturbance observation and trajectory errors [Reference Wang, Karimi and Li23]. Neural network (NN) is also an effective approach for eliminating disturbances due to its excellent uncertainty approximation capabilities [Reference An, Wang, Huang and Liu24]. Bu et al. utilised fuzzy wavelet neural networks to estimate unknown flight dynamics to guarantee the robustness of hybrid controllers. Based upon deep belief network [Reference Bu and Lei25], Sun et al. proposed a semi-supervised controller in the presence of unknown external disturbances [Reference Sun, Xu and Wu26]. Although the existing studies achieve uncertainty estimation, there remains a lack of effort in reducing the computational overhead of neural approximation.
When the actuator of HFV is unable to follow the growth control law due to physical limitations during flight, the saturation will occur, which will cause the misfunction of HFV controller and produce severe consequences [Reference Sun and Song27]. Currently, the prevailing anti-saturation methods include one-step approach [Reference Dong, Liu and Wang28, Reference Zhang, Ma and Wang29] and anti-saturation compensation approach [Reference Bu, Wu and Wei30, Reference An, Liu and Wang31]. The former is relatively conservative and may restrict the performance of the controller, whereas the latter introduces an anti-saturation compensator in the nominal controller. Despite that introducing auxiliary variable into the compensator can quickly release the actuator from saturation while ensuring system stability, however, the presence of auxiliary variable can affect the convergence characteristics of the nominal controller. In addition, adopting general nominal compensators only make the auxiliary variable converge asymptotically or exponentially.
In this study, we design a novel RBFNNDO-based anti-saturation backstepping controller for HFVs with input saturations. We introduce a novel finite-time tracking differentiator (FTD) to compute derivatives of virtual control laws and flow angle commands, offering higher accuracy compared to traditional command filters. Furthermore, considering the universal approximation characteristics of radial basis function neural networks (RBFNN), we design an adaptive RBFNN disturbance observer (RBFNNDO) to approximate and compensate for the total disturbances of the system. In addition, we adopt a new type of adaptive fixed-time anti-saturation compensator (AFAC) [Reference Ding, Yue and Liu32] to make that the auxiliary variables have a fixed-time convergence. The key contributions of this study can be summarised as follows.
Firstly, we establish a 6-degrees-of-freedom (6-DOF) control-oriented HFV model with input saturations and uncertain disturbances, to which the forms of input saturations and the specific equations for uncertain disturbance terms are presented.
Secondly, compared to the extended state disturbance observer (ESDO) presented in Ref. (Reference Zhong, Zhao and Liu35), we introduce a RBFNNDO to observe the total disturbance and compensate for it within the controller, which can enhance the accuracy of observation error.
Thirdly, in contrast to existing research, such as that presented in Ref. (Reference An, Liu and Wang31), which primarily concentrates on anti-saturation strategies for the longitudinal model of hypersonic vehicles, the multivariable compensator employed in this study offers a significant advancement. This compensator is capable of simultaneously mitigating the saturation effects across three actuators and exhibits a fixed-time convergence characteristic.
The remainder of this paper is organised as follows. Section 2 introduces a control-oriented model of HFV. Section 3 highlights the design of NN-ABC, including the design of RBFNNDO, FTD and AFAC, presenting stability analysis for the controller. Section 4 designs comparative simulation experiments and provides corresponding results, by which the performance of our proposed method has been verified. Section 5 summarises conclusions of this study and outlines our future research interest.
2.0 Problem description and preliminaries
2.1 HFV model
According to Refs [Reference Keshmiri, Mirmirani and Colgren33–Reference Zhong, Zhao and Liu35], the control-oriented model for HFVs is denoted by
 \begin{align}\left\{ \begin{array}{c}{\boldsymbol{{\dot {\Omega}} }} = {{\boldsymbol{f}}_{\boldsymbol{\Omega}}} + {{\boldsymbol{g}}_{\boldsymbol{\Omega}}}{\boldsymbol{\omega}}+ {{\boldsymbol{\Delta}} _{\boldsymbol{\Omega }}}\\[3pt]{\dot {\boldsymbol{\omega }}} = {{\boldsymbol{f}}_{\boldsymbol{\omega}}} + {{\boldsymbol{g}}_{\boldsymbol{\omega}}} {\boldsymbol{u}} + {{\boldsymbol{\Delta}} _{\boldsymbol{\omega} }}\end{array} \right.. \end{align}
In (1),
 ${\boldsymbol{\Omega }} = {[\alpha ,\beta ,\mu ]^T}$
denotes the vector of three flow angles,
 $\omega = {[p,q,r]^T}$
denotes the vector of three angular velocities, and
 $ {\boldsymbol{u}} = {[{\delta _a},{\delta _e},{\delta _r}]^T}$
denotes the vector of three-channel control inputs,
 ${{\boldsymbol{\Delta }}_{\boldsymbol{\Omega }}}$
and
 ${{\boldsymbol{\Delta}} _{\boldsymbol{\omega} }}$
denote the disturbances in flow angles and angular velocities, respectively.
 ${{\boldsymbol{g}}_{\boldsymbol{\Omega}}}$
and
 ${{\boldsymbol{g}}_{\boldsymbol{\omega}}}$
can be expressed as
 \begin{align}{{\boldsymbol{g}}_{\boldsymbol{\Omega}}} = \left[ {\begin{array}{ccc}{ - \tan \beta \cos \alpha }&1&{ - \tan \beta \sin \alpha }\\[4pt]{\sin \alpha }&0&{ - \cos \alpha }\\[4pt]{\sec \beta \cos \alpha }&0&{\sec \beta \sin \alpha }\end{array}} \right],{{\boldsymbol{g}}_{\boldsymbol{\omega}}} = \left[ {\begin{array}{ccc}{\dfrac{{QSb{\rm{C}}_l^{\delta a}}}{{{I_x}}}}&{\dfrac{{QSb{\rm{C}}_l^{\delta e}}}{{{I_x}}}}&{\dfrac{{QSb{\rm{C}}_l^{\delta r}}}{{{I_x}}}}\\[10pt]{\dfrac{{QScC_m^{\delta a}}}{{{I_z}}}}&{\dfrac{{QScC_m^{\delta e}}}{{{I_z}}}}&{\dfrac{{QScC_m^{\delta r}}}{{{I_z}}}}\\[10pt]{\dfrac{{QSbC_n^{\delta a}}}{{{I_y}}}}&{\dfrac{{QSbC_n^{\delta e}}}{{{I_y}}}}&{\dfrac{{QSbC_n^{\delta r}}}{{{I_y}}}}\end{array}} \right] \end{align}
 ${{\boldsymbol{f}}_{\boldsymbol{\Omega}}}$
and
 ${{\boldsymbol{f}}_{\boldsymbol{\omega}}}$
can be expressed as
 \begin{align}{{\boldsymbol{f}}_{\boldsymbol{\Omega}}} = \left[ \begin{array}{l}\dfrac{{mg\cos \mu \cos \theta - QSC_L^\alpha }}{{m{V_b}\cos \beta }}\\[12pt]\dfrac{{mg\cos \theta \sin \mu + QSC_Y^\beta \beta \cos \beta }}{{m{V_b}}}\\[12pt]\dfrac{{ - mg\cos \mu \cos \theta \tan \beta + QS\left[ \begin{array}{l}C_L^\alpha \tan \theta \sin \mu + C_L^\alpha \tan \beta \\ [4pt]+ C_Y^\beta \beta \cos \beta \tan \theta \cos \mu \end{array} \right]}}{{m{V_b}}}\end{array} \right], \, {{\boldsymbol{f}}_{\boldsymbol{\omega}}} = \left[ \begin{array}{l}\dfrac{{{l_0} - qr\left( {{I_z} - {I_y}} \right)}}{{{I_x}}}\\[10pt]\dfrac{{{m_0} - pr\left( {{I_x} - {I_z}} \right)}}{{{I_y}}}\\[10pt]\dfrac{{{n_0} - pq\left( {{I_y} - {I_x}} \right)}}{{{I_z}}}\end{array} \right] .\end{align}
In (2) and (3),
 ${l_0}$
,
 ${m_0}$
and
 ${n_0}$
represent the aerodynamic moments.
 $m$
,
 $\theta $
denote the mass of aircraft and flight path angle, and the other variables in model are given in nomenclature. Then, the disturbances
 ${{\boldsymbol{\Delta}} _{\boldsymbol{\Omega} }} = {[{{\rm{\Delta }}_\alpha },{{\rm{\Delta }}_\beta },{{\rm{\Delta }}_\mu }]^T}$
and
 ${{\boldsymbol{\Delta}} _{\boldsymbol{\omega} }} = {[{{\rm{\Delta }}_p},{{\rm{\Delta }}_q},{{\rm{\Delta }}_r}]^T}$
can be expressed as
 \begin{align}\left\{ \begin{array}{l}{\Delta _\alpha } = - \dfrac{{QS\left( {C_L^{\delta a} + C_L^{\delta e} + \Delta {C_L}} \right)}}{{m{V_b}\cos \beta }} + {d_\alpha }\\[12pt]{\Delta _\beta } = \dfrac{{QS\left( {C_Y^{\delta r}\cos \beta + \Delta {C_Y}} \right)}}{{m{V_b}}} + {d_\beta }\\[12pt]{\Delta _\mu } = \dfrac{{QS\left( {C_L^{\delta a} + C_L^{\delta e} + \Delta {C_L}} \right)\left( {\tan \beta + \tan \theta \sin \mu } \right) + \left( {QS\left( {C_Y^{\delta r}\cos \beta + \Delta {C_Y}} \right)} \right)\tan \theta \cos \mu }}{{m{V_b}}} + {d_\mu }\\[12pt]{\Delta _p} = \Delta {C_l}qsb + {d_p}\\[12pt]{\Delta _q} = \Delta {C_m}qsc + {d_q}\\[12pt]{\Delta _r} = \Delta {C_n}qsb + {d_r}\end{array} \right., \end{align}
where
 ${d_i}(i = \alpha ,\beta ,\mu ,p,q,r)$
represents the external disturbances.
The control input is bounded due to structural limitations, which is expressed as
 \begin{align}{u_i} = sat\left( {{u_{ci}}} \right),\quad i = a,e,r. \end{align}
In (5),
 ${\boldsymbol{u}_c}$
is the ideal command calculated by the control law. The deviation vector between the actual and ideal command of control input is defined as
 \begin{align}\Delta {\boldsymbol{u}} = {\boldsymbol{u}} - {{\boldsymbol{u}}_{\bf{c}}} \end{align}
2.2 Preliminaries
Consider the system of differential equations [Reference Polyakov39]
 \begin{align}\dot x = f(t,x),x(0) = {x_0} \end{align}
where
 $x \in {\mathbb{R}^n}$
and
 $f\,:\,{\mathbb{R}_ + } \times {\mathbb{R}^n} \to {\mathbb{R}^n}$
is a nonlinear function. Suppose the origin is an equilibrium point of (7).
Definition 1. The origin of (7) is said to be globally finite-time stable if it is globally asymptotically stable and any solution
 $x\left( {t,{x_0}} \right)$
of (7) reaches the origin at some finite moment, i.e.,
 $x\left( {t,{x_0}} \right) = 0$
,
 $\forall t \geq T\left( {{x_0}} \right)$
, where
 $T\,:\,{\mathbb{R}^n} \to {\mathbb{R}_ + } \cup 0$
is the settling time function.
Definition 2. The origin (7) of is said to be fixed-time stable if it is globally finite-time stable and the settling time function
 $T\left( {{x_0}} \right)$
is bounded, i.e.,
 $\exists {T_{\max }}\gt 0:T\left( {{x_0}} \right) \le {T_{\max }},\forall {x_0} \in {\mathbb{R}^n}$
.
Lemma 1. Consider the following nonlinear system [Reference Zhao, Feng and Cui34]
 \begin{align}\left\{ \begin{array}{l}{{\dot {\boldsymbol{z}}}_1} = - {\xi _1}si{g^{{\alpha _1}}}\left( {{\boldsymbol{z}_1}} \right) + {{\boldsymbol{z}}_2}\\[4pt]{{\dot {\boldsymbol{z}}}_2} = - {\xi _2}si{g^{{\alpha _2}}}\left( {{\boldsymbol{z}_1}} \right) - p\end{array} \right.{\rm{ }},{\rm{ }}\left| p \right| \le \bar p, \end{align}
where
 ${\xi _1},{\xi _2} \gt 0$
,
 ${\alpha _1} \in (0.5,1)$
,
 ${\alpha _2} = 2{\alpha _1} - 1$
, p is a bounded constant. The system defined in (8) is finite-time stable, the residual set of the solution
 ${D_0}$
and the settling time
 ${T_0}$
are bounded [Reference Zhong, Zhao and Liu35], which can be expressed by
 \begin{align}\begin{array}{l}{D_0} = \left\{ {\left. \varepsilon \right|V(\varepsilon ) \lt {{\left( {\dfrac{{{M_2}}}{\theta }} \right)}^{2{\alpha _1}/{\alpha _2}}}} \right\},\theta \in \left( {0,{M_1}} \right)\\[14pt]{T_0} \le \left[ {\dfrac{{V{{\left( {{{\boldsymbol{\varepsilon }}_0}} \right)}^{1 - \sigma }}}}{{\left( {{M_1} - \theta } \right)\left( {1 - \sigma } \right)}}} \right]\end{array}, \end{align}
where
 $\sigma = ({\alpha _1} + {\alpha _2})/2{\alpha _1}$
, and the definition of
 ${M_1}$
and
 ${M_2}$
can be found in Ref. (Reference Zhao, Feng and Cui34).
Lemma 2. Consider the following nonlinear system [Reference Zhong, Zhao and Liu35, Reference Zuo and Tie36]
 \begin{align}\dot \sigma = - {k_1}si{g^{{q_1}}}\left( \sigma \right) - {k_2}si{g^{{q_2}}}\left( \sigma \right),\sigma \left( 0 \right) = {\sigma _0}, \end{align}
where
 $0 \lt {q_1} \lt 1$
,
 ${q_2} \gt 1$
,
 ${k_1},{k_2} \gt 0$
,
 $si{g^q}(\sigma )$
denotes
 ${[|{\sigma _1}{|^q}\,{\rm{sign(}}{\sigma _1}{\rm{)}}, \cdots ,|{\sigma _n}{|^q}\,{\rm{sign(}}{\sigma _n}{\rm{)}}]^T}$
. The system given by (7) exhibits fixed-time stability [Reference Zhong, Zhao and Liu35], and the settling time
 $T({\sigma _0})$
is bounded, which can be expressed by
 \begin{align}T\left( {{\sigma _0}} \right) \le {T_{\max }} = \frac{1}{{{k_1}\left( {1 - {q_1}} \right)}} + \frac{1}{{{k_2}\left( {{q_2} - 1} \right)}}. \end{align}
3.0 Controller law design and stability assessment
The configurations of NN-ABC controllers are described in detail in the following five sections. The structure of NN-ABC is demonstrated in Fig. 1.
Schematic diagram demonstrating the structure of NN-ABC controller.

3.1 Designing neural network disturbance observer
The RBFNN can be designed as a disturbance observer to estimate the unknown and bounded function
 $D\left( x \right) \in {R^m}$
[Reference Wang, Guo and Tang37], which can be expressed as
 \begin{align}D({\boldsymbol{x}}) = {{\boldsymbol{W}}^{*T}}\Phi ({\boldsymbol{x}}) + {\boldsymbol{\varepsilon }} \end{align}
In (12),
 ${\boldsymbol{\varepsilon}} \in {R^m}$
represents the approximation error vector,
 ${{\boldsymbol{W}}^{*}} \in {R^{n \times m}}$
represents the ideal weight matrix and is designed as
 \begin{align}{{\boldsymbol{W}}^{*}} = \mathop {\arg \min }\limits_{\hat{ W}} \left\{ {\mathop {\sup }\limits_{x \in {R^a}} \left| {D\left( x \right) - {{\boldsymbol{W}}^{T}}\Phi \left( x \right)} \right|} \right\}\!. \end{align}
In (13),
 $\hat W$
denotes the estimate of
 ${{\boldsymbol{W}}^{*}}$
,
 $x \in {R^a}$
denotes the input vector,
 $n\left( { \gt 1} \right)$
denotes the number of neural network neurons (nodes),
 ${\bf{\Phi (x)}} = {\left[ {{\boldsymbol{\Phi}_{1}}({\boldsymbol{x}}),{{\boldsymbol{\Phi}}_{2}}({\boldsymbol{x}}), \ldots {\Phi _n}({\boldsymbol{x}})} \right]^T}$
denotes the radial basis function vector,
 ${\Phi _i}\left( x \right)$
denotes the output of the i-th Gaussian function expressed by
 \begin{align}{\Phi _i}\left( x \right) = \exp \left( { - \frac{{{{\left\| {x - {\sigma _i}} \right\|}^2}}}{{2b_i^2}}} \right). \end{align}
In (14),
 ${\sigma _i} \in {R^n}$
and
 ${b_i} \gt 0$
denote the centre and the width of this Gaussian function, respectively.
In this case, two RBFNN disturbance observers are designed to estimate the lumped disturbances in (1), which are expressed as
 \begin{align}\begin{array}{l}{{\boldsymbol{\Delta}} _{\boldsymbol{\Omega }}} = {{\boldsymbol{W}}_{1}}{{^ {*}}{ ^{T}}}{\boldsymbol{\Phi}_{1}}\left( {{\boldsymbol{\xi}}_{1}} \right) + {\boldsymbol{\varepsilon }_1}\\[6pt]{{\boldsymbol{\Delta}} _{\boldsymbol{\omega} }} = {{\boldsymbol{W}}_{2}}{{^ *} {^T}}{{\boldsymbol{\Phi}}_{2}}\left( {{\boldsymbol{\xi}}_{2}} \right) + {\boldsymbol{\varepsilon }_2}\end{array}, \end{align}
where
 ${{\boldsymbol{W}}_{1}}^ * $
and
 ${{\boldsymbol{W}}_{2}}^ * \in {R^{n \times 3}}$
denote the ideal weight matrices,
 ${\xi _1}$
and
 ${\xi _2}$
denote the input vectors to be designed,
 ${\boldsymbol{\varepsilon }_1}$
and
 ${\boldsymbol{\varepsilon }_2} \in {R^{3 \times 1}}$
denote the approximation error vectors.
Remark 1. Owing to the finite dimensional hidden layer of the RBFNN, the approximation error exists [Reference Wang, Guo and Tang37]. Besides, the approximation errors
 ${\boldsymbol{\varepsilon }_1}$
and
 ${\boldsymbol{\varepsilon }_2}$
can be bounded when appropriate number of neurons and appropriate centre and width of the Gaussian function are selected.
Remark 2. In order to enhance the estimation accuracy and performance effectiveness of the RBFNN in identifying and accurately quantifying system perturbations, this study adopts the system error term, the internal state variable and the external excitation signal to form the input feature vector.
3.2 Finite-time tracking differentiator design
Assumption 1. Considering engineering practice, assume the flow angle commands be
 ${{\boldsymbol{\Omega }}_c}$
, the virtual control signals be
 ${\boldsymbol{\omega_{c}}}$
, and their second derivatives are bounded.
In this subsection, FTDs are designed to approximate the derivatives of flow angle commands and virtual control signals, which can be expressed as
 \begin{align}\begin{array}{l}\left\{ \begin{array}{l}{{\dot {\hat {\boldsymbol{\Omega}}}} _c}(t) = {\boldsymbol{\lambda} _{\bf{1}}}(t) - {l_1}si{g^{{\alpha _1}}}\left( {{{{\boldsymbol{\hat {\Omega }}}}_c} - {{\boldsymbol{\Omega }}_c}} \right),\,\,{{\boldsymbol{\Omega }}_c} = \left( {{\alpha _{cmd}},{\beta _{cmd}},{\mu _{cmd}}} \right)\\[6pt]{{\dot {\boldsymbol{\lambda}}} _{\bf{1}}}(t) = - {l_2}si{g^{{\alpha _2}}}\left( {{{{\boldsymbol{\hat {\Omega }}}}_c} - {{\boldsymbol{\Omega }}_c}} \right)\end{array} \right.\\[16pt]\left\{ \begin{array}{l}{{\dot {\hat {\boldsymbol{\omega}}}} _c}(t) = {\boldsymbol{\lambda} _{\bf{2}}}(t) - {l_3}si{g^{{\beta _1}}}\left( {{{\boldsymbol{\hat {\omega }}}_c} - {\boldsymbol{\omega_{c}}}} \right),\,\,{\boldsymbol{\omega_{c}}} = \left( {{p_{cmd}},{q_{cmd}},{r_{cmd}}} \right)\\[6pt]{{\dot {\boldsymbol{\lambda}}} _{\bf{2}}}(t) = - {l_4}si{g^{{\beta _2}}}\left( {{{\boldsymbol{\hat {\omega }}}_c} - {\boldsymbol{\omega_{c}}}} \right)\end{array} \right.\end{array}, \end{align}
where
 ${l_i} \gt 0\,{\rm{ }}(i = 1, \ldots ,\,\,4)$
,
 ${\alpha _1},{\beta _1} \in (0.5,1)$
,
 ${\alpha _2} = 2{\alpha _1} - 1$
,
 ${\beta _2} = 2{\beta _1} - 1$
,
 ${\boldsymbol{\lambda} _{\bf{1}}}$
and
 ${\boldsymbol{\lambda} _{\bf{2}}}$
represent the derivatives of the flow angle commands and virtual control laws estimated by the two FTDs indicated in (16).
Theorem 1. The derivatives of
 ${{\boldsymbol{\Omega }}_c}$
and
 ${\boldsymbol{\omega_{c}}}$
can be precisely approximated by the FTDs designed in (16) in finite time, based upon which the approximation errors will converge to a small region near the origin.
Proof: The error variables of FTDs can be defined as
 \begin{align}\begin{array}{l}\left\{ \begin{array}{l}{{\boldsymbol{E}}_{\bf{1}}} = {{{\boldsymbol{\hat {\Omega }}}}_c} - {{\boldsymbol{\Omega }}_c}\\[4pt]{\boldsymbol{E}_{2}} = {\boldsymbol{\lambda} _{\bf{1}}} - {{{\boldsymbol{{\dot {\Omega}} }}}_c}\end{array} \right.\\[14pt]\left\{ \begin{array}{l}{\boldsymbol{E}_{3}} = {{\boldsymbol{\hat {\omega }}}_c} - {\boldsymbol{\omega_{c}}}\\[4pt]{\boldsymbol{E}_{4}} = {\boldsymbol{\lambda} _{\bf{2}}} - {\boldsymbol{\dot {\boldsymbol{\omega }}}_c}\end{array} \right.\end{array}. \end{align}
The error dynamic system can be obtained by differentiating both sides of (17), which can be written as
 \begin{align}\begin{array}{l}\left\{ \begin{array}{l}{{\dot {\boldsymbol{E}}}_{\bf{1}}} = - {l_1}si{g^{{\alpha _1}}}\left( {{{\boldsymbol{E}}_{\bf{1}}}} \right) + {{\boldsymbol{E}}_{\bf{2}}}\\[4pt]{{\dot {\boldsymbol{E}}}_2} = - {l_2}si{g^{{\alpha _2}}}\left( {{{\boldsymbol{E}}_{\bf{1}}}} \right) - {{{\boldsymbol{\ddot \Omega }}}_c}\end{array} \right.\\[15pt]\left\{ \begin{array}{l}{{\dot {\boldsymbol{E}}}_3} = - {l_3}si{g^{{\beta _1}}}\left( {{\boldsymbol{E}}_{3}} \right) + {\boldsymbol{E}_{4}}\\[4pt]{{\dot {\boldsymbol{E}}}_4} = - {l_4}si{g^{{\beta _2}}}\left( {{\boldsymbol{E}_{3}}} \right) - {{\ddot{\boldsymbol{\omega}}}_c}\end{array} \right.\end{array}. \end{align}
The approximation errors
 ${{\boldsymbol{E}}_i}\left( {i = 1,2,3,4} \right)$
can converge to a small region near the origin in finite time according to Lemma 1. In other words, the derivatives of the flow angle commands and virtual control signals can be precisely approximated within finite time, thereby validating the proof.
3.3 Designing adaptive fixed-time anti-saturation compensator
The AFAC [Reference Ding, Yue and Liu32, Reference Zhong, Zhao and Liu35] is introduced to deal with the problem of input saturations, which is expressed as
 \begin{align}\dot {\boldsymbol{\chi}} = - {k_{\chi 1}}{L_\chi }si{g^{{a_{\chi 1}}}}\left( {\boldsymbol{\chi}} \right) - {k_{\chi 2}}{L_\chi }si{g^{{a_{\chi 2}}}}\left( {\boldsymbol{\chi}} \right) + {{\boldsymbol{g}}_{\boldsymbol{\omega}}}{\boldsymbol{\Delta }}u, \end{align}
where
 ${a_{\chi 1}} \in \left( {0,1} \right)$
,
 ${a_{\chi 2}} \gt 1$
,
 ${k_{\chi 1}} \gt 0$
,
 ${k_{\chi 2}} \gt 0$
, and
 $\chi = {[{\chi _1}{\rm{ }}{\chi _2}{\rm{ }}{\chi _3}]^T}$
denotes the auxiliary variable introduced in the angular rate loop, which can be used in the control law calculation in the following subsection 3.4. The
 ${L_\chi }$
denotes the positive adaptive gain [Reference Zhong, Zhao and Liu35], and the adaptive law of
 ${L_\chi }$
can be described by
 \begin{align}\begin{array}{l}{{\dot L}_\chi } = \left\{ \begin{array}{l} - {k_{L\chi 1}}{L_\chi } - {k_{L\chi 2}}L_\chi ^{\frac{1}{2}} + {k_{L\chi 1}}{P^L}, \quad\qquad\, {\boldsymbol{ \Delta }}u \ne 0\\[4pt]Pro{j_{{L_\chi }}}\left( {{k_{L\chi 3}}L_\chi ^{{a_{L\chi 1}}} + {k_{L\chi 4}}L_\chi ^{ - {a_{L\chi 2}}} + {c_L}} \right)\!,{\boldsymbol{\Delta }}u = 0\end{array} \right.\\[20pt]Pro{j_{{L_\chi }}}( \bullet ) = \left\{ \begin{array}{l}0\quad{\rm{ if }}\quad{L_\chi } = {P^U}\quad{\rm{ and }} \quad\bullet \geq 0\\[4pt]0\quad{\rm{ if }}\quad{L_\chi } = {P^L}\quad{\rm{ and }} \quad\bullet \le 0\\[4pt] \bullet \quad{\rm{ otherwise}}\end{array} \right.\end{array} \end{align}
where
 ${k_{L\chi 1}}$
,
 ${k_{L\chi 2}}$
,
 ${k_{L\chi 3}}$
,
 ${k_{L\chi 4}}$
,
 ${a_{L\chi 1}}$
,
 ${a_{L\chi 2}}$
and
 ${c_L}$
denote the positive design parameters,
 ${P^U}$
and
 ${P^L}$
denote the upper and lower bounds of
 ${L_\chi }$
, respectively. Detailed explanations and discussions can be found in Refs [Reference Ding, Yue and Liu32] and [Reference Zhong, Zhao and Liu35].
3.4 Controller law design
Step 1:
Define the deviation variable of the command variables as
 ${\boldsymbol{z}_{\bf{1}}} = {\boldsymbol{\Omega }} - {{\boldsymbol{\Omega }}_c}$
, and its derivative is determined by
 \begin{align}{\dot{\boldsymbol{z}}_{\bf{1}}} = {\boldsymbol{{\dot {\Omega}} }} - {{\boldsymbol{{\dot {\Omega}} }}_c} = {f_{\boldsymbol{\Omega }}} + {\boldsymbol{g}_{\boldsymbol{\Omega }}}{\boldsymbol{\omega}}+ {{\boldsymbol{\Delta }}_{\boldsymbol{\Omega }}} - {{\boldsymbol{{\dot {\Omega}} }}_c}. \end{align}
Therefore, the virtual control law for angular rates to track is established as
 \begin{align}{\boldsymbol{\omega_{c}}} = \boldsymbol{g}_{\boldsymbol{\Omega }}^{ - 1}\left( { - {K_1}{\boldsymbol{z}_{\bf{1}}} - {f_{\boldsymbol{\Omega }}} - {{\hat{\boldsymbol{W}}}_1}^T{\boldsymbol{\Phi}_{1}}\left( {{\boldsymbol{\xi}}_{1}} \right) + {\boldsymbol{\lambda} _{\bf{1}}}} \right), \end{align}
where
 ${K_1}$
denotes a positive parameter,
 ${\hat{\boldsymbol{W}}_{1}}$
denotes the estimation of the ideal weight matrix
 ${{\boldsymbol{W}}_{1}}^ * $
,
 ${\xi _1} = {\left( {{\boldsymbol{z}_1},{\boldsymbol{\Omega }},{\boldsymbol{\omega}} } \right)^T}$
denotes the input vector of the RBFNN,
 ${\boldsymbol{\lambda} _{\bf{1}}}$
represents the estimation of
 ${{\boldsymbol{{\dot {\Omega}} }}_c}$
produced by the finite-time tracking differentiators described in. The adaptive weight update law of
 ${\hat{\boldsymbol{W}}_{1}}$
is designed as
 \begin{align}{\dot{\hat{\boldsymbol{W}}}}_{1} = {\Gamma _1}{\boldsymbol{\Phi}_{1}}\left( {{\boldsymbol{\xi}}_{1}} \right){\boldsymbol{z}_{\bf{1}}}^T, \end{align}
where
 ${\Gamma _1}$
is a positive parameter to be designed.
Substituting (22) into (21), we obtain
 \begin{align}{\dot{\boldsymbol{z}}_{\bf{1}}} = - {K_1}{\boldsymbol{z}_{\bf{1}}} + {\boldsymbol{g}_{\boldsymbol{\Omega }}}{\boldsymbol{z}_{\bf{2}}} + {\tilde {\boldsymbol{W}}_1}^T{\boldsymbol{\Phi}_{1}}\left( {{\boldsymbol{\xi}}_{1}} \right) + {\boldsymbol{\varepsilon }_1} + {{\boldsymbol{\tilde {\dot {\Omega}} }}_c}, \end{align}
where
 ${\tilde {\boldsymbol{W}}_1} = {{\boldsymbol{W}}_{1}}^ * - {\hat{\boldsymbol{W}}_{1}}$
and
 ${{\boldsymbol{\tilde {\dot {\Omega}} }}_c} = {\boldsymbol{\lambda} _{\bf{1}}} - {{\boldsymbol{{\dot {\Omega}} }}_c}$
.
Step 2:
Define the deviation variable between the real and ideal angular rates as
 ${\boldsymbol{z}_{\bf{2}}} = \omega - {\boldsymbol{\omega_{c}}}$
. Therefore, the augmented deviation variable
 $y$
containing auxiliary variable in (19) is defined as
 \begin{align} {\boldsymbol{y}} = {{\boldsymbol{z}}_{\bf{2}}} - \chi. \end{align}
Differentiating both sides (25) of and substituting (19) and (6) into (25), we obtain
 \begin{align}\begin{array}{c}\dot {\boldsymbol{y}} = {{\dot {\boldsymbol{z}}}_{\bf{2}}} - {\dot {\boldsymbol{\chi}}} = {{\boldsymbol{f}}_{\boldsymbol{\omega}}} + {{\boldsymbol{g}}_{\boldsymbol{\omega}}}u + {{\boldsymbol{\Delta }}_\omega } - {\boldsymbol{\dot {\boldsymbol{\omega }}}_c} + {k_{\chi 1}}{L_\chi }si{g^{{a_{\chi 1}}}}\left( \boldsymbol{\chi} \right) + {k_{\chi 2}}{L_\chi }si{g^{{a_{\chi 2}}}}\left( \boldsymbol{\chi} \right) - {{\boldsymbol{g}}_{\boldsymbol{\omega}}}{\boldsymbol{\Delta }}u\\[6pt] = {{\boldsymbol{f}}_{\boldsymbol{\omega}}} + {{\boldsymbol{g}}_{\boldsymbol{\omega}}}{\boldsymbol{u}_c} + {{\boldsymbol{\Delta }}_\omega } - {\boldsymbol{\dot {\boldsymbol{\omega }}}_c} + {k_{\chi 1}}{L_\chi }si{g^{{a_{\chi 1}}}}\left( \boldsymbol{\chi} \right) + {k_{\chi 2}}{L_\chi }si{g^{{a_{\chi 2}}}}\left( \boldsymbol{\chi} \right)\end{array} \end{align}
Furthermore, the control input
 ${\boldsymbol{u}_c}$
is designed as
 \begin{align}{\boldsymbol{u}_c} = {\boldsymbol{g}_{\boldsymbol{\omega}}} ^{ - 1}\left[ { - {K_2}y - \boldsymbol{g}_{\boldsymbol{\Omega }}^T{\boldsymbol{z}_{\bf{1}}} - {{\boldsymbol{f}}_{\boldsymbol{\omega}}} - {{\hat{ W}}_2}^T{{\boldsymbol{\Phi}}_{2}}\left( {{\boldsymbol{\xi}}_{2}} \right) + {\boldsymbol{\lambda} _{\bf{2}}} - {k_{\chi 1}}{L_\chi }si{g^{{a_{\chi 1}}}}\left( \boldsymbol{\chi} \right) - {k_{\chi 2}}{L_\chi }si{g^{{a_{\chi 2}}}}\left( \boldsymbol{\chi} \right)} \right], \end{align}
where
 ${K_2}$
denotes a positive design parameter,
 ${\hat {\boldsymbol{W}}_{2}}$
denotes the estimation of the ideal weight matrix
 ${{\boldsymbol{W}}_{2}}^ * $
,
 ${\xi _2} = {\left( {{{\boldsymbol{z}}_2},{\boldsymbol{\Omega }},{\boldsymbol{\omega }} } \right)^T}$
denotes the input vector,
 ${\boldsymbol{\lambda} _{\bf{2}}}$
denotes the estimation of
 ${{\boldsymbol{\dot {\boldsymbol{\omega }}}} _c}$
described in (16). The adaptive weight update law of
 ${\hat {\boldsymbol{W}}_{2}}$
is designed as
 \begin{align}{\dot{\hat{\boldsymbol{W}}}}_{2} = {\Gamma _2}{{\boldsymbol{\Phi}}_{2}}\left( {{\boldsymbol{\xi}}_{2}} \right){\boldsymbol{y}^T}, \end{align}
where
 ${\Gamma _2}$
is a positive parameter to be designed.
Substituting (27) into (26), we obtain
 \begin{align}\dot {\boldsymbol{y}} = - {K_2}y - \boldsymbol{g}_{\boldsymbol{\Omega }}^T{\boldsymbol{z}_{\bf{1}}} + {\tilde {\boldsymbol{W}}_2}^T{{\boldsymbol{\Phi}}_{2}}\left( {{\boldsymbol{\xi}}_{2}} \right) + {\boldsymbol{\varepsilon }_2} + {\tilde {\dot {\boldsymbol{\omega }}} _c}, \end{align}
where
 ${\tilde {\boldsymbol{W}}_2} = {{\boldsymbol{W}}_{2}}^ * - {\hat {\boldsymbol{W}}_{2}}$
,
 ${\tilde {\dot {\boldsymbol{\omega }}} _c} = {\boldsymbol{\lambda} _{\bf{2}}} - {{\boldsymbol{\dot {\boldsymbol{\omega }}}} _c}$
.
Remark 3. In the absence of saturation, the adaptive law increases the proportion of
 ${L_\chi }$
, reducing
 ${\boldsymbol{\chi}}$
to zero in fixed-time [Reference Ding, Yue and Liu32, Reference Zhong, Zhao and Liu35]. Under this circumstance, the anti-saturation controller degenerates to the backstepping controller [Reference Ding, Yue and Liu32, Reference Zhong, Zhao and Liu35].
 \begin{align}{T_a} \le \frac{1}{{{k_{\chi 1}}{L_\chi }\left( {1 - {a_{\chi 1}}} \right)}} + \frac{1}{{{k_{\chi 2}}{L_\chi }\left( {{a_\chi }_2 - 1} \right)}} \end{align}
3.5 Stability assessment
Theorem 2. The auxiliary variable
 ${\boldsymbol{\chi}}$
brought in through the AFAC is bounded.
Proof. The following Lyapunov function is selected as
 \begin{align}{V_1} = \frac{1}{2}{\boldsymbol{\chi}^{T}}\chi, \end{align}
The time derivative of
 ${V_1}$
is
 ${\dot V_1} = {\boldsymbol{\chi}^{T}}\left( { - {k_{\chi 1}}{L_\chi }si{g^{{a_{\chi 1}}}}\left( \boldsymbol{\chi} \right) - {k_{\chi 2}}{L_\chi }si{g^{{a_{\chi 2}}}}\left( \boldsymbol{\chi} \right) + {{\boldsymbol{g}}_{\boldsymbol{\omega}}}{\boldsymbol{\Delta }}u} \right)$
.
Assume the control law
 ${\boldsymbol{u}_c}$
in (27) is bounded. Under these circumstances, a positive constant
 ${u_M}$
exists, with
 $\Delta {u_i} \le {u_M},(i = a,e,r)$
and
 $M = {[\begin{array}{*{20}{c}}{{u_M}}&{{u_M}}&{{u_M}}\end{array}]^T}$
. Therefore, we have
 \begin{align}\begin{array}{l}{{\dot V}_1} \le {\boldsymbol{\chi}^{T}}\left( { - {k_{\chi 1}}{L_\chi }si{g^{{a_{\chi 1}}}}\left( \boldsymbol{\chi} \right) - {k_{\chi 2}}{L_\chi }si{g^{{a_{\chi 2}}}}\left( \boldsymbol{\chi} \right) + {{\boldsymbol{g}}_{\boldsymbol{\omega}}}{\boldsymbol{\Delta}} {\boldsymbol{u}}} \right)\\[4pt] \quad= - {k_{\chi 1}}{L_\chi }\left( {{{\left| {{\chi _1}} \right|}^{1 + {a_{\chi 1}}}} + {{\left| {{\chi _2}} \right|}^{1 + {a_{\chi 1}}}} + {{\left| {{\chi _3}} \right|}^{1 + {a_{\chi 1}}}}} \right) - {k_{\chi 2}}{L_\chi }\left( {{{\left| {{\chi _1}} \right|}^{1 + {a_{\chi 2}}}} + {{\left| {{\chi _2}} \right|}^{1 + {a_{\chi 2}}}} + {{\left| {{\chi _3}} \right|}^{1 + {a_{\chi 2}}}}} \right) + {\boldsymbol{\chi}^{T}}{{\boldsymbol{g}}_{\boldsymbol{\omega}}}{\boldsymbol{\Delta}} {\boldsymbol{u}}\\[4pt] \quad \le - {k_{\chi 1}}{L_\chi }\left( {{{\left| {{\chi _1}} \right|}^{1 + {a_{\chi 1}}}} + {{\left| {{\chi _2}} \right|}^{1 + {a_{\chi 1}}}} + {{\left| {{\chi _3}} \right|}^{1 + {a_{\chi 1}}}}} \right) - {k_{\chi 2}}{L_\chi }\left( {{{\left| {{\chi _1}} \right|}^{1 + {a_{\chi 2}}}} + {{\left| {{\chi _2}} \right|}^{1 + {a_{\chi 2}}}} + {{\left| {{\chi _3}} \right|}^{1 + {a_{\chi 2}}}}} \right) + \left| {{\boldsymbol{\chi}^{T}}{{\boldsymbol{g}}_{\boldsymbol{\omega}}}M} \right|\end{array}. \end{align}
In short,
 ${\dot V_1} \le 0$
when suitable parameters
 ${K_{\chi i}}\left( {i = 1,2} \right)$
are chosen, indicating that the auxiliary variable
 ${\boldsymbol{\chi}}$
is bounded.
Theorem 3. The proposed NN-ABC scheme can ensure that the tracking errors
 ${\boldsymbol{z}_{\bf{1}}}$
and
 ${\boldsymbol{z}_{\bf{2}}}$
are uniformly bounded, which is composed of the RBFNN disturbance observers described by (15), (23) and (28), of the anti-saturation compensator described by (19) and of the backstepping controllers described by (22) and (27).
Proof.
-
• The Lyapunov function is selected as
(33)
\begin{align}V = \frac{1}{2}{\boldsymbol{z}}_{\bf{1}}^T{\boldsymbol{z}_{\bf{1}}} + \frac{1}{2}{\boldsymbol{y}^T}y + \frac{1}{2}trace\left( {{ {\tilde{\boldsymbol{W}}}_1}^T\Gamma _1^{ - 1}{ {\tilde{\boldsymbol{W}}}_1} + { {\tilde{\boldsymbol{W}}}_2}^T\Gamma _2^{ - 1}{ {\tilde{\boldsymbol{W}}}_2}} \right). \end{align}

-
• The derivative of
$V$
is expressed as(34)
\begin{align}\dot V = \boldsymbol{z}_{\bf{1}}^T{\dot{\boldsymbol{z}}_{\bf{1}}} + {\boldsymbol{y}^T}\dot {\boldsymbol{y}} - trace\left( {{ {\tilde{\boldsymbol{W}}}_1}^T\Gamma _1^{ - 1}{{\dot {\hat{ W}}_1}} + { {\tilde{\boldsymbol{W}}}_2}^T\Gamma _2^{ - 1}{{\dot {\hat{ W}}_2}}} \right). \end{align}


-
• Substituting (23), (24), (28) and (29) into (34), we obtain
(35)where
\begin{align}\begin{array}{l}\dot V = \boldsymbol{z}_{\bf{1}}^T\left( { - {K_1}{\boldsymbol{z}_{\bf{1}}} + {\boldsymbol{g}_{\boldsymbol{\Omega }}}{\boldsymbol{z}_{\bf{2}}} + { {\tilde{\boldsymbol{W}}}_1}^T{\boldsymbol{\Phi}_{1}}\left( {{\boldsymbol{\xi}}_{1}} \right) + {\boldsymbol{\varepsilon }_1} + {{{\boldsymbol{\tilde {\dot {\Omega}} }}}_c}} \right) + {\boldsymbol{y}^T}\left( { - {K_2}y - \boldsymbol{g}_{\boldsymbol{\Omega }}^T{\boldsymbol{z}_{\bf{1}}} + { {\tilde{\boldsymbol{W}}}_2}^T{{\boldsymbol{\Phi}}_{2}}\left( {{\boldsymbol{\xi}}_{2}} \right) + {\boldsymbol{\varepsilon }_2} + {{\tilde {\dot {\boldsymbol{\omega }}} }_c}} \right)\\[6pt] \quad- trace\left( {{ {\tilde{\boldsymbol{W}}}_1}^T{\boldsymbol{\Phi}_{1}}\left( {{\boldsymbol{\xi}}_{1}} \right){\boldsymbol{z}_{\bf{1}}}^T} \right) - trace\left( {{ {\tilde{\boldsymbol{W}}}_2}^T{{\boldsymbol{\Phi}}_{2}}\left( {{\boldsymbol{\xi}}_{2}} \right){\boldsymbol{y}^T}} \right)\\[4pt] \quad= - {K_1}\boldsymbol{z}_{\bf{1}}^T{\boldsymbol{z}_{\bf{1}}} - {K_2}{\boldsymbol{y}^T}y + \boldsymbol{z}_{\bf{1}}^T{\boldsymbol{g}_{\boldsymbol{\Omega }}}{{\boldsymbol{z}}_{\bf{2}}} - {\boldsymbol{y}^T}\boldsymbol{g}_{\boldsymbol{\Omega }}^T{\boldsymbol{z}_{\bf{1}}} + \boldsymbol{z}_{\bf{1}}^T{ {\tilde{\boldsymbol{W}}}_1}^T{\boldsymbol{\Phi}_{1}}\left( {{\boldsymbol{\xi}}_{1}} \right) + \boldsymbol{z}_{\bf{1}}^T{\boldsymbol{\varepsilon }_1} + \boldsymbol{z}_{\bf{1}}^T{{{\boldsymbol{\tilde {\dot {\Omega}} }}}_c} + {\boldsymbol{y}^T}{ {\tilde{\boldsymbol{W}}}_2}^T{{\boldsymbol{\Phi}}_{2}}\left( {{\boldsymbol{\xi}}_{2}} \right)\\[4pt] \quad+ {\boldsymbol{y}^T}{\boldsymbol{\varepsilon }_2} + {\boldsymbol{y}^T}{{\tilde {\dot {\boldsymbol{\omega }}} }_c} - trace\left( {{ {\tilde{\boldsymbol{W}}}_1}^T{\boldsymbol{\Phi}_{1}}\left( {{\boldsymbol{\xi}}_{1}} \right){\boldsymbol{z}_{\bf{1}}}^T} \right) - trace\left( {{ {\tilde{\boldsymbol{W}}}_2}^T{{\boldsymbol{\Phi}}_{2}}\left( {{\boldsymbol{\xi}}_{2}} \right){\boldsymbol{y}^T}} \right)\\[4pt] \quad= - {K_1}\boldsymbol{z}_{\bf{1}}^T{\boldsymbol{z}_{\bf{1}}} - {K_2}{\boldsymbol{y}^T}y + \boldsymbol{z}_{\bf{1}}^T{\boldsymbol{g}_{\boldsymbol{\Omega }}}{{\boldsymbol{z}}_{\bf{2}}} - {\left( {{{\boldsymbol{z}}_{\bf{2}}} - \chi } \right)^T}\boldsymbol{g}_{\boldsymbol{\Omega }}^T{\boldsymbol{z}_{\bf{1}}} + \boldsymbol{z}_{\bf{1}}^T{\boldsymbol{\varepsilon }_1} + \boldsymbol{z}_{\bf{1}}^T{{{\boldsymbol{\tilde {\dot {\Omega}} }}}_c} + {\boldsymbol{y}^T}{\boldsymbol{\varepsilon }_2} + {\boldsymbol{y}^T}{{\tilde {\dot {\boldsymbol{\omega }}} }_c}\\[4pt] \quad= - {K_1}\boldsymbol{z}_{\bf{1}}^T{\boldsymbol{z}_{\bf{1}}} - {K_2}{\boldsymbol{y}^T}y + {\boldsymbol{\chi}^{T}}\boldsymbol{g}_{\boldsymbol{\Omega }}^T{\boldsymbol{z}_{\bf{1}}} + \boldsymbol{z}_{\bf{1}}^T{\boldsymbol{\varepsilon }_1} + \boldsymbol{z}_{\bf{1}}^T{{{\boldsymbol{\tilde {\dot {\Omega}} }}}_c} + {\boldsymbol{y}^T}{\boldsymbol{\varepsilon }_2} + {\boldsymbol{y}^T}{{\tilde {\dot {\boldsymbol{\omega }}} }_c}\end{array}, \end{align}
(36)It should be noted that for the bank-to-turn (BTT) scheme, the sideslip angle should be kept near zero [Reference Dai, Yan and Han38]. Therefore, we obtain
\begin{align}{\boldsymbol{\chi}^{T}}\boldsymbol{g}_{\boldsymbol{\Omega }}^T{\boldsymbol{z}_{\bf{1}}} = \left[ {\begin{array}{*{20}{c}}{{\chi _1}} &\quad{{\chi _2}}&\quad{{\chi _3}}\end{array}} \right]\left[ {\begin{array}{*{20}{c}}{ - \tan \beta \cos \alpha }&\quad{\sin \alpha }&\quad{\sec \beta \cos \alpha }\\1&\quad0&\quad0\\{ - \tan \beta \sin \alpha }&\quad{ - \cos \alpha }&\quad{\sec \beta \sin \alpha }\end{array}} \right]{\left[ {\begin{array}{*{20}{c}}{{z_{11}}}&\quad{{z_{12}}}&\quad{{z_{13}}}\end{array}} \right]^T}. \end{align}
(37)
\begin{align}{\boldsymbol{\chi}^{T}}\boldsymbol{g}_{\boldsymbol{\Omega }}^T{\boldsymbol{z}_{\bf{1}}}&= {\begin{bmatrix}{{\chi _1}}&\quad{{\chi _2}}&\quad{{\chi _3}}\end{bmatrix}} {\begin{bmatrix}0&\quad{\sin \alpha }&\quad{\cos \alpha }\nonumber\\1&\quad0&\quad0\nonumber\\0&\quad{ - \cos \alpha }&\quad{\sin \alpha }\end{bmatrix}} {\begin{bmatrix}{{z_{11}}}&\quad{{z_{12}}}&\quad{{z_{13}}}\end{bmatrix} ^T}.\nonumber\\ &= {z_{11}}{\chi _2} + {z_{12}}\left( {{\chi _1}\sin \alpha - {\chi _3}\cos \alpha } \right) + {z_{13}}\left( {{\chi _1}\cos \alpha + {\chi _3}\sin \alpha } \right)\nonumber\\[3pt] & \le \left| {{z_{11}}} \right|\left| {{\chi _2}} \right| + \left| {{z_{12}}} \right|\left| {{\chi _1}} \right| + \left| {{z_{12}}} \right|\left| {{\chi _3}} \right| + \left| {{z_{13}}} \right|\left| {{\chi _1}} \right| + \left| {{z_{13}}} \right|\left| {{\chi _3}} \right|\nonumber\\[3pt] & \le \frac{{z_{11}^2 + \chi _2^2}}{2} + \frac{{z_{12}^2 + \chi _1^2}}{2} + \frac{{z_{12}^2 + \chi _3^2}}{2} + \frac{{z_{13}^2 + \chi _1^2}}{2} + \frac{{z_{13}^2 + \chi _3^2}}{2}\nonumber\\[3pt] &= \frac{{z_{11}^2}}{2} + \frac{{\chi _2^2}}{2} + z_{12}^2 + \chi _1^2 + z_{13}^2 + \chi _3^2. \end{align}
According to Theorem 1 and Remark 1, the estimated errors of
${{\boldsymbol{{\dot {\Omega}} }}_c}$
,
${{\boldsymbol{\dot {\boldsymbol{\omega }}}} _c}$
,
${\boldsymbol{\varepsilon }_1}$
and
${\boldsymbol{\varepsilon }_2}$
are bounded. Therefore, the following inequality can be derived(38)
\begin{align}\boldsymbol{z}_{\bf{1}}^T{{\boldsymbol{\tilde {\dot {\Omega}} }}_c} + {\boldsymbol{y}^T}{\tilde {\dot {\boldsymbol{\omega }}} _c} + \boldsymbol{z}_{\bf{1}}^T{\boldsymbol{\varepsilon }_1} + {\boldsymbol{y}^T}{\boldsymbol{\varepsilon }_2} \le \boldsymbol{z}_{\bf{1}}^T{\boldsymbol{z}_{\bf{1}}} + {\boldsymbol{y}^T}y + \frac{{{\boldsymbol{\tilde {\dot {\Omega}} }}{}_c^T{{{\boldsymbol{\tilde {\dot {\Omega}} }}}_c}}}{2} + \frac{{\tilde {\dot {\boldsymbol{\omega }}}_{c}^{T}{{\tilde {\dot {\boldsymbol{\omega }}} }_c}}}{2} + \frac{{{\boldsymbol{\varepsilon }}_1^T{\boldsymbol{\varepsilon }_1}}}{2} + \frac{{{\boldsymbol{\varepsilon }}_2^T{\boldsymbol{\varepsilon }_2}}}{2}. \end{align}


-
• Substituting (37) and (38) into (35), we obtain
(39)where
\begin{align}\begin{array}{l}\dot V \le - {K_1}\boldsymbol{z}_{\bf{1}}^T{\boldsymbol{z}_{\bf{1}}} - {K_2}{\boldsymbol{y}^T}y + \dfrac{{z_{11}^2}}{2} + \dfrac{{\chi _2^2}}{2} + z_{12}^2 + \chi _1^2 + z_{13}^2 + \chi _3^2 + \boldsymbol{z}_{\bf{1}}^T{\boldsymbol{z}_{\bf{1}}} + {\boldsymbol{y}^T}y\\[6pt]\quad+ \dfrac{{{\boldsymbol{\tilde {\dot {\Omega}} }}{}_c^T{{{\boldsymbol{\tilde {\dot {\Omega}} }}}{}_c}}}{2} + \dfrac{{\tilde {\dot {\boldsymbol{\omega }}} _c^T{{\tilde {\dot {\boldsymbol{\omega }}} }_c}}}{2} + \dfrac{{{\boldsymbol{\varepsilon }}_1^T{\boldsymbol{\varepsilon }_1}}}{2} + \dfrac{{{\boldsymbol{\varepsilon }}_2^T{\boldsymbol{\varepsilon }_2}}}{2}\\[6pt]\quad = - \left( {{K_1} - \dfrac{3}{2}} \right)z_{11}^2 - \left( {{K_1} - 2} \right)z_{12}^2 - \left( {{K_1} - 2} \right)z_{13}^2 - \left( {{K_2} - 1} \right)y_1^2 - \left( {{K_2} - 1} \right)y_2^2\\[6pt] \quad - \left( {{K_2} - 1} \right)y_3^2 + \dfrac{{\chi _2^2}}{2} + \chi _1^2 + \chi _3^2 + \dfrac{{{\boldsymbol{\tilde {\dot {\Omega}} }}{}_c^T{{{\boldsymbol{\tilde {\dot {\Omega}} }}}{}_c}}}{2} + \dfrac{{\tilde {\dot {\boldsymbol{\omega }}} _c^T{{\tilde {\dot {\boldsymbol{\omega }}} }_c}}}{2} + \dfrac{{{\boldsymbol{\varepsilon }}_1^T{\boldsymbol{\varepsilon }_1}}}{2} + \dfrac{{{\boldsymbol{\varepsilon }} _2^T{\boldsymbol{\varepsilon }_2}}}{2}\\[6pt] \quad \le - \left( {{K_1} - 2} \right)\boldsymbol{z}_{\bf{1}}^T{\boldsymbol{z}_{\bf{1}}} - \left( {{K_2} - 1} \right){\boldsymbol{y}^T}y + \dfrac{{\chi _2^2}}{2} + \chi _1^2 + \chi _3^2 + \dfrac{{{\boldsymbol{\tilde {\dot {\Omega}} }}{}_c^T{{{\boldsymbol{\tilde {\dot {\Omega}} }}}{}_c}}}{2} + \dfrac{{\tilde {\dot {\boldsymbol{\omega }}} _c^T{{\tilde {\dot {\boldsymbol{\omega }}} }_c}}}{2} + \dfrac{{{\boldsymbol{\varepsilon }}_1^T{\boldsymbol{\varepsilon }_1}}}{2} + \dfrac{{{\boldsymbol{\varepsilon }}_2^T{\boldsymbol{\varepsilon }_2}}}{2}\\[6pt] \quad \le - \kappa V + C\end{array}, \end{align}
${K_1} \gt 2$
,
${K_2} \gt 1$
,
$\kappa = \min \left( {{K_1} - 2,{K_2} - 1} \right)$
, and(40)
\begin{align}C = \frac{{\chi _2^2}}{2} + \chi _1^2 + \chi _3^2 + \frac{{{\boldsymbol{\tilde {\dot {\Omega}} }}{}_c^T{{{\boldsymbol{\tilde {\dot {\Omega}} }}}_c}}}{2} + \frac{{\tilde {\dot {\boldsymbol{\omega }}} _c^T{{\tilde {\dot {\boldsymbol{\omega }}} }_c}}}{2} + \frac{{{\boldsymbol{\varepsilon }} _1^T{\boldsymbol{\varepsilon }_1}}}{2} + \frac{{{\boldsymbol{\varepsilon }}_2^T{\boldsymbol{\varepsilon }_2}}}{2}. \end{align}


Recalling Theorem 2,
 ${\boldsymbol{\chi}}$
is bounded, and
 $C$
is also bounded.
By setting
 $\kappa \gt {C \mathord{\left/ {\vphantom {C V}} \right. } V} $
,
 $\dot V \lt 0$
can be guaranteed. In this way, the solution of (39) is expressed as
 \begin{align}0 \le V(t) \le \left( {V(0) - \frac{C}{\kappa }} \right){e^{ - \kappa t}} + \frac{C}{\kappa }. \end{align}
 \begin{align}\begin{array}{l}\left\| {{\boldsymbol{z}_{\bf{1}}}} \right\| \le \sqrt {\frac{{2C}}{\kappa } + 2\left( {V(0) - \frac{C}{\kappa }} \right){e^{ - \kappa t}}} ,\;\;\;{\mkern 1mu} \forall t \gt 0\\[12pt]\left\| y \right\| \le \sqrt {\frac{{2C}}{\kappa } + 2\left( {V(0) - \frac{C}{\kappa }} \right){e^{ - \kappa t}}} ,\;\;\;{\mkern 1mu} \forall t \gt 0\end{array}. \end{align}
According to (42), we have
 ${\boldsymbol{z}_{\bf{1}}} \le \sqrt {{{2C} \mathord{\left/ {\vphantom {{2C} \kappa }} \right.} \kappa }} ,\,\,y \le \sqrt {{{2C} \mathord{\left/ {\vphantom {{2C} \kappa }} \right. } \kappa }} $
as
 $t \to \infty $
. The result of analysis is that the tracking errors
 ${\boldsymbol{z}_{\bf{1}}}$
and
 $y$
are uniformly ultimately bounded when correct parameters
 ${{\bf{K}}_i}\left( {i = 1,2} \right)$
are selected. Furthermore, since
 ${{\boldsymbol{z}}_{\bf{2}}} = y + \chi $
and
 ${\boldsymbol{\chi}}$
is bounded, it follows that
 ${{\boldsymbol{z}}_2}$
is also bounded. This is thereby certified.
4.0 Simulation
In this section, we employ Simulink to conduct two comparative experiments. Each experiment comprises a single simulation and a Monte Carlo simulation, aimed to demonstrate the performance of the proposed RBFNNDO and NN-ABC controller. The single simulation provides a focused assessment of the controllers’ and observers’ capabilities under specific conditions, while the Monte Carlo simulation offer an evaluation of the robust performance of the observer and controller in the face of uncertain aerodynamic conditions.
The geometric characteristics of the HFV are demonstrated in Ref. (Reference Zhong, Zhao and Liu35). The initial conditions are set as
 $H = {\rm{27}}{\rm{.5km}}$
,
 ${V_b} = {\rm{2}}{\rm{.8}} \times {\rm{1}}{{\rm{0}}^3}{\rm{ }}m/s$
,
 $\alpha = - {1^ \circ }$
,
 $\beta = {0.1^ \circ }$
,
 $\mu = {0^ \circ }$
and
 $p = q = r = {0^{^\circ} }/s$
. The flow angle commands
 ${{\boldsymbol{\Omega }}_c}$
are selected as
 ${\alpha _c} = 2\sin {(0.25\pi t)^{^\circ} }$
,
 ${\beta _c} = {0^{^\circ }}$
,
 ${\mu _c} = \sin {(0.25\pi t)^{^\circ} }$
. The external disturbances terms in are presented as
 ${d_\alpha } = 0.02\sin \left( {0.25\pi t} \right)rad/s$
,
 ${d_\beta } = 0.01\sin (0.35\pi t)rad/s$
,
 ${d_\mu } = 0rad/s$
,
 ${d_p} = 0.03\sin (0.35\pi t)N \cdot m$
,
 ${d_q} = 0.04\sin \left( {0.25\pi t} \right)N \cdot m$
,
 ${d_r} = 0.01\sin \left( {0.35\pi t} \right)N \cdot m$
. The actuators limitations are
 $ - {30^ \circ } \le {\delta _a},{\delta _e} \le {30^ \circ }$
and
 $ - {20^ \circ } \le {\delta _r} \le {20^ \circ }$
. The node number of each RBFNN in (15) are 9, the initial weights
 ${\hat{\boldsymbol{W}}_{1}}$
and
 ${\hat{\boldsymbol{W}}_{2}}$
are 0, the RBFNN Gaussian function widths
 ${b_{1i}}$
and
 ${b_{2i}}\left( {i = 1,2, \ldots ,9} \right)$
are 0.25 and 0.075 respectively, the RBFNN Gaussian function centres
 ${\sigma _1}$
and
 ${\sigma _2}$
are set as
 \begin{align}{\sigma _1} = \left[ {\begin{array}{*{20}{c}}{ - 1}&\quad{ - 0.75}&\quad{ - 0.5}&\quad{ - 0.25}&\quad0&\quad{0.25}&\quad{0.5}&\quad{0.75}&\quad1\\[2pt]{ - 0.1}&\quad{ - 0.075}&\quad{ - 0.05}&\quad{ - 0.025}&\quad0&\quad{0.025}&\quad{0.05}&\quad{0.075}&\quad{0.1}\\[2pt]{ - 0.2}&\quad{ - 0.15}&\quad{ - 0.1}&\quad{ - 0.05}&\quad0&\quad{0.05}&\quad{0.1}&\quad{0.15}&\quad{0.2}\\[2pt]{ - 2}&\quad{ - 1.5}&\quad{ - 1}&\quad{ - 0.5}&\quad0&\quad{0.5}&\quad1&\quad{1.5}&\quad2\\[2pt]{ - 1}&\quad{ - 0.75}&\quad{ - 0.5}&\quad{ - 0.25}&\quad0&\quad{0.25}&\quad{0.5}&\quad{0.75}&\quad1\\[2pt]{ - 2}&\quad{ - 1.5}&\quad{ - 1}&\quad{ - 0.5}&\quad0&\quad{0.5}&\quad1&\quad{1.5}&\quad2\\[2pt]{ - 2}&\quad{ - 1.5}&\quad{ - 1}&\quad{ - 0.5}&\quad0&\quad{0.5}&\quad1&\quad{1.5}&\quad2\\[2pt]{ - 0.1}&\quad{ - 0.075}&\quad{ - 0.05}&\quad{ - 0.025}&\quad0&\quad{0.025}&\quad{0.05}&\quad{0.075}&\quad{0.1}\\[2pt]{ - 1}&\quad{ - 0.75}&\quad{ - 0.5}&\quad{ - 0.25}&\quad0&\quad{0.25}&\quad{0.5}&\quad{0.75}&\quad1\end{array}} \right], \end{align}
 \begin{align}{\sigma _2} = \left[ {\begin{array}{*{20}{c}}{ - 1}&\quad{ - 0.75}&\quad{ - 0.5}&\quad{ - 0.25}&\quad0&\quad{0.25}&\quad{0.5}&\quad{0.75}&\quad1\\[2pt]{ - 1}&\quad{ - 0.75}&\quad{ - 0.5}&\quad{ - 0.25}&\quad0&\quad{0.25}&\quad{0.5}&\quad{0.75}&\quad1\\[2pt]{ - 0.1}&\quad{ - 0.075}&\quad{ - 0.05}&\quad{ - 0.025}&\quad0&\quad{0.025}&\quad{0.05}&\quad{0.075}&\quad{0.1}\\[2pt]{ - 2}&\quad{ - 1.5}&\quad{ - 1}&\quad{ - 0.5}&\quad0&\quad{0.5}&\quad1&\quad{1.5}&\quad2\\[2pt]{ - 1}&\quad{ - 0.75}&\quad{ - 0.5}&\quad{ - 0.25}&\quad0&\quad{0.25}&\quad{0.5}&\quad{0.75}&\quad1\\[2pt]{ - 2}&\quad{ - 1.5}&\quad{ - 1}&\quad{ - 0.5}&\quad0&\quad{0.5}&\quad1&\quad{1.5}&\quad2\\[2pt]{ - 2}&\quad{ - 1.5}&\quad{ - 1}&\quad{ - 0.5}&\quad0&\quad{0.5}&\quad1&\quad{1.5}&\quad2\\[2pt]{ - 0.1}&\quad{ - 0.075}&\quad{ - 0.05}&\quad{ - 0.025}&\quad0&\quad{0.025}&\quad{0.05}&\quad{0.075}&\quad{0.1}\\[2pt]{ - 1}&\quad{ - 0.75}&\quad{ - 0.5}&\quad{ - 0.25}&\quad0&\quad{0.25}&\quad{0.5}&\quad{0.75}&\quad1\end{array}} \right]. \end{align}
4.1 Comparison of RBFNNDO and ESDO
4.1.1 Single simulation
In this subsection, we conduct a comparative analysis of the performance of two observers designed to estimate the lumped disturbances. One uses the RBFNNDO that contains the AFAC, whereas the other uses the ESDO with the rest parts remain identical. The aerodynamic uncertainties in (4) are set as
 $\Delta {C_L} = 0.2{C_L}$
,
 $\Delta {C_Y} = 0.2{C_Y}$
,
 $\Delta {C_l} = 0.2{C_l}$
,
 $\Delta {C_m} = 0.2{C_m}$
,
 $\Delta {C_n} = 0.2{C_n}$
, and they are unknown to the control law. The parameters of the RBFNNDO are listed out in Table 1, the parameters of the ESDO are listed out in Table 2, and the simulation results are presented in Figs 2 and 3.
 \begin{align}\begin{array}{l}\left\{ \begin{array}{l}{{\boldsymbol{E}}_1} = {{{\hat{\boldsymbol{z}}}}_{11}} - {\boldsymbol{\Omega }}\\[3pt]{{\dot {\hat{\boldsymbol{z}}}}_{11}} = {f_{\boldsymbol{\Omega }}} + {\boldsymbol{g}_{\boldsymbol{\Omega }}}{\boldsymbol{\omega}}- {\boldsymbol{\eta} _{{\boldsymbol{\Omega }}1}}si{g^{0.5}}\left( {{\boldsymbol{E}}_{1}} \right) + {{{\hat{\boldsymbol{z}}}}_{12}}\\[3pt]{{\dot {\hat{\boldsymbol{z}}}}_{12}} = - {\eta _{{\boldsymbol{\Omega }}2}}sign\left( {{\boldsymbol{E}}_{1}} \right)\end{array} \right.\\[20pt]\left\{ \begin{array}{l}{\boldsymbol{E}_{2}} = {{{\hat{\boldsymbol{z}}}}_{21}} - \omega \\[3pt]{{\dot {\hat{\boldsymbol{z}}}}_{21}} = {{\boldsymbol{f}}_{\boldsymbol{\omega}}} + {{\boldsymbol{g}}_{\boldsymbol{\omega}}}u - {\boldsymbol{\eta} _{{\boldsymbol{\omega }}1}}si{g^{0.5}}\left( {{\boldsymbol{E}_{2}}} \right) + {{{\hat{\boldsymbol{z}}}}_{22}}\\[3pt]{{\dot {\hat{\boldsymbol{z}}}}_{22}} = - {\eta _{\omega 2}}sign\left( {{\boldsymbol{E}_{2}}} \right)\end{array} \right.\end{array} \end{align}
where
 ${\hat {\boldsymbol{z}}_{11}}$
and
 ${\hat {\boldsymbol{z}}_{21}}$
denote the approximations of the attitude angle
 ${\boldsymbol{\Omega }}$
and angular rate
 $\omega $
,respectively;
 ${\hat {\boldsymbol{z}}_{12}}$
and
 ${\hat {\boldsymbol{z}}_{22}}$
denote the approximations of the lumped disturbances
 ${{\boldsymbol{\Delta}} _{\boldsymbol{\Omega }}}$
and
 ${{\boldsymbol{\Delta}} _{\boldsymbol{\omega} }}$
, respectively;
 ${\boldsymbol{\eta} _{{\boldsymbol{\Omega }}i}}$
and
 ${\boldsymbol{\eta} _{{\boldsymbol{\omega }}i}}\left( {i = 1,2} \right)$
are the observer positive definite diagonal parameter matrix to be designed.
NN-ABC controller parameters in simulation 4.1

Parameters of ESDO in simulation 4.1

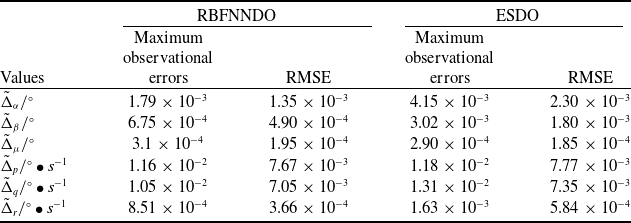
Figures 2 and 3 demonstrate observational errors of the flow angles disturbances and angular rates disturbances in different scenarios, respectively. The specific data analysing of observational performances are listed out in Table 3. During the second phase (when t > 1.7s), the maximum values of observational error
 ${\tilde \Delta _\mu }$
of the two observers are comparable, other observational errors are lower than those for the EDSO-ABC when the proposed RBFNNDO is used. The experimental results confirm the effectiveness of RBFNNDO in approximating complex nonlinear disturbances. However, for simple disturbances such as
 ${d_\mu } = 0{\rm{ }}rad/s$
, ESDO has demonstrated sufficient approximation capability. Considering that disturbances in the real world often exhibit nonlinear characteristics, the RBFNNDO holds greater practical value compared to the ESDO.
Observational errors of the flow angles disturbances. (a) Variations of
 ${\tilde \Delta _\alpha }$
(b) Variations of
 ${\tilde \Delta _\beta }$
(c) Variations of
 ${\tilde \Delta _\mu }$
.

4.1.2 Monte Carlo simulation
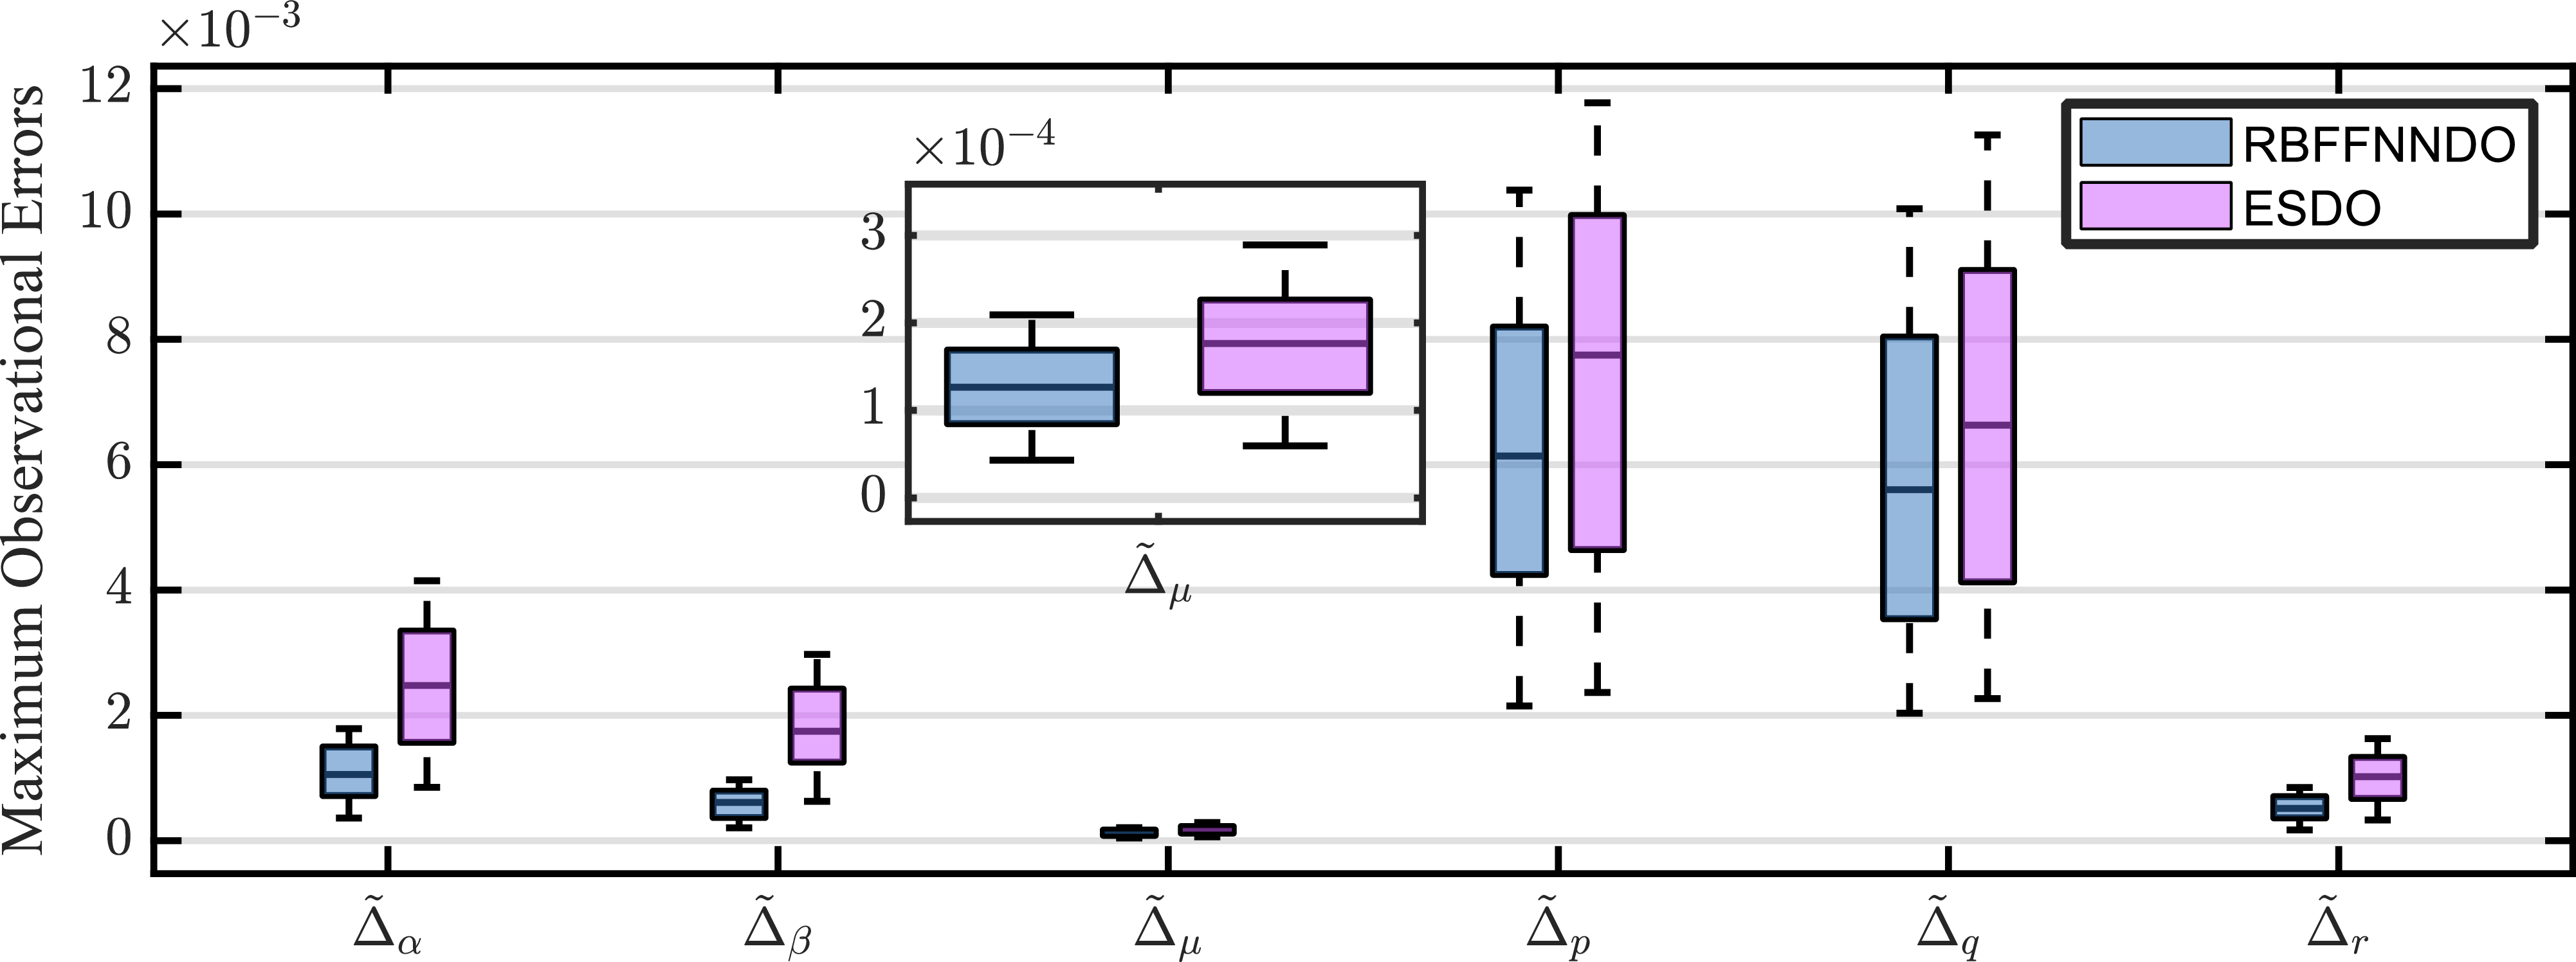
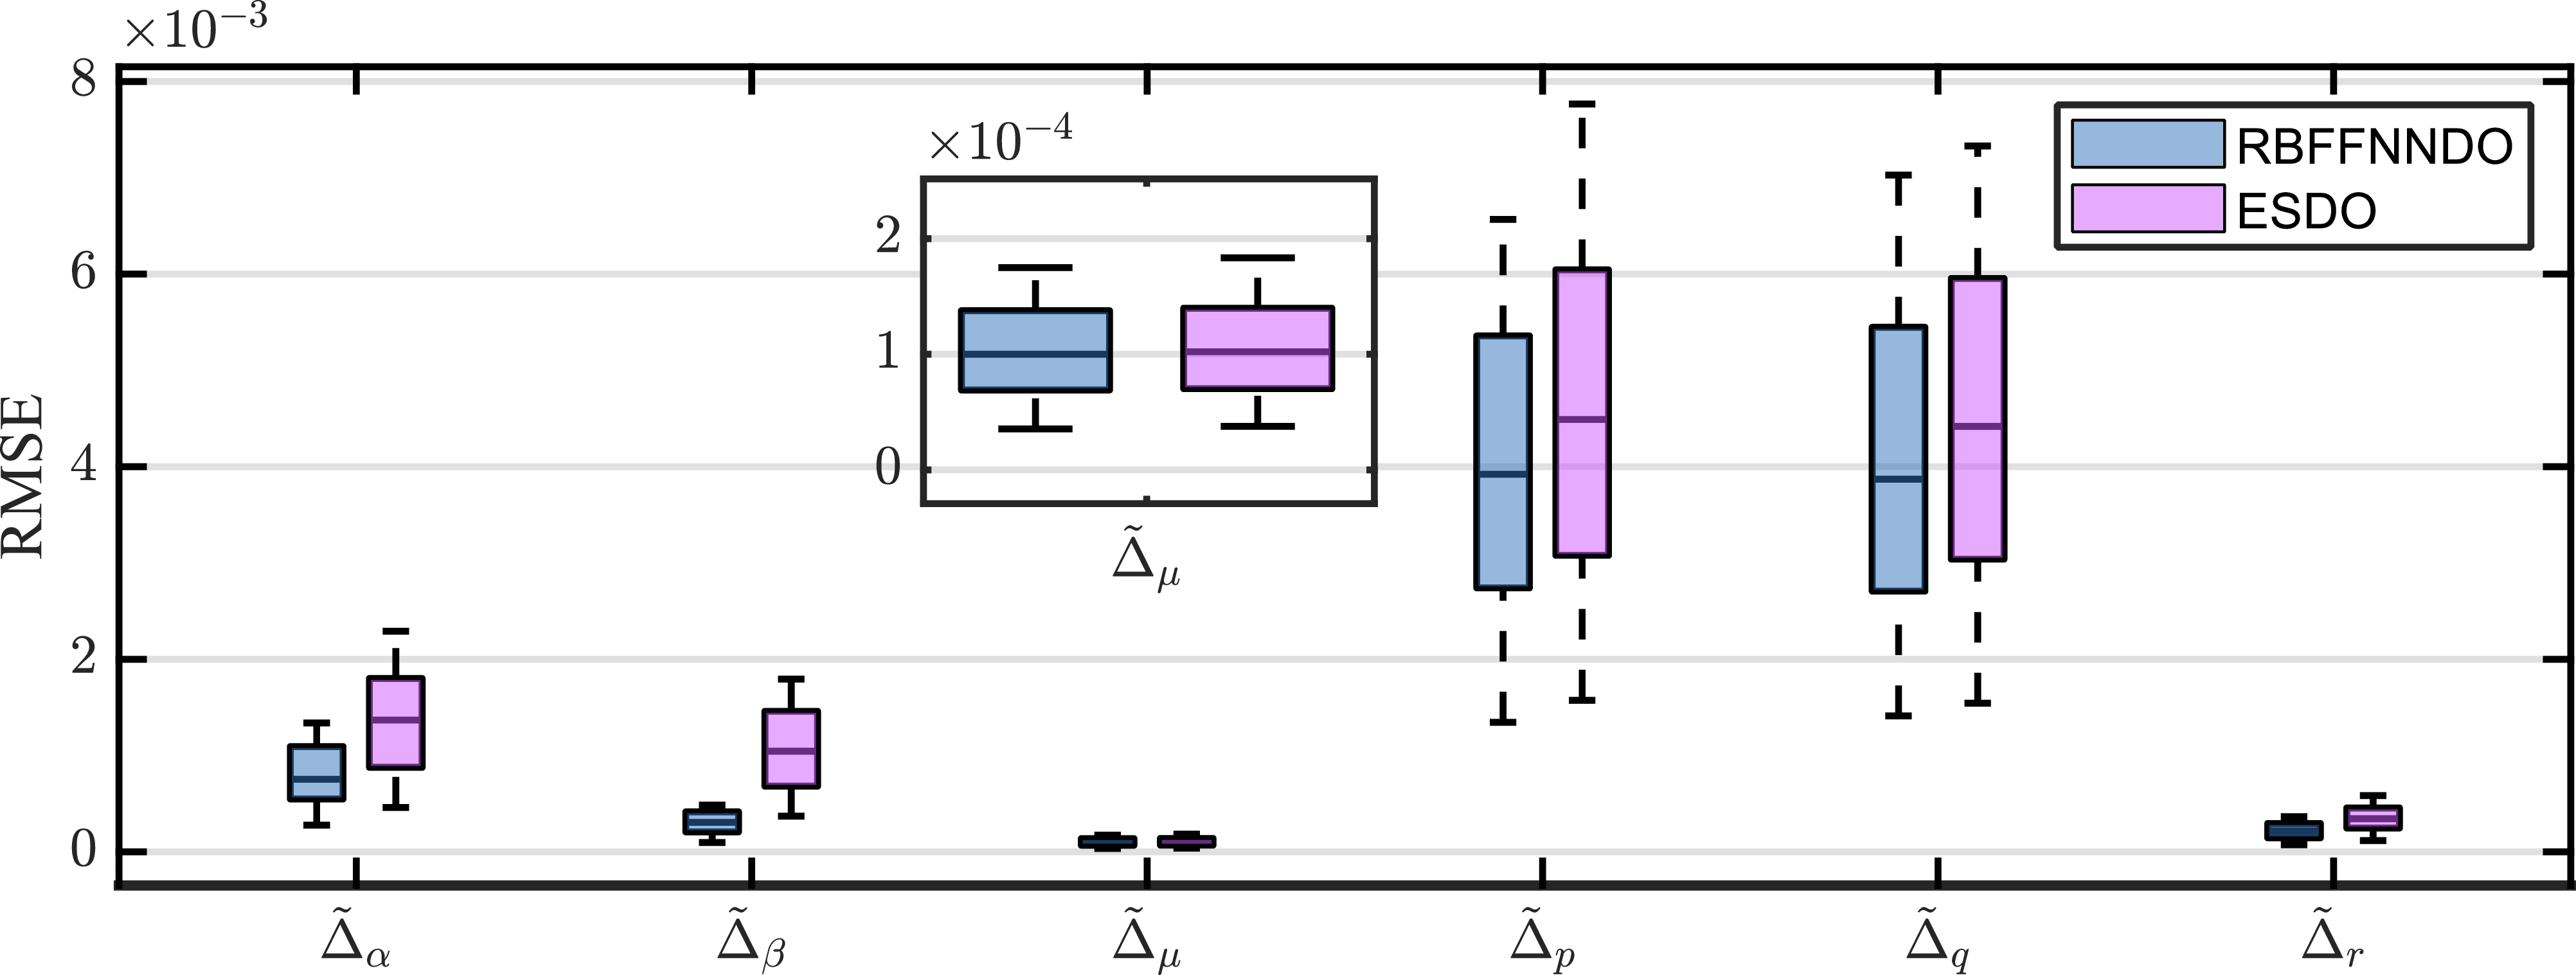
The results of 200 Monte Carlo simulations are presented to illustrate the robustness of the proposed RBFNNDO. The aerodynamic uncertainties follow a random distribution within the range of ±20% of their baseline values. For simplicity, similar tracking and estimation performance curves are not presented in this subsection. Instead, box plots of the corresponding indexes are drawn to illustrate the effectiveness and robustness of the proposed scheme. The rectangular box of the box plot represents the middle 50% of the data, the line segment in the middle represents the median of the data, and the long and short whiskers represent the maximum and minimum values of the data.
Figures 4 and 5 demonstrate the maximum observational errors and RMSE of flow angles and angular rates disturbance estimation for different disturbance observers, respectively. The figures clearly show that RBFNNDO has significantly lower average maximum observation errors and RMSE than ESDO under most parameter conditions. Further analysis of the box plots reveals that RBFNNDO also exhibits superior performance, with a more concentrated data distribution and fewer outliers. This indicates that RBFNNDO possesses greater robustness and reliability in handling uncertainties and disturbances.
Comparison of observational performances of RBFFNNDO and ESDO in Simulation 4.1 during the second phase (from t = 1.7s to t = 8s)

Observational errors of the angular rates disturbances. (a) Variations of
 ${\tilde \Delta _p}$
(b) Variations of
 ${\tilde \Delta _q}$
(c) Variations of
 ${\tilde \Delta _r}$
.

Comparison of maximum observational errors of RBFFNNDO and ESDO during the second phase (from t = 1.7s to t = 8s).

Comparison of RMSE of RBFFNNDO and ESDO during the second phase (from t = 1.7s to t = 8s).

4.2 Comparison of AFAC and FAC compensators
4.2.1 Single simulation
In this subsection, we conduct a comparative analysis of the performance of two compensators designed to alleviate the effects of input saturation. The first compensator employs an AFAC, while the second utilises the Fixed-Time Anti-Saturation Compensator (FAC) as proposed in Ref. (Reference Zhao, Feng and Cui34). The lumped disturbances are estimated by the RBFNN disturbance observers. The aerodynamic uncertainties in (4) are the same as those set in section 4.1.1.
Therefore, the virtual control law of the NN-FAC is established as
 \begin{align}{\boldsymbol{\omega_{c}}} = \boldsymbol{g}_{\boldsymbol{\Omega }}^{ - 1}\left( { - {K_1}{\boldsymbol{z}_1} - {f_{\boldsymbol{\Omega }}} - {{\hat{\boldsymbol{W}}}_1}^T{\boldsymbol{\Phi}_{1}}\left( {{\boldsymbol{\xi}}_{1}} \right) + {\lambda _1}} \right)\!, \end{align}
Furthermore, the control input
 ${\boldsymbol{u}_c}$
of the NN-FAC is designed as
 \begin{align}{\boldsymbol{u}_c} = {\boldsymbol{g}_{\boldsymbol{\omega}}} ^{ - 1}\left[ { - {K_2}y - \boldsymbol{g}_{\boldsymbol{\Omega }}^T{\boldsymbol{z}_{\bf{1}}} - {{\boldsymbol{f}}_{\boldsymbol{\omega}}} - {{\hat{ W}}_2}^T{{\boldsymbol{\Phi}}_{2}}\left( {{\boldsymbol{\xi}}_{2}} \right) + {\boldsymbol{\lambda} _{\bf{2}}} - {\dot {\boldsymbol{\chi}}} } \right]\!, \end{align}
The anti-saturation compensator is designed according to Ref. (Reference An, Liu and Wang31) and expressed as
 \begin{align}{\dot {\boldsymbol{\chi}}} = - {k_{\chi 1}}{{\boldsymbol{\chi}}^{{a_{\chi 1}}}} - {k_{\chi 2}}{{\boldsymbol{\chi}}^{{a_{\chi 2}}}} + {{\boldsymbol{g}}_{\boldsymbol{\omega}}}{\boldsymbol{\Delta }}u. \end{align}
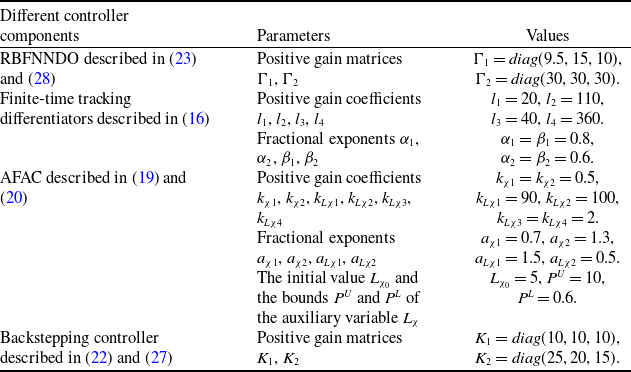
The parameters of the NN-ABC controller are listed in Table 1. The parameters of the NN-FAC controller are listed in Table 4, maintaining consistency in the controller parameters with those of the NN-ADSC controller. The simulation outcomes are displayed from Figs 6 through 12.
Parameters of NN-FAC controller in simulation 4.2

Tracking performances of the flow angles. (a) Variations of
 $\alpha $
(b) Variations of
 $\beta $
(c) Variations of
 $\mu $
.

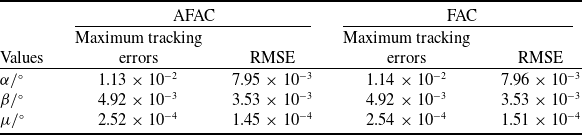
Figures 6 and 7 demonstrate tracking performances and tracking errors of the flow angles in different scenarios, respectively. The specific data analysing tracking errors and settling time are listed in
Comparison of flow angles tracking performances of AFAC and FAC in simulation 4.2 during the second phase (from t = 1.7s to t = 12s)

Tracking errors of the flow angles. (a) Variations of
 ${e_\alpha }$
(b) Variations of
 ${e_\beta }$
(c) Variations of
 ${e_\mu }$
.

Table 5 and Table 6. During the second phase (when t > 1.7s), the maximum values of tracking errors
 ${e_\alpha }$
and
 ${e_\mu }$
are respectively 8.8% and 7.9% lower than those for the NN-FAC when the proposed AFAC is used. It can be observed that the convergence rate and tracking accuracy of our proposed NN-ABC controller outperform those of the NN-FAC controller.
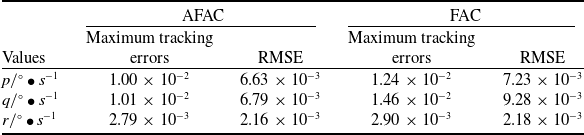
Figures 8 and 9 demonstrate tracking performances and tracking errors of the angular rates in different scenarios, respectively. The specific data analysing tracking performance are listed in Table 7. During the
Settling time of the flow angles in simulation 4.2

Variations of angular rates. (a) Variations of
 $p$
(b) Variations of
 $q$
(c) Variations of
 $r$
.

second phase (when t > 1.7s), the maximum values of tracking errors
 $p$
,
 $q$
and
 $r$
are respectively 19.4%, 30.8% and 3.8% lower than those for the NN-FAC when the proposed AFAC is used. It can be observed that the convergence rate and tracking accuracy of our proposed NN-ABC controller outperform those of the NN-FAC controller.
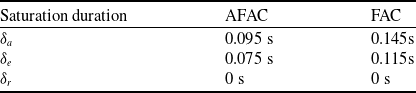
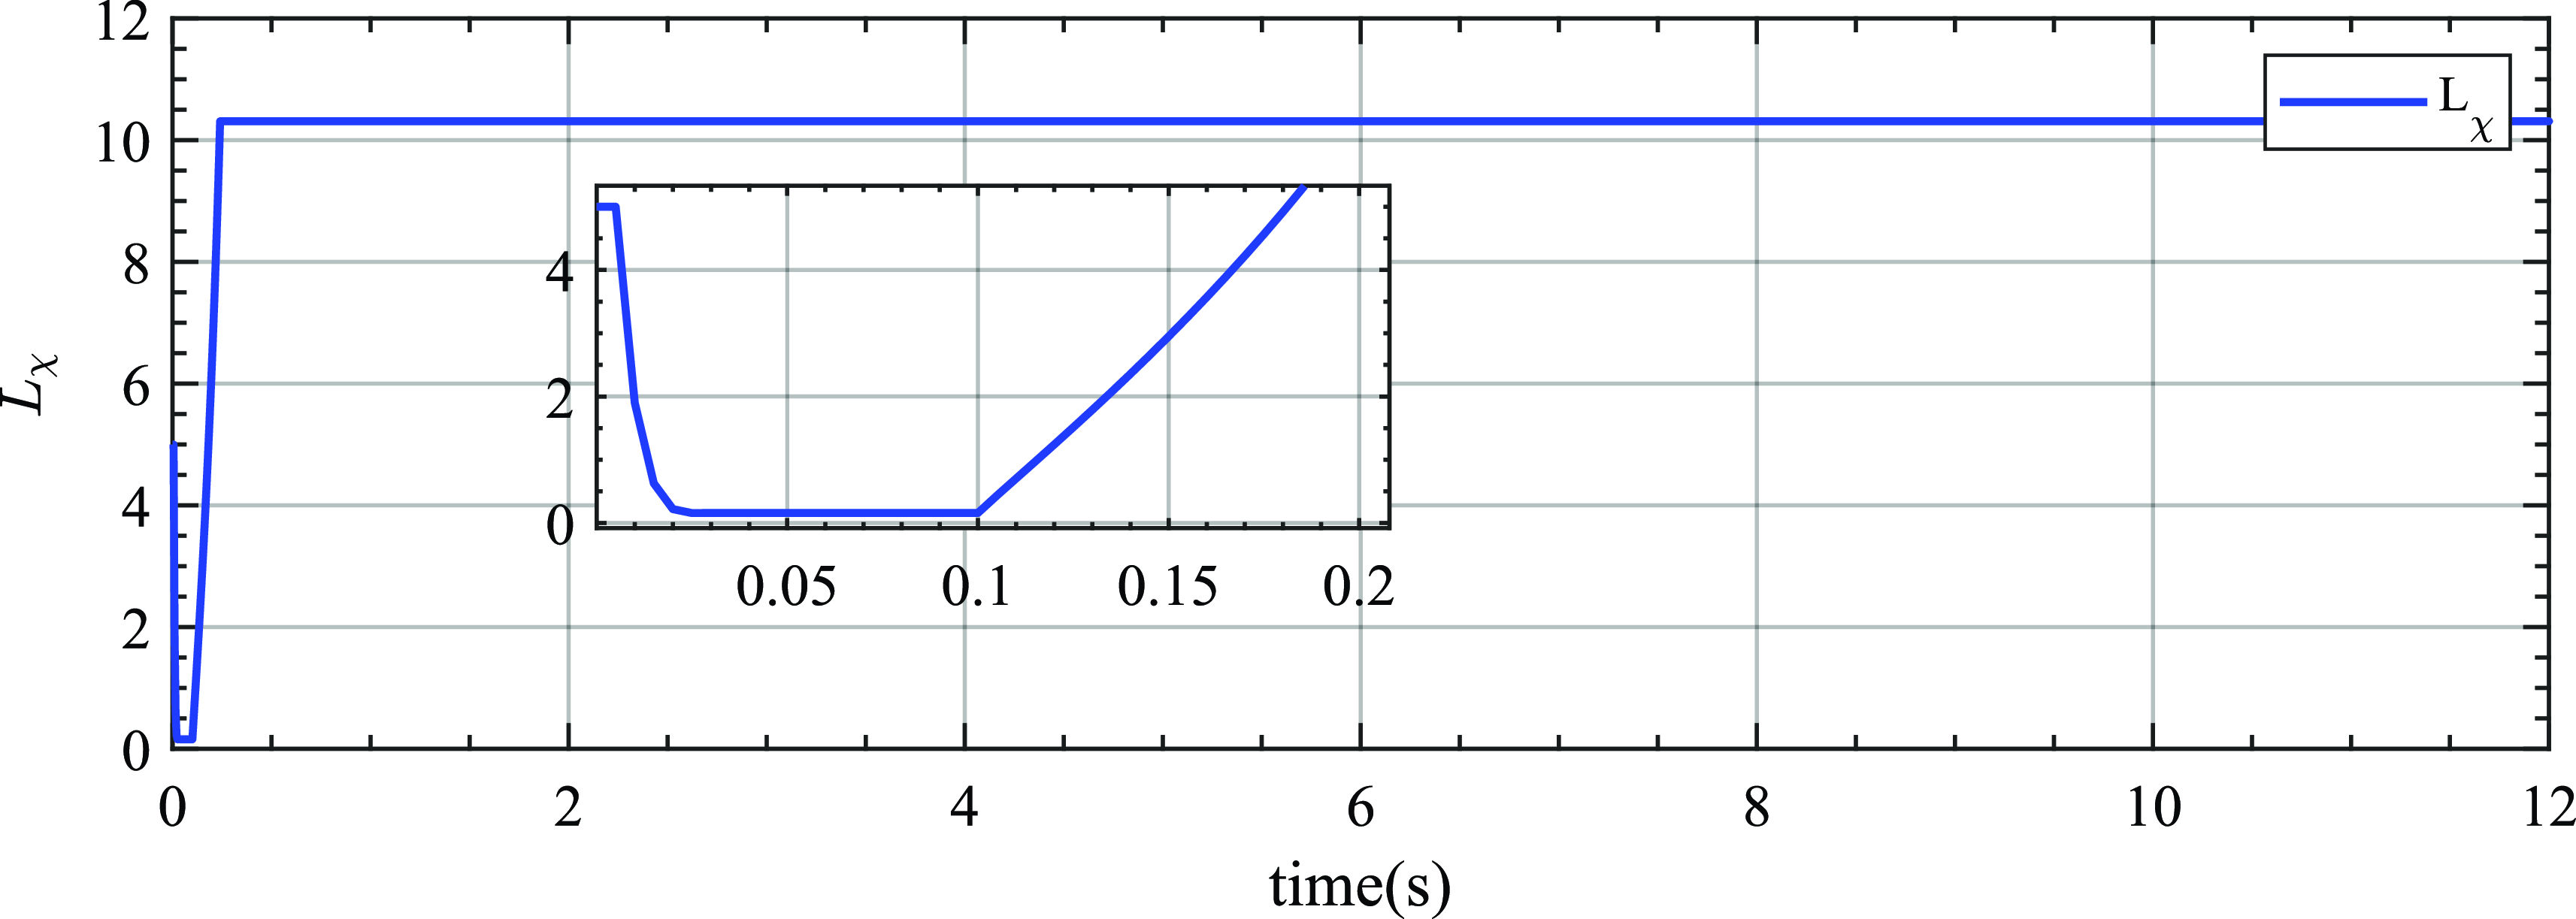
Figure 10 demonstrates the comparison variations of the control input, from which it can be observed that the saturation duration decreases when the AFAC is used. The particular data are listed in Table 9.
Comparison of angular rate tracking performances of AFAC and FAC in simulation 4.2 during the second phase (from t = 1.7s to t = 12s)

Tracking performances of the angular rates. (a) Variations of
 ${e_p}$
(b) Variations of
 ${e_q}$
(c) Variations of
 ${e_r}$
.

When the NN-ABC is used, the saturation time of
 ${\delta _a}$
,
 ${\delta _e}$
and
 ${\delta _r}$
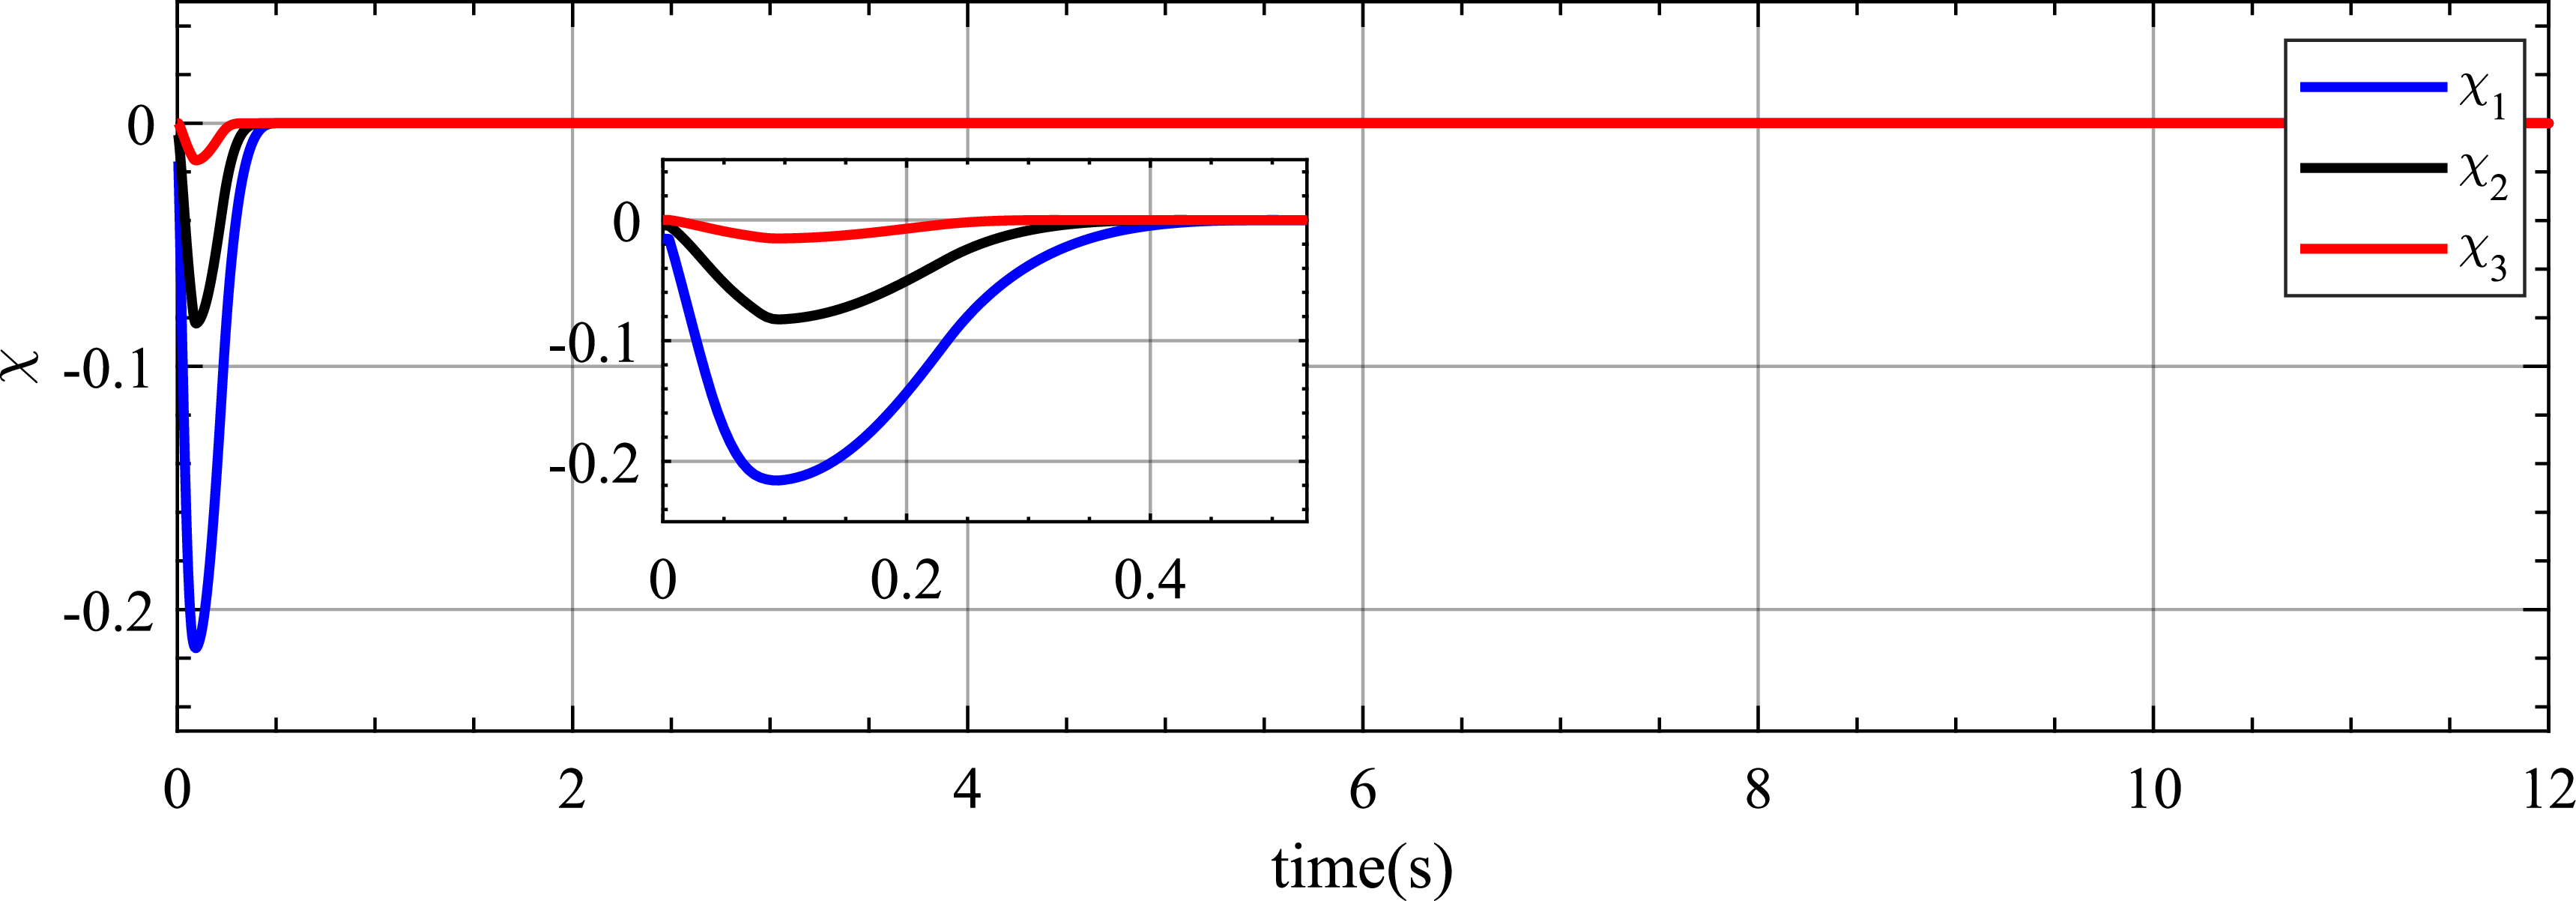
are reduced by a minimum of 34.35% compared to the comparative controller. Figures 11 and 12 demonstrate the variations of the auxiliary variable
 ${\boldsymbol{\chi}}$
and adaptive parameter
 ${L_\chi }$
, when the actuator
 ${\delta _a}$
and
 ${\delta _e}$
reach saturation, the auxiliary variable
 ${\boldsymbol{\chi}}$
begin to decrease, the adaptive parameter
 ${L_\chi }$
also quickly decreases to an appropriate size, thereby shortening the saturation time of the actuator. When the actuator no longer saturates, the adaptive parameter
 ${L_\chi }$
rapidly increases, facilitating the rapid convergence of the auxiliary variable
 ${\boldsymbol{\chi}}$
to zero.
4.2.2 Monte Carlo simulation
The results of 200 Monte Carlo simulations are presented to illustrate the robustness of the proposed AFAC. The aerodynamic uncertainties also follow a random distribution within the range of ±20% of their baseline values. Similarly, box plots are drawn to illustrate the effectiveness and robustness of the proposed scheme.
Settling time of the angular rates in simulation 4.2

Saturation duration in simulation 4.2

Variations of the control inputs. (a) Variations of
 ${\delta _a}$
(b) Variations of
 ${\delta _e}$
(c) Variations of
 ${\delta _r}$
.

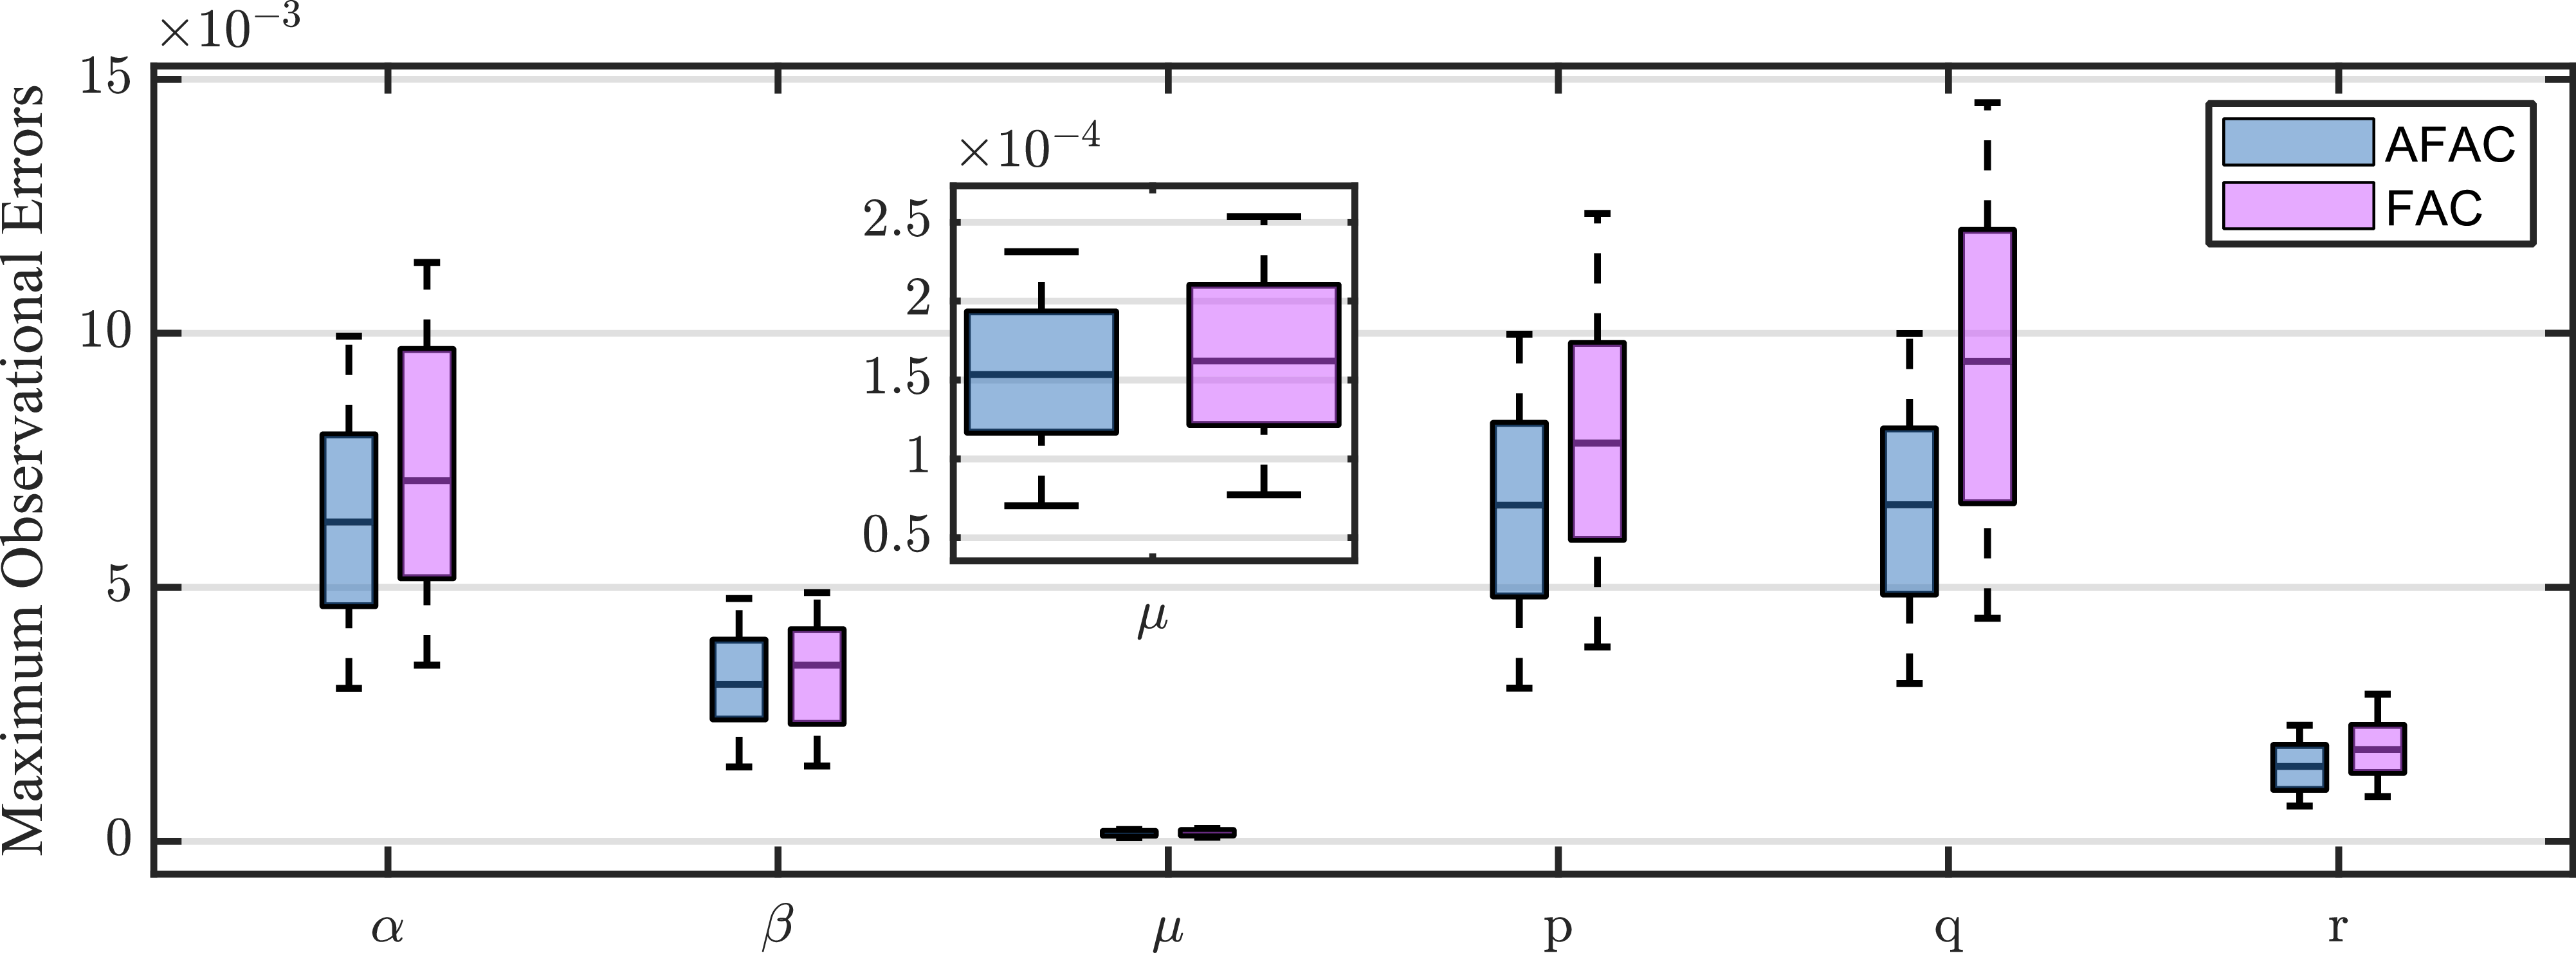
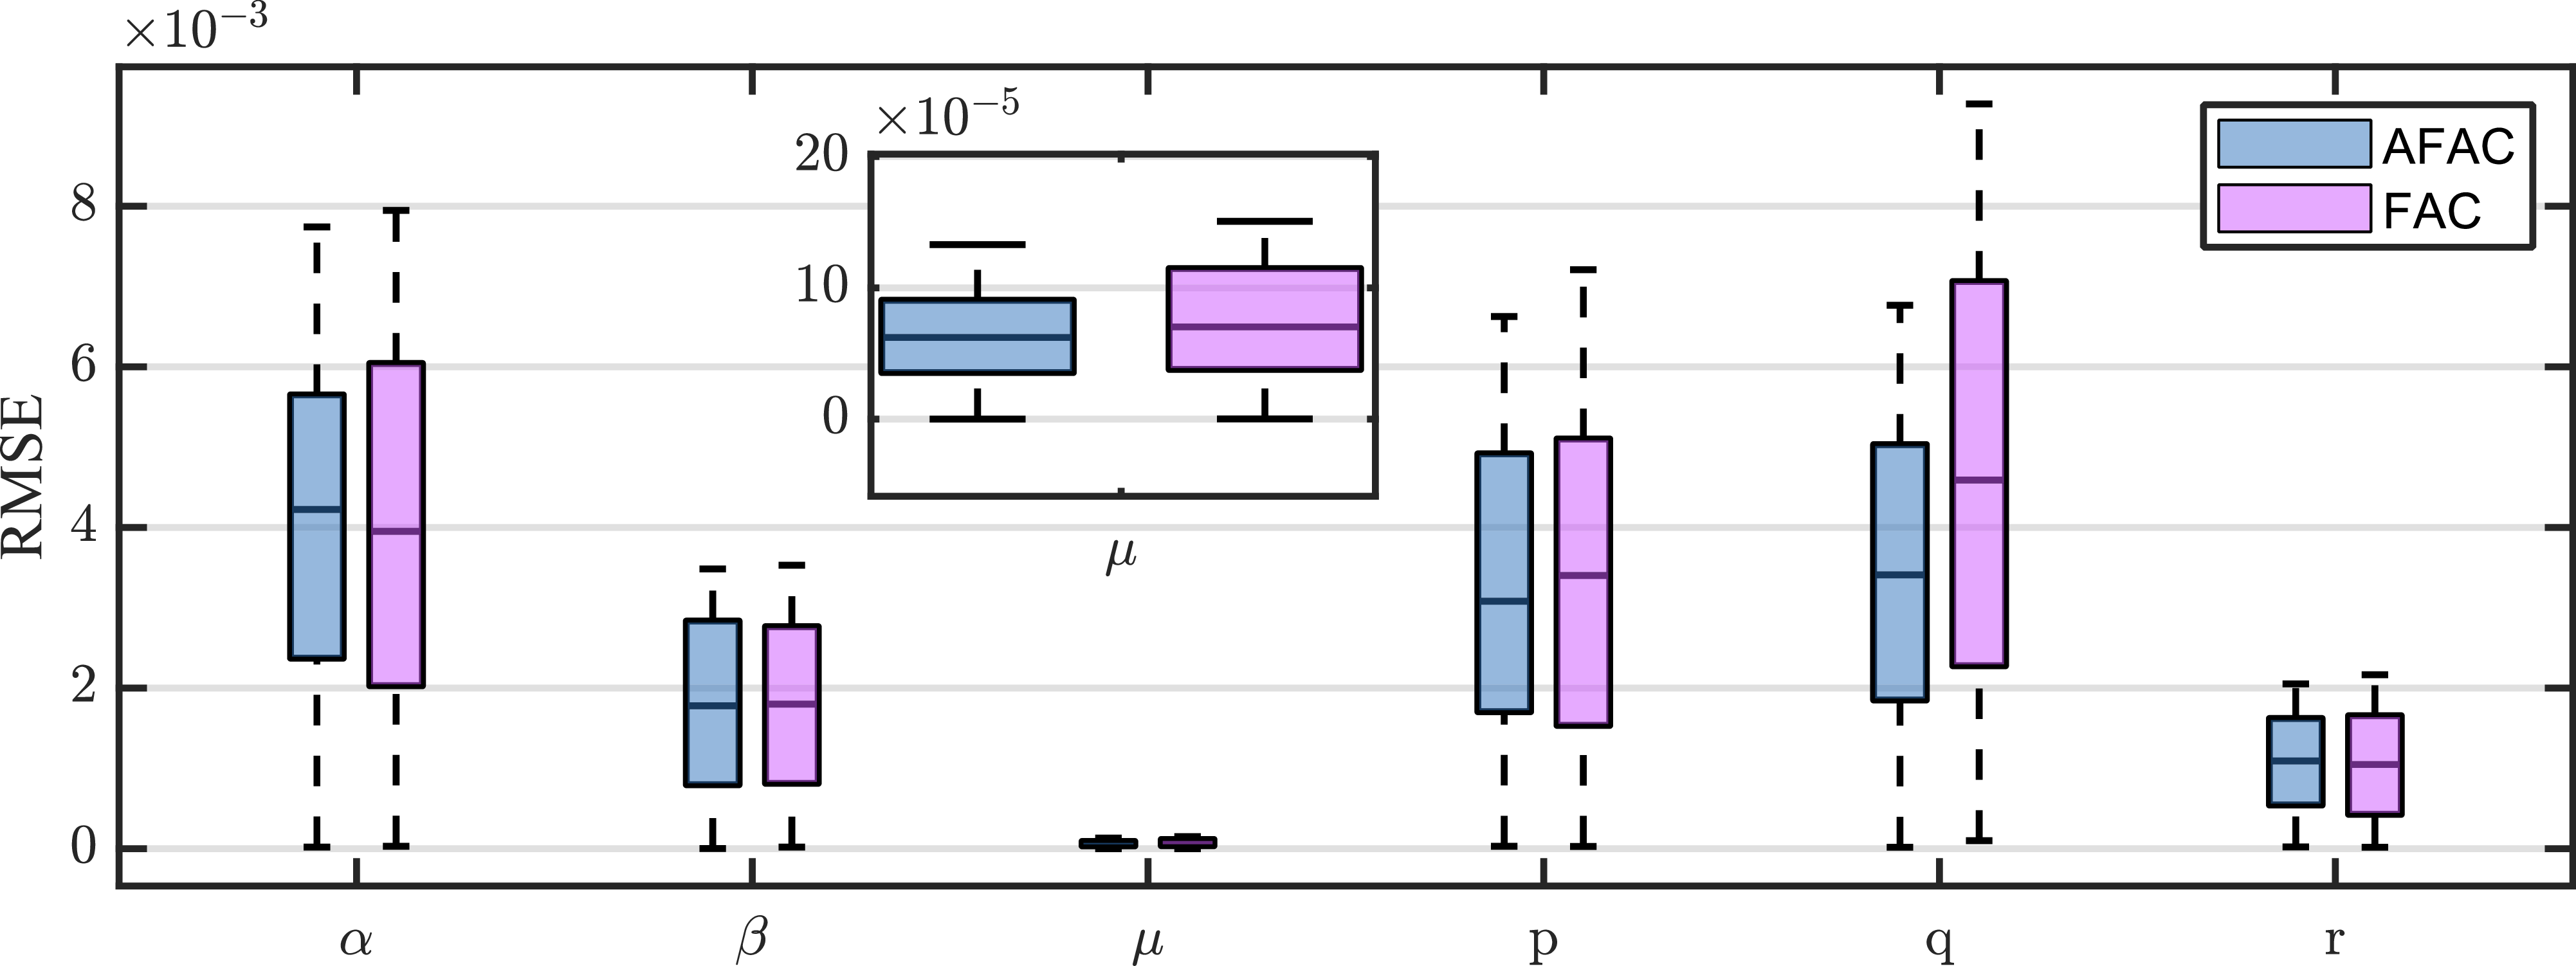
Figures 13 and 14 demonstrate the maximum tracking errors and RMSE of flow angles and angular rates command tracking using different controllers, respectively. The figures clearly show that AFAC has significantly lower average maximum tracking errors and RMSE than FAC under most parameter conditions. Further analysis of the box plots reveals that AFAC also exhibits superior stability, with a more concentrated data distribution and fewer outliers. This indicates that AFAC possesses greater robustness and reliability in handling uncertainties and disturbances.
Variations of the auxiliary variable
 ${\boldsymbol{\chi}}$
.

Variations of the adaptive parameter
 ${L_x}$
.

Comparison of the maximum observational errors of AFAC and FAC during the second phase (from t = 1.7s to t = 12s).

Comparison of RMSE of AFAC and FAC during the second phase (from t = 1.7s to t = 12s).

5.0 Conclusions
In this study, we designed a radial basis function neural network disturbance observer based anti-saturation backstepping controller for hypersonic vehicles. This paper adopted finite-time differentiators to address the problem of ‘explosion of complexity’, achieving higher tracking accuracy and tracking speed. Then, multivariable neural network disturbance observers are designed to estimate the lumped disturbances, by which the robustness of this controller has been greatly improved. In addition, the input saturation issue is dealt with by an adaptive fixed-time anti-saturation compensator that can minimise the saturation duration, and its auxiliary variable rapidly converges to zero after the saturation disappears. The flight control problems for hypersonic flight vehicles under multisource disturbances, and input saturation are systematically solved and analysed.
The simulation results have proven that our proposed controller is superior to the anti-saturation dynamic surface controller in terms of tracking precision, tracking speed and input saturation time. Subsequent research endeavors will employ wind tunnel experiments to replicate critical flight manoeuvres. The objective is to document the model’s control response, conduct a rigorous analysis of the data to evaluate the precision of the control algorithm and refine the algorithm based on empirical outcomes. This process is aimed at guaranteeing the algorithm’s efficacy and robustness for integration into actual flight control systems.
Future research endeavors will utilise wind tunnel experiments to replicate critical flight manoeuvres. The primary objective is to document the control response of the model, perform a rigorous and detailed analysis of the acquired data to meticulously evaluate the precision and accuracy of this study proposed control algorithm and subsequently refine and optimise the algorithm based on empirical outcomes and insights. This iterative process is designed to ensure the algorithm’s efficacy, robustness and reliability, thereby facilitating its integration into actual flight control systems.
Acknowledgements
This work was supported in part by the National Natural Science Foundation of China (Grant No. 62303363) and in part by the China National Postdoctoral Program for Innovative Talents (Grant No. BX20230278).
Data availability statement
The data used to support the findings of this study are included within the article.
Competing interests
The authors declare that they have no conflicts of interest to this work.