Implications
Evidence from northern Australia suggests that managers should apply a form of constrained flexible stocking with upper limits to stocking rate of about 20% to 40% above long-term carrying capacity. Stocking rates should be tactically adjusted on the basis of forage availability, and where appropriate, informed by seasonal climate forecasts. Even in the best years, annual stocking rate increases should be limited to 10% to 20% in order to avoid overstocking in the event of poor subsequent seasons. Stocking rates should be cut relatively rapidly, if required, by up to 40% to prevent overgrazing.
Introduction
Rangelands provide a large proportion of the world's food, fibre and ecosystem services, and their importance is likely to increase as the global population grows, the demand for meat increases and the availability of arable land declines (FAO, 2006; Brown and MacLeod, Reference Brown and MacLeod2011). Although the need for the sustainable management of rangelands is obvious, degradation is widespread and continues at an alarming rate (FAO, 2006).
The world's rangelands are extremely diverse but one unifying characteristic is the marked variability that occurs in the amount, timing and distribution of rainfall between years (Stafford Smith, Reference Stafford Smith1996). This variability has a major impact on forage availability causing substantial fluctuations in carrying capacity, animal production and profitability. In dry years, attempting to maintain stocking rates or adjusting animal numbers in a delayed, reactive fashion inevitably causes overgrazing (McKeon et al., Reference McKeon, Cunningham, Hall, Henry, Owens, Stone and Wilcox2004). This severely reduces animal production, while herd mortality and the expense of drought feeding can affect enterprise profitability for years (Hinton, Reference Hinton1993). Overgrazing in droughts can also lead to major, sometimes irreversible, declines in land condition (Westoby et al., Reference Westoby, Walker and Noy-Meir1989). Aside from its long-term impacts on productivity, the associated declines in ecosystem services such as reduced water quality are a major societal cost.
Above-average rainfall years conversely offer opportunities to increase animal production without causing degradation and compensate for losses in poor years. If correctly managed, for example, through pasture spelling (resting) or the use of fire to control woody plants, land condition can recover in wetter years, potentially improving animal production and restoring ecosystem services to former levels.
In Australia, rainfall variability is particularly pronounced and occurs at annual, decadal, generational and longer time scales (McKeon et al., Reference McKeon, Day, Howden, Mott, Orr, Scattini and Weston1990). This variability is a major challenge to sustainable management with eight major degradation episodes documented since 1900 (McKeon et al., Reference McKeon, Cunningham, Hall, Henry, Owens, Stone and Wilcox2004). All followed a similar pattern: typically, high commodity prices and wet years resulted in extremely high stock numbers. Drought inevitably followed, but because of low commodity prices, stocking rates were not reduced, catastrophic overgrazing occurred and degradation to a lower, less productive rangeland state ensued (McKeon et al., Reference McKeon, Cunningham, Hall, Henry, Owens, Stone and Wilcox2004). In all cases, the degradation largely resulted from a lack of appreciation of environmental variability, its unpredictability and a failure to manage accordingly.
Although droughts have always occurred in northern Australia, their impact on land condition has increased since the 1970s because of the introduction of hardier Bos indicus cattle, advances in feed supplements (Gardner et al., Reference Gardner, McIvor and Williams1990; McKeon et al., Reference McKeon, Cunningham, Hall, Henry, Owens, Stone and Wilcox2004), the provision of artificial water points and increased fencing for smaller paddocks (Stokes et al., Reference Stokes, McAllister and Ash2006). These factors have allowed grazing pressure to be maintained at an unprecedented scale in droughts leading to significant declines in land condition. In north Queensland, this has led to a decline in perennial grasses, reduced ground cover and increased soil erosion (Karfs et al., Reference Karfs, Abbott, Scarth and Wallace2009). Runoff water quality has also declined threatening key downstream ecosystems like the Great Barrier Reef lagoon (Furnas, Reference Furnas2003). With climate change projections of a hotter, drier and potentially more variable climate, sustainable management of northern Australian rangelands is likely to become even more challenging (McKeon et al., Reference McKeon, Stone, Syktus, Carter, Flood, Ahrens, Bruget, Chilcott, Cobon, Cowley, Crimp, Fraser, Howden, Johnston, Ryan, Stokes and Day2009).
Significant advances in the understanding, prediction and management of climate variability on rangelands have nevertheless been made over the last 30 years in Australia. This paper presents some of these learnings and insights gained in sustainable grazing management in a highly variable environment. Although based primarily on the Australian experience, they are also relevant to other areas of the world facing similar issues.
To provide context, the characteristics of the extensive grazing industry in northern Australia are first briefly described and recommended grazing strategies for managing for climate variability are presented. The potential use of seasonal climate forecasting, as well as other tools to tactically manage stocking rates at paddock and property scales are then discussed. Results from recent research and simulation modelling of the effect of different management strategies on sustainability and profitability are also presented. The paper concludes with suggested strategies for managing for rainfall variability on grazed rangelands and for future research in the area.
The situation in northern Australia
The extensive pastoral regions of northern Australia have been grazed by domestic livestock for approximately the last 150 years (Stokes et al., Reference Stokes, McAllister and Ash2006) and occupy a vast area stretching from Queensland to Western Australia. Annual rainfall varies from 400 mm in the semiarid interior to 1000 mm at the coast (Mott et al., Reference Mott, Williams, Andrew and Gillison1984). Inter-annual rainfall variability is high but varies between regions; for example, the coefficient of variation in annual rainfall for Katherine in the Northern Territory is considerably lower (25% v. 39%) than in Charters Towers, north-east Queensland (Clewett et al., Reference Clewett, Clarkson, George, Ooi, Owens, Partridge and Simpson2003). Overall, rainfall is strongly summer dominant, although the strength of this seasonality decreases slightly moving north to south (McKeon et al., Reference McKeon, Day, Howden, Mott, Orr, Scattini and Weston1990). Thus, there is usually a long dry season characterised by very low forage quality with severe nutritional constraints to livestock production (Mott et al., Reference Mott, Williams, Andrew and Gillison1984). The onset and length of the wet season is also highly variable both spatially and temporally (Garnett and Williamson, Reference Garnett and Williamson2010).
Overall, soils are generally infertile, although smaller areas of more fertile soils from ancient alluvial deposition occur. The vegetation includes Eucalyptus woodland, Acacia shrubland and almost treeless tussock grasslands on extensive plains (Mott et al., Reference Mott, Williams, Andrew and Gillison1984).
Grazing properties are large (20 000 to 300 000 ha) with property sizes tending to be relatively smaller in Queensland than in the Northern Territory or Western Australia. Overall, productivity is usually low because of rainfall and/or fertility constraints. Although inputs are generally low, large herd sizes (>2500 breeding cows) are required for viability because of high costs and low prices. Labour is expensive and infrastructure like water points, handling facilities and fences are often limited. Management strategies for coping with rainfall variability accordingly have to be relatively simple and easy to implement, which tends to preclude intensive grazing systems like cell grazing.
Stocking strategies to cope with rainfall variability
Stocking strategies recommended to manage for rainfall variability in Australian rangelands (Ebersohn, Reference Ebersohn1973; McKeon et al., Reference McKeon, Day, Howden, Mott, Orr, Scattini and Weston1990; Stafford Smith, Reference Stafford Smith1996; Ash et al., Reference Ash, O'Reagain, McKeon and Stafford Smith2000; Johnston et al., Reference Johnston, Buxton, Coban, Day, Hall and Scanlan2000) fall into two broad groups: stocking at long-term carrying capacity (LTCC) and varying stock numbers with rainfall. These are discussed below.
Stocking at LTCC
Conservative stocking at LTCC aims to utilise some ‘safe’ amount of forage to ensure sustainable resource use. Depending on land type and rainfall, the level of safe use ranges from 10% to 30% of the average annual pasture growth (Scanlan et al., Reference Scanlan, McKeon, Day, Mott and Hinton1994; Hunt, Reference Hunt2008; McKeon et al., Reference McKeon, Stone, Syktus, Carter, Flood, Ahrens, Bruget, Chilcott, Cobon, Cowley, Crimp, Fraser, Howden, Johnston, Ryan, Stokes and Day2009). Conservative stocking aims to maintain sufficient forage in most years so that stocking rates do not have to be adjusted. Lighter pasture utilisation rates maintain desirable perennial forage species and facilitate other management activities, such as spelling or fire, which further improve land condition (Landsberg et al., Reference Landsberg, Ash, Shepherd and McKeon1998). Although overgrazing may occur in extreme droughts, this is assumed to be sufficiently rare to minimise degradation and allow recovery in better seasons. Maintaining pasture condition and minimising fodder deficits ensure relatively stable productivity and economic returns in the long term.
Relative to heavy stocking, constant stocking at LTCC carries opportunity costs associated with being understocked in wet years, but these are assumed to be outweighed by relatively low input costs and the maintenance of at least some animal production in drought years (Wilson and Macleod, Reference Wilson and Macleod1991). The strategy also carries far less risk and requires less managerial input than strategies like variable stocking.
Variable stocking
This aims to adjust stock numbers to match changes in forage availability (Ash et al., Reference Ash, O'Reagain, McKeon and Stafford Smith2000). It seeks to avoid the large costs and impacts of drought years that occur with heavy stocking but capitalise on good seasons (Perry, Reference Perry1977). In strongly seasonal environments like northern Australia, the logical time to adjust stocking rates is at the end of the wet season, when further pasture growth is unlikely for the next 6 to 9 months (Ebersohn, Reference Ebersohn1973). Variable stocking is obviously more difficult to apply where rainfall is less markedly seasonal.
Theoretically, the strategy should outperform constant stocking at LTCC as it avoids the opportunity costs of being understocked in good years, as well as the economic and environmental costs associated with maintaining stocking rates in drought. It may also be possible to apply a higher, long-term average stocking rate without causing degradation. However, variable stocking is far riskier both economically and environmentally and requires greater management skill than constant stocking at LTCC. In particular, there is a high risk of overgrazing if stocking rates are not cut appropriately when going from high to low rainfall years (McKeon et al., Reference McKeon, Cunningham, Hall, Henry, Owens, Stone and Wilcox2004; Hunt, Reference Hunt2008).
Seasonal climate forecasts (SCF)
A major weakness of all strategies is that the stocking rates applied are based on either historical rainfall (stocking at LTCC) or on antecedent rainfall via available forage (variable stocking), that is, they are reactive rather than proactive (McKeon et al., Reference McKeon, Howden, Abel and King1993). All are thus vulnerable to extreme droughts or to unexpected shifts from wet to dry years. Climate change in particular could compromise estimates of LTCC or short-term stocking rates based on the historical amount, distribution and timing of rainfall (McKeon et al., Reference McKeon, Stone, Syktus, Carter, Flood, Ahrens, Bruget, Chilcott, Cobon, Cowley, Crimp, Fraser, Howden, Johnston, Ryan, Stokes and Day2009). Here, SCF have potential as a decision aid in proactively adjusting stocking rates to minimise drought impacts and exploit better seasons (McKeon et al., Reference McKeon, Day, Howden, Mott, Orr, Scattini and Weston1990).
A number of statistical SCF have been developed based on analysis of historical relations between rainfall and indices like the Southern Oscillation Index (SOI) and/or sea surface temperatures (Stone and de Hoedt, Reference Stone and de Hoedt2000). In northern Australia, the SOI phase system (Stone et al., Reference Stone, Hammer and Marcussen1996) is probably the most widely used; it gives a regional, probabilistic prediction of rainfall for the next 3 months based on the SOI phase over the preceding 60 days (Anonymous, 2011a). Wet season forecasts are thus based on the August–November SOI, giving a 3-month outlook. Forecast skill is highest in north-eastern Australia, but varies strongly between regions (Ash et al., Reference Ash, MacLeod, Smith, McDonald and McIntosh2002) and time of year (McBride and Nicholls, Reference McBride and Nicholls1983).
The strength of the rainfall–SOI relationship should thus always be assessed for individual properties using tools such as Australian Rainman Streamflow (Clewett et al., Reference Clewett, Clarkson, George, Ooi, Owens, Partridge and Simpson2003). Even where forecast skill is high, the relatively short, 3-month outlook of current forecasts limits stocking rate decisions to the late dry season when animals are often in poor condition (Ash et al., Reference Ash, O'Reagain, McKeon and Stafford Smith2000). Newer forecasts with longer lead times such as SPOTA-1 (Anonymous, 2011b) should allow stocking rate adjustments at the end of the wet season in June when stock are in better condition (Ash et al., Reference Ash, O'Reagain, McKeon and Stafford Smith2000). Forecasts to predict the likely start of the wet season are also being developed (Lo et al., Reference Lo, Wheeler, Meinke and Donald2007; Garnett and Williamson, Reference Garnett and Williamson2010).
Simulation modelling suggests that relative to simply stocking at LTCC, the benefits of using SCF to manage stocking rates range from modest to significant, depending on the SOI–rainfall relationship for a particular area (Ash et al., Reference Ash, O'Reagain, McKeon and Stafford Smith2000 and Reference Ash, MacLeod, Smith, McDonald and McIntosh2002). Nevertheless, improved SCF reliability and longer lead times would give significant benefits in productivity and resource condition (McKeon et al., Reference McKeon, Ash, Hall and Strafford-Smith2000).
In summary, SCF are an important management tool in managing for rainfall variability if used appropriately, that is, in a location-specific probabilistic manner. However, they will always be of secondary importance to other factors such as forage availability, current stocking rates or prevailing market conditions in major stocking rate decisions.
Strategic management of stocking rates
Estimating LTCC
Whatever the strategy utilised in managing for climate variability, an accurate estimate of LTCC is critical. General estimates of LTCC can be obtained from well-managed properties but are difficult to extrapolate to other land types in different condition.
In northern Australia, the GRASP model has been used extensively to estimate the LTCC of individual land types (McKeon et al., Reference McKeon, Stone, Syktus, Carter, Flood, Ahrens, Bruget, Chilcott, Cobon, Cowley, Crimp, Fraser, Howden, Johnston, Ryan, Stokes and Day2009). GRASP is a point-based simulation model that predicts pasture growth, animal production and soil loss from climate, vegetation, soil and stocking rate data. Average annual pasture production for a particular land type is simulated using long-term rainfall records, and a ‘safe’ pasture utilisation rate, for example, 20% to 25%, is then applied to calculate LTCC (Scanlan et al., Reference Scanlan, McKeon, Day, Mott and Hinton1994). Comparison with long-term stocking rates on well-managed, good condition properties generally show good agreement between modelled and observed LTCC (McKeon et al., Reference McKeon, Stone, Syktus, Carter, Flood, Ahrens, Bruget, Chilcott, Cobon, Cowley, Crimp, Fraser, Howden, Johnston, Ryan, Stokes and Day2009).
As paddocks are the basic management unit, reliable estimates of paddock LTCC are crucial for sustainable management. However, estimating LTCC in large spatially heterogeneous paddocks is challenging. Water points are often widely spaced, with cattle having to walk distances of 3 to 8 km to graze (Mott et al., Reference Mott, Williams, Andrew and Gillison1984; Hunt et al., Reference Hunt, Petty, Cowley, Fisher, Ash and MacDonald2007), resulting in patchy use. In the large paddocks of the Northern Territory, for example, cows graze anything from 85% of smaller paddocks to only 49% of larger paddocks (Hunt et al., Reference Hunt, Petty, Cowley, Fisher, White, MacDonald, Pryor, Ash, McCosker, McIvor and MacLeod2011).
A GRASP-based method for estimating paddock LTCC has consequently been developed using rainfall, land type, land condition and water point distribution in individual paddocks (Hamilton et al., Reference Hamilton, Chilcott and Savage2008). Although relatively objective, such estimates of LTCC must nevertheless be used with caution. First, overgrazing of preferred areas can still occur even at ‘safe’ stocking rates. Second, paddock LTCC can easily be overestimated if GRASP is incorrectly calibrated for a site. Estimates of LTCC can also vary markedly depending on the time period used to characterise long-term rainfall, for example, 25 v. 50 or 100 years. Most importantly, LTCC estimates are long-term strategic values (Hunt, Reference Hunt2008) that set the baseline around which stocking rates are tactically managed as seasons vary; they are not fixed stocking rates that can be applied irrespective of seasonal conditions.
Tactical management of stocking rate
This involves matching stocking rates to forage supply, usually for periods of less than a year, to ensure sufficient forage until the next stocking rate adjustment point and prevent overgrazing and degradation. One approach involves calculating a moving ‘Stocking rate index’ on the basis of rainfall and stock grazing days or stocking rates over the previous 12 months. The index is then graphically related to a land type-specific LTCC benchmark and stocking rates adjusted to remain within specified boundaries of LTCC (Bartle 2003, cited by Hacker and Smith, Reference Hacker and Smith2007). A weakness of the approach is that the pasture response to rainfall depends strongly on rainfall effectiveness. However, such indices are still valuable as an early warning of impending fodder deficits, particularly when linked with SCF to identify ‘trigger points’ when stocking rate decisions are required (Hacker et al., Reference Hacker, Alemseged, Carberry, Browne and Smith2006).
A more reliable approach is that of forage budgeting where pasture total standing dry matter (TSDM) is monitored and stocking rates are adjusted accordingly. In northern Australia, the obvious time to do this is at the end of the wet season in about May (Ebersohn, Reference Ebersohn1973). The expected budget period is taken as either the dry season (plus a buffer of a few months to allow for a late wet season) or the complete year until the end of the following wet season. Pasture TSDM is then discounted for various factors to give available pasture and short-term stocking rate is calculated (e.g. Aisthorpe et al., Reference Aisthorpe, Paton and Timmers2004). Although apparently straightforward, the application of forage budgeting on rangelands is far from simple: in particular, major difficulties exist in obtaining an accurate estimate of available forage in large, spatially heterogeneous paddocks. Pasture TSDM can be visually estimated with land type-specific photo yield standards (Aisthorpe et al., Reference Aisthorpe, Paton and Timmers2004); however, it is time consuming and depends on representative sampling of land types and distances from water.
Remote sensing has been successfully used to estimate pasture mass in sown pastures, for example, http://www.pasturesfromspace.csiro.au/, but major difficulties exist in its application in large, diverse rangeland paddocks (G. Bastin, personal communication). Real-time simulation models could also be used to predict pasture growth from antecedent rainfall in a manner similar to the national AussieGrass system (Carter et al., Reference Carter, Hall, Brook, McKeon, Day and Paul2000; McKeon et al., Reference McKeon, Stone, Syktus, Carter, Flood, Ahrens, Bruget, Chilcott, Cobon, Cowley, Crimp, Fraser, Howden, Johnston, Ryan, Stokes and Day2009). However, the detailed model parameterisation and data input required would make this methodology unsuitable for most managers (R. A. Cowley, personal communication).
Accounting for the potential forage growth in the coming wet season is also a major uncertainty. One method currently being trialled adjusts stocking rates partly on existing pasture TSDM and partly on SOI-based predictions of expected growth for the approaching season (P. J. O'Reagain, unpublished data).
However, possibly, the major challenge is how stock numbers should be adjusted as conditions change without compromising future enterprise profitability or sustainability, particularly where breeders are concerned. For example, comparison of two drought destocking options of either selling all weaners or a percentage of all steer age groups revealed that, after 10 years, the cash balance of the second option was 10% greater than the first. This benefit largely arose because selling all weaners resulted in a large gap in cash flow in later years when these animals were normally sold (Buxton and Stafford Smith, Reference Buxton and Stafford Smith1996).
The extent and manner in which stock numbers should be increased in good seasons is also an issue. Rapid increases in numbers post drought may maximise short-term profitability but will retard pasture recovery (Danckwerts et al., Reference Danckwerts, O'Reagain and O'Connor1993; Stone, Reference Stone2004), ultimately depressing profitability (Buxton and Stafford Smith, Reference Buxton and Stafford Smith1996). Any increase in stock numbers should also factor in the current stocking rate relative to LTCC, that is, if currently stocked well below LTCC increasing stocking rates to this level has a relatively low level of risk. Conversely, if stocked close to LTCC, increasing stock numbers above this level is far riskier (Scanlan et al., Reference Scanlan, Pahl, Whish, Macleod, Cowley and Phelps2011a). In the latter situation, purchased stock should be relatively disposable (e.g. steers) and not increase vulnerability to future low rainfall periods.
In all cases, the appropriate destocking or restocking action will vary with region, cattle prices and circumstances (Buxton and Stafford Smith, Reference Buxton and Stafford Smith1996; Stafford Smith et al., Reference Stafford Smith, Buxton, McKeon and Ash2000; Diaz-Solis et al., Reference Diaz-Solis, Grant, Kothmann, Teague and Diaz-Garcia2009). Managers can explore the effect of different options on herd structure and profitability using software such as Breedcow or Dynama (Holmes, Reference Holmes2002).
Insights from grazing trials
Previous grazing trials in northern Australia provided a sound, basic understanding of the effects of grazing management on land condition and animal production (e.g. McIvor and Gardner, Reference McIvor and Gardner1995). However, all involved relatively small, uniform paddocks of between 3 and 30 ha, with small groups of animals (e.g. Burrows et al., Reference Burrows, Orr, Hendricksen, Rutherford, Myles, Back and Gowen2010; Ash et al., Reference Ash, McIvor, Corfield and Ksiksi2011). This lack of scale and spatial complexity limits their relevance to larger, more heterogeneous commercial paddocks where production and rangeland responses may be significantly different (Ash and Stafford Smith, Reference Ash and Stafford Smith1996). Until recently, there was thus surprisingly little direct empirical evidence at an appropriate scale, comparing the profitability and performance of different grazing strategies. This apparent lack of evidence has been an important factor limiting adoption of more sustainable management by land managers (O'Reagain et al., Reference O'Reagain, McKeon, Day and Ash2003).
Three recent grazing experiments have attempted to remedy these issues by using larger, spatially heterogeneous paddocks. The most relevant is probably the ongoing, 13-year Wambiana grazing trial in Queensland, initiated to specifically test the ability of different grazing strategies to cope with rainfall variability (O'Reagain et al., Reference O'Reagain, Bushell, Holloway and Reid2009 and Reference O'Reagain, Bushell and Holmes2011). The shorter, 4-year Pigeonhole (PGH; Hunt et al., Reference Hunt, Petty, Cowley, Fisher, White, MacDonald, Pryor, Ash, McCosker, McIvor and MacLeod2011) and 6-year Mt Sanford (MS; Cowley et al., Reference Cowley, McCosker, MacDonald and Hearnden2007) trials in the Northern Territory are also important. Neither trials explicitly addressed climate variability, but the issue was implicit in the approach adopted of varying stocking rates as pasture mass varied between years. The following section largely concentrates on the Wambiana trial because its results are the most pertinent to the issue of managing for rainfall variability. The PGH and MS results are given in lesser detail, given their different focus, shorter term and unreplicated nature.
Wambiana grazing trial
The Wambiana grazing trial was established in 1997 in an Eucalyptus savanna near Charters Towers, Queensland. Paddocks are large (100 ha) and spatially heterogeneous with similar proportions of the different land types in each. Strategies tested were constant moderate stocking (MSR) stocked at the estimated LTCC of 8 ha/animal equivalent (AE = 450 kg steer) and HSR at twice LTCC, that is, 4 ha/AE. Two variable strategies were also applied with stocking rates adjusted annually on the basis of either (a) forage availability at the end of the wet season (May) or (b) available forage in October/November and SOI-based climate forecasts for the coming wet season. Both of the latter treatments gave similar outcomes and are generically referred to here as ‘VAR’.
Results
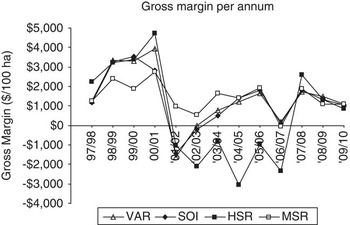
The HSR strategy stocked at about twice LTCC gave good economic and animal performance in the initial wet years but suffered major economic loss in subsequent dry years through high costs, poor individual animal production and reduced product value at the meatworks. The strategy was also unsustainable with stocking rates having to be reduced in dry years and perennial grass density and basal area declining (Orr and O'Reagain, Reference Orr and O'Reagain2011). Profitability recovered in later good rainfall years, but after 13 years the overall profitability of the HSR was by far the lowest of all strategies (Figure 1). Ground cover, but not perennial grass density, recovered in later, wetter years, indicating that land condition has not fully recovered (Table 1). Animal production and profitability are thus likely to slump again in future dry years, leading to ongoing ‘boom and bust’ cycles and further declines in land condition.
Annual gross margin ($) per 100 ha for four grazing strategies run at the Wambiana grazing trial from 1997/98 to 2009/10. VAR = variable stocking; HSR = heavy stocking; MSR = moderate stocking; SOI = Southern Oscillation Index variable. Note: This is a modified version of the figure previously published in O'Reagain et al. (Reference O'Reagain, Bushell and Holmes2011).

Key indicator variables for four stocking strategies at the Wambiana trial in northern Australia

HSR = heavy stocking rate; MSR = moderate stocking rate; SOI = Southern Oscillation Index variable; VAR = variable strategy; LWG = live weight gain, ha = hectare, hd = head, DS = dry season.
Within rows, values followed by the same letter are not significantly different (P > 0.05).
13P grasses are palatable, productive and perennial grasses.
2Percentage of end-of-wet season pasture yield.
In contrast, constant moderate stocking at LTCC gave relatively consistent economic outcomes. Although profitability was relatively modest in the initial wet years (Figure 1), profitability was largely maintained in dry years because of relatively good individual animal production, meatworks price premiums for better animal condition and lower costs. Overall, the MSR was far more profitable than the HSR and was of similar profitability to the two VAR strategies. The MSR strategy also maintained perennial grass density (Table 1) and accordingly had the best land condition.
The VAR strategy was initially very profitable because of high stocking rates in the early wet years. However, profitability crashed in the first dry year (2001/02) because of low productivity and the sale of poor condition animals as stocking rates were cut. Importantly, this sharp cut in stocking rates avoided the costs of drought feeding and improved animal production, allowing a rapid recovery in profitability. Overall, the VAR was far more profitable than the HSR and was of similar profitability to the MSR. However, high stocking rates in the VAR leading into the dry years adversely affected perennial grass density, reducing land condition relative to the MSR. This effect was still evident 9 years later in 2010 (Table 1).
What was learnt at the Wambiana trial?
Heavy constant stocking above LTCC is clearly an unsustainable and unprofitable strategy in managing for rainfall variability. In contrast, constant stocking at LTCC was generally both profitable and sustainable. Despite this, in very dry years, overgrazing occurred and individual animal production declined in the MSR compared with the two variable strategies that were relatively lightly stocked at this stage. The MSR strategy would thus be improved by some stocking rate flexibility to minimise overgrazing in very dry years and take advantage of wetter cycles.
Variable stocking, at least as applied here, showed potential as a means of capitalising on good years and avoiding excessive losses in poor years. However, the risks and adverse impacts associated with large changes in stocking rate, relative to simply stocking at LTCC, were also clearly demonstrated. Variable stocking would be improved by setting upper stocking rate limits to prevent overgrazing when very good seasons are immediately followed by poor years. Stocking rate adjustments should thus be made in a risk-averse manner with upper limits set on stocking rates and the rate of increase between years; conversely, stocking rate reductions when conditions are deteriorating or expected to deteriorate could be far sharper. This is logical, given that the potential loss from being overstocked in a poor year far exceeds the opportunity costs of being understocked in a good year.
In agreement with Ebersohn (Reference Ebersohn1973), the primary stocking rate decision point should be based on forage availability at the end of wet season, as uncertainty regarding forage availability and future growth are lowest at this point. As noted by Savory, ‘the only realistic way of setting stocking rates is to do so based on the forage that has actually grown’ (Savory and Butterfield, Reference Savory and Butterfield1999, p. 512).
Other secondary adjustment points to reduce (not increase) stocking rates further if required are also logical. These could be in the late dry season (October/November) when available forage, animal condition and SCF would be re-assessed. A further adjustment point in the early-mid wet season would also ensure timely stocking rate reductions if the wet season failed.
Limitations of Wambiana trial results
The Wambiana results were from steers, thus extrapolation to breeder operations requires caution (Ash and Stafford Smith, Reference Ash and Stafford Smith1996). Paddocks (100 ha) were also relatively small compared with commercial reality (>2000 ha). Although the 13-year trial period is adequate for an economic analysis, it is relatively short relative to rainfall patterns and rates of ecological change, and treatment differences are still emerging. Trial outcomes might also have been different with a different sequence of rainfall years. These are important issues but will be at least partially addressed through modelling and ongoing research at the site.
The assumptions used in the economic analysis, such as the price premium for cattle condition and interest costs on livestock capital, also influenced outcomes. These assumptions could be quite different in other situations. Conversely, the analysis did not include the environmental costs or the stress or time costs to managers that different strategies would incur. Inclusion of these costs would undoubtedly reinforce the case for more sustainable strategies like moderate stocking (O'Reagain et al., Reference O'Reagain, Bushell and Holmes2011).
PGH and MS trial
The MS and PGH trials ran from 2001 to 2006 and from 2004 to 2007, respectively, in an open savanna grassland about 500 km south west of Katherine in the Northern Territory (Cowley et al., Reference Cowley, McCosker, MacDonald and Hearnden2007; Cowley and McCosker, Reference Cowley and McCosker2011). Stocking rates in both trials were adjusted annually on the basis of end-of-wet season (May) pasture TSDM to achieve different target pasture utilisation rates of between 12% and 45% at MS and between 15% and 40% at PGH, that is, variable stocking was applied. Paddock sizes were large, that is, 400 to 800 ha at MS and approximately 2100 ha at PGH. Importantly, both trials were stocked with breeders. Conditions at these sites were thus directly comparable with commercial properties. Indeed, with a trial area of 35 000 ha and total cattle numbers of 5000, the PGH project was unprecedented in scale in Australia.
Results
Increasing pasture utilisation rate had no effect on land condition at either site, reflecting the good rainfall received, stable vertosol soils and the relatively short duration of both studies (Cowley et al., Reference Cowley, McCosker, MacDonald and Hearnden2007; Hunt et al., Reference Hunt, Petty, Cowley, Fisher, White, MacDonald, Pryor, Ash, McCosker, McIvor and MacLeod2011). On the basis of meeting minimum yield and cover targets to reduce runoff and minimise pasture deterioration, it was nevertheless concluded that optimum annual pasture utilisation rates were 19% and 23% for PGH and MS, respectively.
Although total live weight gain per area (LWG/ha) increased with pasture utilisation rate, there was evidence at MS that reproductive indices like weaning rate and breeder efficiency declined as utilisation rates increased. Importantly, reproductive and steer performance at MS seemed equally sensitive to utilisation rate (cf. Ash and Stafford Smith, Reference Ash and Stafford Smith1996).
Both trials highlighted the practical difficulties of varying stock numbers to achieve set utilisation targets; for example, to achieve an annual pasture utilisation rate of about 20% in one PGH treatment, stocking rates had to be varied from 10 to 20 AEs/100 ha. This would be almost impossible to achieve in commercial practice, especially with breeders. Recommended pasture utilisation rates should thus be used as a long-term target average rather than attempting to achieve a specific rate each year by sharply varying livestock numbers (Cowley and McCosker, Reference Cowley and McCosker2011).
In summary, the Wambiana, PGH and MS trials build on and extend previous work at smaller scales by addressing another level of scale and complexity. Nevertheless, all three have limitations relating either to duration, the class of animal used, lack of replication and/or the sequence or type of rainfall years encountered. Moreover, all are site specific. Simulation modelling to compare these strategies over different rainfall years and environments complements these trials and is discussed below.
Simulation modelling of different grazing strategies
Earlier simulation work in northern Australia used linked herd-economic models to compare the long-term profitability of different stocking strategies on case study properties (Foran and Stafford Smith, Reference Foran and Stafford Smith1991; Buxton and Stafford Smith, Reference Buxton and Stafford Smith1996). Later studies used the GRASP model to simulate management impacts on range condition and capture feedbacks on animal production and profitability (e.g. Ash et al., Reference Ash, O'Reagain, McKeon and Stafford Smith2000 and Reference Ash, MacLeod, Smith, McDonald and McIntosh2002; McKeon et al., Reference McKeon, Ash, Hall and Strafford-Smith2000).
However, these modelling studies had limitations. First, the simulated management–land condition relationship was simple and the feedback effects of declining condition on productivity and profitability were probably underestimated. Second, simulations invariably involved non-breeding animals or associated data, making extrapolation to breeders difficult. Drought feeding costs were also often not captured, underestimating the true economic costs of less sustainable strategies like heavy stocking.
Significant progress has recently been made in attempting to address these shortcomings: Scanlan et al. (Reference Scanlan, Pahl, Whish, Macleod, Cowley and Phelps2011a and Reference Scanlan, MacLeod, Pahl, Whish, Cowley and McIvor2011b) modified GRASP to better capture the effects of management on land condition and its resultant feedbacks on animal production, and hence simulated the performance of grazing strategies with greater realism. The key modification was to account for the fact that northern Australian pastures are most sensitive to grazing during the early growing season (Mott, Reference Mott1987). In the original GRASP model (McKeon et al., Reference McKeon, Ash, Hall and Strafford-Smith2000), change in pasture condition was driven by the utilisation of growth calculated over the whole growing season. However, in the present modification, grazing during the early-mid growing season was weighted to have a greater impact than late-growing season grazing. Accordingly, high stocking rates early in the season combined with poor growing conditions lead to a decline in condition, even if followed by above-average growing conditions. In practice, such situations easily arise when drought abruptly follows good years and stocking rates are not reduced appropriately.
Scanlan et al. (Reference Scanlan, Pahl, Whish, Macleod, Cowley and Phelps2011a) also included a wider range and combination of annual stocking rate changes in GRASP. Previously, stocking rates in VAR simulations were set in direct proportion to end-of-growing season pasture TSDM (McKeon et al., Reference McKeon, Ash, Hall and Strafford-Smith2000), leading to unrealistically large fluctuations in stock numbers between some years. To reflect normal management constraints, limits were thus set on the magnitude of annual stocking rate changes, depending on the current stocking rate relative to LTCC and on whether stocking rates were being increased or decreased.
Simulation modelling was done to investigate the economic performance of representative grazing properties in each of nine regions across northern Australia. Output from the GRASP model was analysed using Enterprise, a herd-based economic model (MacLeod and Ash, Reference MacLeod and Ash2001). Importantly, the model also included the costs of any drought feeding.
Methods
In each region, a ‘typical’ property was developed in conjunction with technical experts and graziers with each modelled property running a breeder herd, followers and fattening stock grazing up to 20 paddocks. Simulated properties contained a representative mix of the relevant land types for the region, but each paddock contained only one land type. Simulations for the 25-year period from 1980 to 2005 were run for the representative properties in each of the nine regions (Scanlan et al., Reference Scanlan, Pahl, Whish, Macleod, Cowley and Phelps2011a and Reference Scanlan, MacLeod, Pahl, Whish, Cowley and McIvor2011b), except for the Kimberley region of Western Australia where the simulation was from 1993 to 2010.
Results
Moderate v. heavy stocking
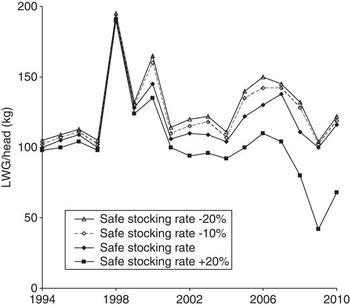
As an example, a range of fixed stocking rates was simulated for a representative property in the Kimberley region of Western Australia with land initially in good condition. The strategies considered were fixed stocking at LTCC and three other stocking rates (Figure 2). Although LWG/head was initially similar (till around 1999) in all strategies, the lowest stocking rate gave the highest LWG/head. After 1999, pasture condition in the heaviest stocking rate declined resulting in reduced LWG/head.
The simulated change in annual live weight gain per head over 17 years under four different levels of fixed stocking in the Kimberley region of Western Australia.

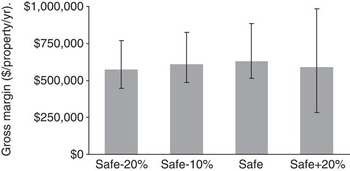
Overall, stocking at LTCC was the most profitable (Figure 3), although the slightly lower stocking rate also performed well. Note that, although the elevated and reduced stocking rate strategies were of similar profitability, annual variability in profit was much greater in the higher stocking rate. The profitability of the heaviest stocking rate would also be expected to decrease as land condition deteriorated further.
Simulated average annual gross margin for a beef cattle property in the Kimberleys, Western Australia, run with fixed stocking at four stocking rates over 25 years of rainfall data. Vertical bars show the full range of values encountered during the 25-year simulation period.

These property-level results largely agree with those from the Wambiana trial: in both instances, the high fixed stocking rate was the least profitable and the most risky strategy. Although the profitability of the HSR strategy in the trial recovered in later wet years, this recovery is unlikely to last with a return to average or below average rainfall (O'Reagain et al., Reference O'Reagain, Bushell and Holmes2011). In addition, the HSR rate in the trial received drought feeding in 4 of the 13 years and was destocked at one stage. The property-level modelling only included drought feeding, and inclusion of the costs of destocking (e.g. via agistment) would undoubtedly swing modelled results even further against heavy stocking.
A key conclusion from these analyses is that maximum profit was achieved with the fixed stocking rate that maintained pastures in good condition (i.e. LTCC). For shorter periods than the ones used here, maximum profit may be achieved with slightly higher stocking rates as the negative impacts of higher stocking rates on pasture condition and productivity did not outweigh the increase in LWG/ha at the higher stocking rate. For pastures in poor condition, a stocking rate that is lower than the LTCC for pastures in that condition (i.e. the fixed stocking rate that would maintain the pasture in that condition and not cause further deterioration) will lead to an improvement in condition, and subsequently an improvement in the stocking rate that the pasture can sustainably carry.
In contrast, simulation of different stocking rates in Texas in the United States indicated that both short- and long-term profitability were maximised at higher stocking rates than those that would maintain or improve range condition (Teague et al., Reference Teague, Kreuter, Grant, Diaz-Solis and Kothmann2009). However, the assumptions of the latter model were noticeably different; aside from lacking the costs of drought feeding, non-pregnant cows were replaced annually by purchased animals. In the Australian situation, these assumptions would tend to minimise the impacts of heavier stocking rates on long-term reproductive and economic performance.
Flexible v. fixed stocking
A range of annual changes in stocking rate in response to changes in forage availability was simulated in each of the nine regions. Options ranged from fixed stocking (no flexibility) to a flexibility of 20% annual change (both increases and decreases) in stock numbers to high flexibility (40% annual change allowed). A 20% annual change roughly aligns with the levels of annual stocking rate change currently practised in many regions (Scanlan and McIvor, Reference Scanlan and McIvor2010). A ‘fully responsive’ strategy was also used with stock numbers set annually to consume a fixed proportion of pasture TSDM and no limits placed on the magnitude of stocking rate change.
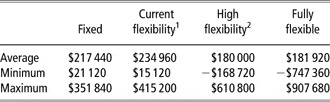
In general, an annual stocking rate flexibility of 20% was more profitable than fixed stocking at LTCC. An example is shown for a representative case study property near Charters Towers, north-east Queensland (Table 2), but similar results were obtained in other locations. With the high and fully responsive strategies, there were a large number of years in which the gross margin was negative; in the example presented, 40% of years had a negative income using these strategies.
Average, minimum and maximum annual gross margin for four stocking rate strategies, ranging from no flexibility (fixed) to fully flexible for a 24 000 ha property carrying about 2000 breeders in north-eastern Queensland over a 25-year simulation period

1Annual changes up to ±20%, with maximum changes of ±40% from the initial stocking rate during simulation period.
2Annual changes up to ±40%, with maximum changes of ±80% from the initial stocking rate during simulation period.
Flexible stocking rates were considered appropriate for all regions with an allowed annual stocking rate flexibility of 20%, generally improving gross margins compared with fixed stocking at or near LTCC. The economic performance of the highly and fully flexible systems was generally poorer than moderate flexibility systems. This resulted from poorer pasture conditions brought about by high stocking rates being carried through a dry year that followed a high rainfall year. In addition to poorer economic performance, the greater stocking rate flexibility associated with the high flexibility and fully responsive systems greatly increased annual gross margin variability.
A related issue under investigation relates to the improvement of pastures in poor condition. Preliminary investigations suggest that the use of modest annual levels of flexibility around the LTCC for pastures in poor condition would allow pasture condition to improve, whereas a fixed stocking rate at the LTCC would result in no improvement in condition.
In agreement with Ash et al. (Reference Ash, O'Reagain, McKeon and Stafford Smith2000), the analyses suggest that the greater the between-year variability in rainfall the greater the optimum level of flexibility for profitability and resource condition. More detailed analyses are underway with some preliminary work indicating that an annual decrease of up to 40% and an annual increase limit of 10% gives good pasture condition and LWG/ha (Pahl et al., Reference Pahl, Whish, MacLeod, Scanlan and Cowley2011).
Limitations of the modelling approach
However sophisticated, simulation models need to be grounded in empirical data and tested against field observations. The spatial complexity of some grazed landscapes and the temporal variation in management practices, against a backdrop of a variable climate, pose serious challenges to the capacity of models to represent ‘real world’ properties. A specific issue is the multiple land types present in most commercial paddocks. Although GRASP can estimate total forage production for a paddock composed of multiple land types, it cannot estimate a realistic LWG/head in such circumstances. Further, animal numbers are adjusted only once per year as an ongoing strategy in the model (although tactical changes can be made on any particular day in any particular year). In reality, selling decisions (and hence stocking rate changes) will often be influenced by external factors (e.g. availability and price), which cannot be presently accommodated in the model.
Different climatic sequences may also influence performance of different management strategies. For example, a series of years with poor growing conditions may lead to a large drop in stocking rate when using a flexible strategy. When good conditions return, a low rate of annual increase in stock numbers rate may result in several years when stocking rates are much lower than could be safely carried, thereby foregoing potential animal production. Thus, a strategy that is optimal when considered over many different climate sequences may not perform as well as another strategy under a particular climate sequence.
The effectiveness of models to directly facilitate adoption and practice change amongst managers is also limited. Research and demonstration are key elements in adoption (Nicholson et al., Reference Nicholson, Barr, Kentish, Dowling, McCormick, Palmer, Simpson, Simpson and Walsh2003), and this approach underlies much of the grazing research and modelling in northern Australia.
Discussion and conclusions
From the simulation modelling and the empirical evidence described above, the following conclusions can be derived:
High stocking rates or high levels of pasture utilisation lead to degradation and are unprofitable and unsustainable in the longer term. The speed at which this degradation occurs will, however, depend on rainfall and the actual stocking rates used in relation to the productivity of the land type, that is, LTCC. Modelling over a 25-year period (approximately one management generation) showed that the relative value of fixed stocking at LTCC compared with highly flexible stocking depended on the sequence of rainfall years, that is, neither strategy was consistently superior with the outcomes depending on the circumstances.
Both variable and constant stocking at LTCC can lead to degradation and economic loss if incorrectly applied: constant stocking at LTCC can lead to overgrazing if stocking rates are not cut in very dry seasons, while area-selective grazing can also cause degradation.
Some stocking rate flexibility, as well as a system to protect or maintain selected areas are thus required. Some form of wet season spelling is therefore necessary to maintain or improve pasture condition (e.g. Ash et al., Reference Ash, McIvor, Corfield and Ksiksi2011). However, good management is required if potential problems with overstocking of other paddocks is to be avoided (Scanlan et al., Reference Scanlan, MacLeod, Whish, Cowley and Pahl2011c). Lastly, accurate estimates of LTCC are also essential, as relatively small overestimates of LTCC can, in theory, lead to long-term degradation in the absence of ongoing land condition monitoring.
Variable stocking can also lead to degradation, particularly where good seasons with high stocking rates are followed by droughts and numbers are not rapidly adjusted. When this occurs, recovery can be extremely slow and can take years. As with fixed stocking, area-selective grazing can also occur.
Variable stocking can have significant benefits but only when undertaken within certain constraints. First, even in the best years, stocking rates should not be allowed to exceed a pre-determined level of between 20% and 40% above LTCC. Second, stocking rate increases between years should be relatively modest at around 10% to 20% per year to ensure that stocking rates do not rise too rapidly and cause overgrazing if rainfall declines. Third, stocking rates should be cut relatively rapidly when required: reductions of up to 40% in herd size appear to be a good compromise between preventing deterioration and ensuring that sufficient core breeders are retained to enable recovery in numbers when better seasons return.
The primary stocking rate adjustment point should be based on forage availability at the end of the wet season. Other secondary adjustment points may be at the end of the dry season and in the early-to-mid wet season, and may include the use of SCF if appropriate.
Although the above strategy of having annual increases capped at 10% to 20% and allowing up to 40% decreases appears bio-economically sound, circumstances in any particular year or on a particular property may warrant departure from these ‘rules’. For example, greater increases in stocking rate may be considered if the property was stocked far below LTCC.
In summary, the best management strategy to manage for variable rainfall under northern Australian conditions is probably stocking at or around the LTCC, allowing for modest stocking rate increases in good years and high cuts in poor years. Some form of wet season spelling should also be included. Implementation of this strategy and tactical management should be based on continual assessment of pasture and animal needs in an adaptive management framework.
In the future, climate change may necessitate changes to these recommendations, and therefore active adaptive management is required to manage these changes (McKeon et al., Reference McKeon, Stone, Syktus, Carter, Flood, Ahrens, Bruget, Chilcott, Cobon, Cowley, Crimp, Fraser, Howden, Johnston, Ryan, Stokes and Day2009). Modelling can explore future climate scenarios and evaluate new adaptive stocking strategies to mitigate and take advantage of these likely impacts.
Acknowledgements
The authors acknowledge Drs Mick Quirk, Rodd Dyer and Wayne Hall for their guidance throughout this continuing work and Meat and Livestock Australia for co-funding the Wambiana trial and the Northern Grazing System project. Additional funds for the latter project were received through DAFF's Caring for Our Country programme. The Lyons family of ‘Wambiana’ and the Wambiana Grazier Advisory Committee are thanked for their interest and support in running the Wambiana trial. Dr Greg McKeon has provided insights and encouragement during this work. The support and advice of our DEEDI and CSIRO colleagues, particularly John Bushell, Giselle Whish, Lester Pahl, Angela Reid and Neil MacLeod, are also acknowledged. This paper acknowledges the financial assistance provided by the Australian Rangeland Society through their Travel Grant initiative. For more information about the Australian Rangeland Society refer to www.austrangesoc.com.au.