Introduction
Clay minerals are abundant and reactive components of the Earth’s permeable surface that is influenced by meteoric waters (i.e. the Critical Zone), and can impact many aspects of ecosystems including soil fertility, groundwater quality, and the fate and transport of contaminants (Schroeder Reference Schroeder2018). More specifically, 2:1 and 1:1 hydrous layered phyllosilicates (clay minerals) have multiple structure sites in which to host (i.e. uptake/release) nutrients under different biogeochemical conditions, particularly those occurring along gradients developed by oscillations in moisture, redox potential, pH, and ion/complex activity (Hochella et al. Reference Hochella, Mogk, Ranville, Allen, Luther, Marr, McGrail, Murayama, Qafoku, Rosso, Sahai, Schroeder, Vikesland, Westerhoff and Yang2019). The availability of K+ in a soil affects the composition of the suite of clay minerals present, with excess K+ resulting in increased abundance of 10 Å phases and paucity of K+ resulting in increased abundance of 17 Å phases (Officer et al. Reference Officer, Tillman, Palmer and Whitton2006; Barre et al. Reference Barre, Velde, Catel and Abbadie2007b, Reference Barre, Montagnier, Chenu, Abbadie and Velde2008; Cornu et al. Reference Cornu, Montagne, Hubert, Barre and Caner2012). This adaptability of clay minerals in soil, to act as a source or sink for excess K+ under changing conditions, enhances the resilience of the soil to changing conditions.
One example of changing conditions is represented by the history of agriculture in the southeastern United States (SE US). In the late 18th century, portions of the Piedmont forest were cut and cultivated for agriculture (e.g. cotton), which, when combined with the region’s temperate to subtropical climate, resulted in deep erosion and movement of top soils to the rivers (Trimble Reference Trimble2008). With the abandonment of SE US lands because of fertility loss, the landscape has since been replanted extensively in forest (often pine) with the perception by most that the ecosystem has recovered through the process of succession. This legacy of land-use change has resulted in decreased root density in plots with a history of agriculture, with no roots present below 70 cm in currently cultivated plots (Billings et al. Reference Billings, Hirmas, Sullivan, Lehmeier, Bagchi, Min, Brecheisen, Hauser, Stair, Flournoy and Richter2018). Suspected changes resulting from forest to row cropping might also include increased leaching rate of the soil, as the inputs from the surface would be removed (Balogh-Brunstad et al. Reference Balogh-Brunstad, Keller, Bormann, O'Brien, Wang and Hawley2008). The combination of these effects, root removal and increased leaching, suggests that X-ray powder diffraction (XRD) patterns from the clay-fraction of cultivated-plot soils should show reduced abundance of 10 Å phases. Conversely, XRD patterns for the clay fraction of soils from plots which were forested continuously or replanted should show an increase in 10 Å phases. However, in these Piedmont soils, near-surface weathering for at least 2.5 MY (Bacon et al. Reference Bacon, Richter, Bierman and Hood2012) has left a high abundance of 1:1 layer clays which have no layer charge.
A common, and as yet poorly understood, aspect of clay mineral structure is the dynamics of mixed-layering in the clay minerals formed in weathered regolith and the role that it may play in the cycling of nutrients, particularly in landscapes that have been impacted by humans. The occurrence of mixed-layer minerals is especially important in kaolinite-dominated soils, where the minor to trace abundances of 10, 14, and 17 Å phases play a pivotal role in the availability of nutrients for sustainable plant growth (Barre et al. Reference Barre, Montagnier, Chenu, Abbadie and Velde2008). The existence of mixed-layer minerals, and the complexity of their composition and formation pathways, especially in soil, has long been a topic of research. Generally, the most effective method for characterization involves the use of multiple cation-saturated specimens and computer modeling of XRD patterns from oriented mounts (Lanson et al. Reference Lanson, Sakharov, Claret and Drits2009; Dumon & Van Ranst Reference Dumon and Van Ranst2016).
The purpose of the current study was to examine the structural state of mixed-layer clays in a comparative array of regoliths developed on different landscapes and land-management scenarios in the SE US Piedmont as a proof of concept for using NEWMOD2 to obtain meaningful and accurate quantification of mixed-layer clays. The approach was to use XRD to examine types of clay-mineral structures and abundances that have been treated in the laboratory under varied cation-saturation and hydration states. This method allows for the detection of mixed-layer clay structures by observation of differences in X-ray scattering properties. Accurate quantification of mixed-layer types can aid in the exploration of possible 2:1 layer exchange sites, which can serve as refugia for cationic forms of potassium and nitrogen (known essential nutrients for plant productivity). Integration of these datasets with others collected on the same samples will also allow for the exploration of the conditions under which mixed-layer clays form, and how they interact with the soil biota and pore water. The uplift of other ions (Mg, Ca, and P) and the nature of their vertical distributions are suggested to have important biogeochemical consequences (Jobbagy & Jackson Reference Jobbagy and Jackson2004).
Materials and Methods
Samples were collected from the Calhoun Critical Zone Observatory (CCZO) located in Union County, South Carolina, USA, as part of a multidisciplinary effort (supplementary Fig. S1). Related data sets for the CCZO are available and include listings for seasonal air and soil temperatures, climatic properties, LIDAR maps, groundwater and ground gas fluxes, photographs, soil properties, vegetative covers, and streamflow fluxes (criticalzone.org/calhoun/data/datasets/). In summary, the region’s annual precipitation averages 127 cm and the mean annual temperature is 15.7°C. The soils are composed of Cataula series (fine, kaolinitic, thermic oxyaquic Kanhapludults). Sites included in this study are pits located in experimental research watersheds that were excavated in 2016 using a backhoe to expose profiles down to ~3 m, which were sampled intensively. Deeper samples were extracted from the pits by hand auger to depths of ~8 m (Table 1). Cultivated plots in research watershed 1 (R1C) have been cultivated continuously with cover crops and occasionally amended with dolostone since 1930. Two pits excavated in R1C were considered in this study, with sites R1C2 and R1C3 located higher and lower, respectively, on the landscape. Research watershed 7 includes two pairs of forested plots (~15 m diameter) where all the trees have been identified, measured, and cored for age determinations. The forested plots were chosen with a hardwood plot that has been forested continuously, and a pine plot that was previously cultivated in each pair. Pits were dug in both sets of plots with the pit in pine plot #2 being the focus of this study (R7P2). Continuous sampling was conducted and bulk chemical and mineralogic analyses were performed for the profiles for all these sites, as well as four pits from two other watersheds; however, only a subset of shallow (<1 m) and deep (>6 m) samples was used from R1 and R7 as the focus for this current study (Table 1).
Locations and properties of samples collected at the Calhoun CZO

More detailed site descriptions and data for the above and related samples are available at criticalzone.org/calhoun/data/datasets/
Samples were sieved to remove the >63 μm fraction and dispersed using a Branson Sonifier Cell Disruptor 350 (Branson Sonic Power Company, Danbury, Connecticut, USA) in a solution of 38 g of Na-hexametaphosphate (Alfa Aeser, Ward Hill, Massachusetts, USA) and 8 g of Na-carbonate (Baker Chemical Co., Phillipsburg, New Jersey, USA) per liter of deionized water. The clay fraction was separated to the <2 μm (equivalent spherical diameter) from the <63 μm fraction using centrifugation (Schroeder Reference Schroeder2018). All samples were considered to be Na-saturated after this treatment. Approximately 1 g each of K-saturated and Mg-saturated sample was prepared by exchanging with 1.0 M and 0.1 M KCl (Fisher Chemical, Fairlawn, New Jersey, USA) and MgCl2 (Acros, Morris Plains, New Jersey, USA) solutions, respectively. Exchanges were repeated by centrifugation and solution renewal to ensure full saturation. After rinsing of excess salt with deionized water, clay slurries were sedimented and air dried on 11 cm2 glass petrographic slides to ensure infinite thickness (0.1 g/cm2). Each slide was scanned over the range 2–32°2θ (0.01°2θ step and 0.1 s per step) using a Bruker D8 advance diffractometer (Bruker, Karlsruhe, Germany) with CoKα radiation (35 kV, 40 mA), goniometer radius of 21.7 cm, primary sollar slits, 0.6 mm scatter slit, Fe-CoKβ filter, 2.5° receiving slit, and a Lynx-Eye position sensitive detector. Data were collected for each sample in the states of air-dried (AD), ethylene glycol-saturated (EG) (24 h at 20°C), and heated overnight at 110, 350, and 550°C. This multi-specimen method was similar to that used effectively by Lanson et al. (Reference Lanson, Sakharov, Claret and Drits2009) on illite-smectites. Only the K- and Mg-saturated scans in the EG and 110°C state were considered for the comparison with calculated patterns, because the AD samples expressed multiple 0-water, 1-water, and 2-water hydration states (see discussion below).
Samples contained gibbsite (4.84 Å) and/or goethite (4.15 Å), which in each case allowed for correction of minor sample displacement errors (<±0.05 mm). Experimental data were Kα2 stripped using Bruker Eva ® software (Version 4.2.0.14) and exported in .xy format. A linear background was subtracted from each data set using the minimum count per second value and then imported as the experimental data into NEWMOD2 ® software. NEWMOD2 was used to model the mixed-layer oriented XRD patterns (Reynolds Reference Reynolds, Brindley and Brown1980, Reference Reynolds1985; Yuan & Bish Reference Yuan and Bish2010). Tables S1a–f contain all NEWMOD2 model parameters used in the fitting for all XRD patterns.
A forward modeling approach was used, whereby parameters and abundances were adjusted to minimize the differences between experimental and model patterns. Parameters adjusted included: the d spacing of layer types, mean defect broadening distance, large number (N) of coherent scattering domain (low N = 3), ordering scheme (Reichweite), the percentage of layer types, and type abundance of exchangeable or fixed interlayer cation in 2:1 structures, dioctahedral or trioctahedral layer type, and abundance of octahedral iron in 2:1 structures. As discussed by Austin et al. (Reference Austin, Perry, Richter and Schroeder2018), using a dioctahedral structure is well suited to simulate the diffraction characteristics of structural octahedral Fe in biotite that has undergone oxidation from the ferrous to ferric state. The oxidation of Fe reduces symmetry of the trioctahedral structure and makes the octahedral site more dioctahedral-like in terms of XRD phenomena, (i.e. shortening of the b lattice parameter), which has been supported independently by far-infrared studies (Diaz et al. Reference Diaz, Robert, Schroeder and Prost2010). The layer charge must compensate for this loss by expelling positive interlayer cations (i.e. potassium). If the unit layer charge decreases from 1.0 to 0.75 then the structure becomes ‘illite-like.’ Hence, for the purpose of this study and modeling, the term ‘illite’ was used, following the convention of Barre et al. (Reference Barre, Velde and Abbadie2007a). This is not meant to be the same as authigenic illite formed during burial diagenesis or degraded muscovite (Schroeder Reference Schroeder1992).
The authors recognize that NEWMOD2 accommodates only two-layer types in model calculations and that, in nature, three-layer type mixed-layer clays or combinations of the same layer types in different hydration states may be present (Dumon & Van Ranst Reference Dumon and Van Ranst2016). Improvements to the current approach could be made by modeling of 0-water, 1-water, and 2-water layer types in 2:1 clay structures, particularly for XRD patterns in the AD state. The results, however, indicated that reasonably good simulations were possible in spite of this limitation and the sample treatment differences were robust enough to justify using the two-layer model. Using the fewest variables in a model is beneficial for the eventual application of clay mineral quantification in predictive capacities, such as work by Hillier & Butler (Reference Hillier and Butler2018) who predicted the extractable potassium properties of soils from XRD data. Given the reasonable goodness of fit results and the small visual difference seen between both experimental and model data, the two-layer model approach (i.e. NEWMOD2) was used.
Fits were assessed using Goodness of Fit (G), which was calculated using the method described by Toby (Reference Toby2006) using the equations:


where y represents intensity values, w represents the weight (w = 1/σ2[y o,i], σ2[y o,i] = y o,i), the subscript c indicates calculated counts, and the subscript o indicates measured counts of i°2θ (Austin et al. Reference Austin, Perry, Richter and Schroeder2018).
The shorthand syntax suggested by Schroeder (Reference Schroeder2018) was employed where the binary mixed-layer system is labeled ABXXRY, where A = smaller d-spacing layer type; B = larger d-spacing layer type; XX = percentage of layer A, and RY = Reichweite ordering scheme when Y = 0 R is random ordering, and Y = 1; R is nearest neighboring layer only dependence. For example, KS70R0 indicates kaolinite-smectite occurring with 70% kaolinite layer types, 30% smectite layer types, and random ordering. If a layer type is repeated, then the structure is considered a single structure (e.g. KK = pure kaolinite). In some cases, modeling the same sample exposed to different saturation and solvation states resulted in solutions where the layer types were the same, but the abundance of layer A vs B varied slightly. In these cases, the percentage of layer A (XX) was reported as a range of values. In other cases, the same sample exposed to different cation saturation and solvation states resulted in solutions where layer types and abundances changed. For NEWMOD2 modeling purposes, the small and large number of coherent scattering domains and the mean defect-free difference were varied in all cases (pure and mixed-layer phases) to minimize the difference between i c and i o.
To ensure accurate phase identification and quantification, XRD patterns of each sample under four different saturation and solvation states were modeled using NEWMOD2. During the modeling process, some theoretical considerations were required to ensure good fits that also made physical and chemical sense. Differences in the observed and modeled intensities at low angles (2–7°2θ; ~51–14 Å) could be only partially explained by the theoretical parameters accommodated in the NEWMOD2 model. The model mismatch for intensities at low angles sometimes resulted in modeled intensity being greater than the observed intensity. This was the case for all K-sat/EG-solvated samples and all Mg-sat/EG-solvated samples, except R12C3_600-650. In that case, a peak was observed at ~4°2θ (~25 Å) which was interpreted as illite-smectite. Three samples had observed intensities greater than modeled intensities (R1C2_13-80, Mg-sat/110°C & K-sat/110°C, and R1C3_600-650 K-sat/110°C).
This low-angle intensity of the XRD pattern is influenced in part by the Lp factor. Lp is calculated by

where ψ is the powder ring distribution factor (Reynolds Reference Reynolds1986). Briefly, this factor can have either a single crystal or random powder form. If the random powder form is used, the preferred orientation of the sample has a large effect on the resulting low-angle intensity. ψ is calculated using the standard deviation of the assumed Gaussian distribution of tilt angles of the random powder (σ*) and the size of the primary and secondary sollar slits (Reynolds Reference Reynolds1986). Variations in σ* cause the intensity at low angles to change, with higher larger σ* values (representing more random orientation) resulting in higher intensity.
NEWMOD2 allowed for parameter variations in the Lp function, which included σ* and both primary and secondary Soller slit sizes.. The Soller slit settings were kept constant throughout (6.6° primary and 2.5° receiving) for all calculations. To evaluate the differences in the observed intensities across treatments, the average intensities for all treatments of all samples from each complete profile (n = 34 for each treatment) were compared (Fig. 1). In both cation saturation cases, the EG-solvated samples had lower intensities in the low-angle region, thus indicating higher values for σ* and implying that these samples were more randomly oriented than the heated samples. As the samples were heated and the interlayer water and ethylene glycol were removed, the clay particles were assumed to behave in a manner that indicates more uniform orientation.
Average XRD intensity (source = CoKα) of all samples grouped by treatment (n = 34 for each treatment). Color-coded regions represent one standard deviation with blended shades showing overlaps. Heated samples exhibited greater low-angle scattering compared to their EG-saturated states. K-saturated samples exhibited greater low-angle scattering compared to the Mg-saturated states. This response can be attributed partly to sample-sensitive changes related to orientation and scattering behavior (Reynolds Reference Reynolds1986). The increased low-angle scatter is consistent with a more powder-like Lorentz polarization (Lp) of the beam, whereas the decreased low-angle scatter, is consistent with a more single crystal-like Lp of the beam. Differences in low-angle scattering can also be attributed to mixed-layering, where the occurrence of quasi-super structures add intensity to the low-angle region

Reynolds (Reference Reynolds1986) determined that σ* = 12 is a good estimation for oriented clay slides prepared as described above. In an attempt to resolve the differences between modeled and observed intensities, σ* was adjusted during modeling. The calculation of G (Eq. 3) revealed negligible differences in quantitation as σ* was varied. Therefore, a value of 12 for σ* was used for consistency in the model fit for the range of 2–7°2θ (~51–14 Å) for samples in the Mg-sat/EG state (Table S1a–f).
In addition to differences observed in sample treatments, low-angle scattering was most pronounced in samples that included ordered mixed-layers and disordered smectitic mixed-layer minerals. This was attributed to mixed-layering, where the occurrence of quasi-super structures add intensity to the low-angle region. The lack of well defined higher order reflections that are expected in >R1 ordering make distinguishing between the effects of Lp and super structure low-angle scattering difficult. Although beyond the scope of this study, this may be resolved through a systematic study of particle orientations using rocking curve experiments (Reynolds Reference Reynolds1986).
The largest innovation to modeling mixed-layer clays presented in this paper is the use of NEWMOD2 for a systematic and quantitative comparison of mineral weight abundances (wt.%) across treatments. The method chosen for quantification required pre-assessment of various cation treatments and hydration states. This ensured that the suite of minerals purported to exist had a sound physical basis across all sample treatment patterns. The mixed-layer minerals and quantity of layer types were compared across the sample treatments using the following criteria to identify and assess discrepancies:
(1) The total number of kaolinite layers could not change with solvation, saturation, or heating.
(2) Expanding layer types could be collapsed by heating and K saturation, causing an apparent increase in illite-like layers.
(3) Changes in the d spacing of expandable layers could result in an apparent increase in kaolinite mixed-layers as long as no increase occurred in the abundance of kaolinite layers.
(4) Treatments were not expected to completely transform all 2:1 clay layers in a sample, e.g. some low-charge smectite layers may not completely collapse to 10 Å upon K saturation, resulting in an apparent increase in vermiculite layers.
(5) G values were minimized in compliance with the preceding rules.
In order to maintain compliance with the criterion (1), methods for the abundance calculations were limited to those model solutions that best balanced each layer type for all treatment/hydration conditions. This resulted in a dynamic tabulation of layer-type abundances (Fig. 2) using the NEWMOD2 solutions for each state. The numbered arrows are intended to give a sense of the quantity of layers that were transformed during the heating treatment. In some cases, the transformation showed more kaolinite layers than expected. For example, the K-sat/110°C treatment of R7P2_700-800 had fewer than expected kaolinite layers compared to the K-sat/EG treatment of R7P2_700-800. The XRD patterns for R7P2_700-800 K-sat treatments showed, upon heating, no increase in intensity or asymmetry on the low-angle side of the peak at 14°2θ (~7 Å), and a decrease in a broad area of higher intensity between 5 and 10°2θ (15–10 Å) centered around 7°2θ (~14 Å) (Fig. S7). This is interpreted as a collapse of expandable, mixed-layer kaolinite-vermiculite (~7 Å/~14 Å) to kaolinite-illite (~7 Å/~10 Å). This interpretation is consistent with the interpretation of the other treatments, though the best-fit model (both visually and with the lowest G) results in more kaolinite layers than expected. A similar response was observed in the R1C2_700-800 K-sat patterns, with a slight decrease in intensity on the low-angle side of the broad peak at 10°2θ (~10 Å) accompanied by an increase in both peak-width and intensity, on the low-angle side of the 14°2θ (~7 Å) peak (Fig. S3). Difficulties occurred in resolving NEWMOD2 model solutions that consistently provided mass balance to layer transformations for the K-sat samples.
Quantitative representation of changes in modeled layer-type abundances based on changes in XRD patterns from different sample treatments (Table 2). Arrows depict the changes in layer types and abundances resulting from heat treatments. Values on the arrows quantitatively constrain the number of layer types transformed after heat treatment. Color codes show similar mixed-layer groups: kaolinite and kaolinite-smectite dominated (cool violet/blues), kaolinite-illite-like dominated (warm brown to yellows), and vermiculite dominated (greens). The shallow samples (left side) exhibited low abundances of expandable 2:1 layers in all profiles, resulting in relatively small but perceptible changes with treatments. Deep samples (right side) had more abundant/dynamic 2:1 illitic and expandable layers

In contrast, the Mg-sat/EG treatment for all samples was considered to be more consistent than all the K-sat sample treatments for mass balancing the layer types upon heating (Fig. 2). Differences in mixed-layer types manifested in K-sat states vs Mg-sat states were related to heterogeneous layer charges within the 2:1 layers and resultant layer heterogeneous dimensions (Lagaly Reference Lagaly1982; Gier et al. Reference Gier, Ottner and Johns1998). As noted by MacEwan & Wilson (Reference MacEwan and Wilson1980), structural contractions of K-sat states in 2:1 layers are variable in response to the amount of layer charge. The state of an octahedrally coordinated two-layer Mg-hydrate group [Mg(H2O6]2+ occupies a more uniform and consistent d spacing than K-sat states. Therefore, Mg-sat/EG was used for quantification.
Results
The diffraction patterns of the K- and Mg-saturated samples in both the EG and 110°C states, respectively, showed small differences at high angles (>20°2θ; <4.44 Å) (Fig. 3, S2–S7). All patterns for the same sample in the various states showed larger differences at low angles than at higher angles. The differences between the patterns for the same sample under different saturation and hydration states was most conservatively explained by two factors. Firstly, sample-sensitive modifications (i.e. Lorentz-polarization (Lp)) are associated with changes in orientation (Reynolds Reference Reynolds1986) upon treatment. Secondly, specimen-sensitive modifications are associated with the presence of mixed-layering caused by changes in: (1) types of layers, (2) proportions of layer types, (3) the dimensions of layer types, and (4) interlayer composition.
XRD patterns for all treatments of all samples superimposed at the same relative intensities. The gray line represents the difference between the measured intensities (counts per second) of the Mg-sat/EG-solvated sample and the average of differences for the other treatments (i.e. Mg-sat. (EG) - [(Mg-sat. (EG) - Mg-sat. (110°C) + (Mg-sat. (EG) - K-sat. (EG) + (Mg-sat. (EG) - K-sat. (110°C)]/3). Positive deflections indicate that the influence of quasi-superstructures dominates scattering and the effect of orientation (Lp) is diminished. Negative deflections indicate the absence of quasi-superstructures and the dominance of the orientation effect (Lp)

Forward models using NEWMOD2 conformed well with experimental patterns (Figs. 4 and 5). These results conform with the constraint that the same sample treated under different cation saturation states (i.e. K+ vs Mg2+) and hydration states (i.e. EG vs 110°C) must be quantitatively balanced. The expected response for low charge 2:1 exchange sites (where unit layer charge = X, i.e. 0.3 < X < 0.45) is that EG-saturated d spacings for K+ and Mg2+ states expand to ~17.05 Å and ~16.85 Å, respectively. Upon heating to 110°C these layers collapse to ~10 Å. If the layer charges are higher (i.e. 0.45 < X < 0.75), then K-saturated layers may expand to ~17 Å, which may be related to the relatively small enthalpy of hydration for K+ (–320 kJ mol–1), whereas Mg-saturated layers expand to ~14 Å due to larger enthalpy of hydration for Mg2+ (–1921 kJ mol–1). Enthalpy of hydration values were reported by Smith (Reference Smith1977) who defined them as energy released by an ion in a large amount of water at 298 K and 1 atm. Layers that expand to ~14 Å were modeled as vermiculite and layers that expand to ~17 Å were modeled as dioctahedral smectite. Well ordered 10 Å layers were modeled as discrete trioctahedral biotite (X = 1.0).
Changes in low-angle regions of XRD patterns for R7P2_700-800 indicate the presence of mixed-layer minerals. (a) Schematic diagram of changes in the mixed-layer structure upon heating the Mg-sat. (EG) slide to 110°C. (b) NEWMOD solutions showing individual phases and the complete modeled pattern (red) compared to the observed pattern (gray) in EG state (upper) and 110°C state (lower)

Changes in low-angle regions of XRD patterns for R7P2_700-800 indicate the presence of mixed-layer minerals. (a) Schematic diagram of changes in the mixed-layer structure upon heating the K-sat. (EG) slide to 110°C. (b) NEWMOD solutions showing individual phases and the complete modeled pattern (red) compared to the observed pattern (gray) in EG state (upper) and 110°C state (lower)

Based on numerous forward modeling efforts, 10 Å halloysite layer types were not used in calculated solutions as fits could not be improved with their inclusion, even though halloysite is common in Kanhapludults (Joussein et al. Reference Joussein, Petit, Churchman, Theng, Righi and Delvaux2005). As discussed above, unaltered biotite was best modeled as a 10 Å trioctahedral mica with X = 1.0 using K in the interlayer and 1 mole VIFe per formula unit. Weathered biotite was best modeled as dioctahedral mica with X = 0.75 and 0.4 mole VIFe per formula unit as illite-like layers. Hydroxy-interlayered vermiculite (HIV) was also found as a discrete phase in the shallow samples, which exhibited a persistent ~14.2 Å reflection for EG-saturated samples and slightly collapsed to a 13.8 Å d spacing after 110°C treatment (Meunier Reference Meunier2007). HIV was best modeled in NEWMOD2 using trioctahedral chlorite.
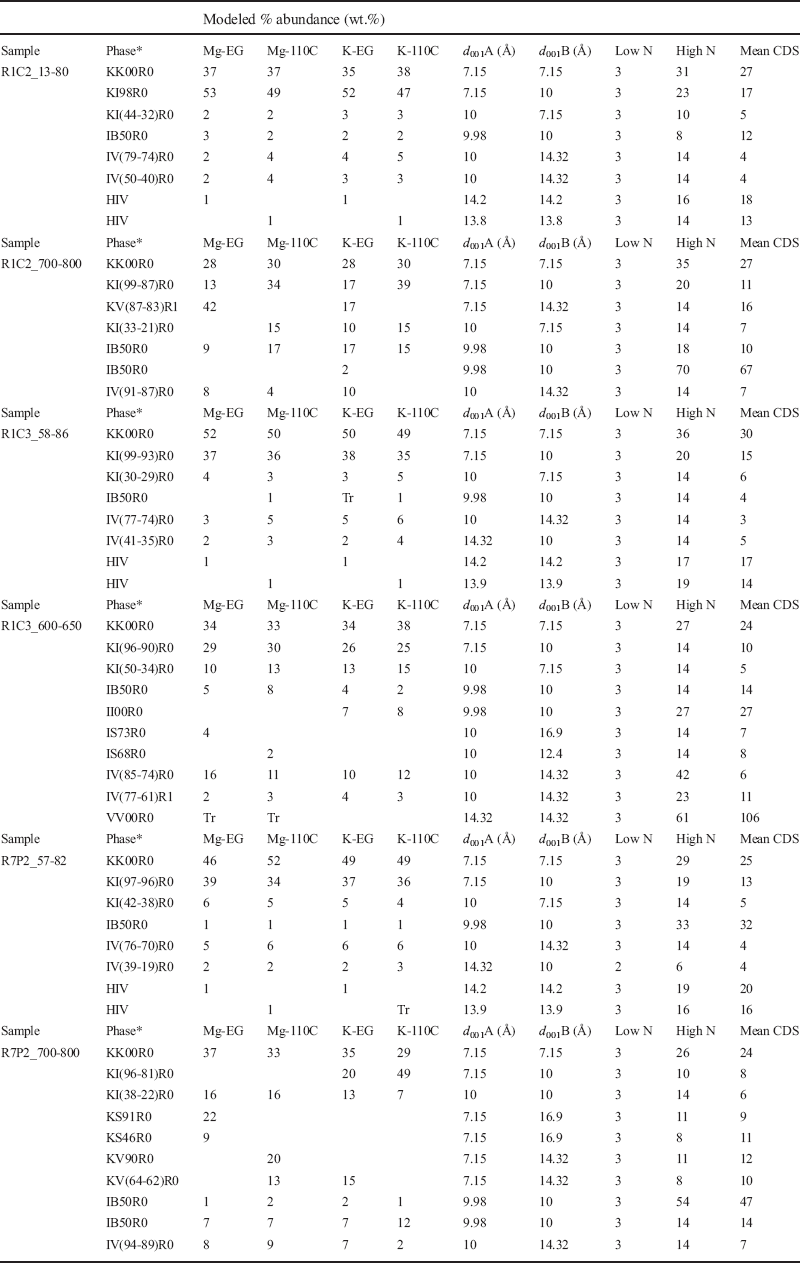
Based on the possible layer types resulting from combinations of interlayer cation type, layer charge, and hydration states, the following layer types were quantified in the NEWMOD2 calculations: B = biotite (trioctahedral mica), I = illite-like (modeled with tri- and dioctahedral mica), K = kaolinite, S = smectite (modeled as trioctahedral in EG state), V = vermiculite (modeled as trioctahedral), HIV = hydroxy interlayered vermiculite (modeled as tri- trioctahedral chlorite). NEWMOD2 modeling results (summarized in Table 2) include specific values used for layer types, relative abundance, layer dimensions, low and high coherent scattering domain numbers, and mean coherent scattering domain size. Full details of all the NEWMOD2 model parameter for every sample are presented in supplemental data (Tables S1a–f).
Modeled % abundance of mixed-layer clays using NEWMOD2

*Layer types: K = kaolinite, I = illite-like (as defined in this study), V = vermiculite, S = smectite, HIV = hydroxy-interlayered-vermiculite, B = biotite, R = reichweite (0 = randomly ordered, 1 = ordered). N = number of coherent scattering domain range (Low to High), CDS is mean coherent scattering domain size distribution as defined in NEWMOD2, Tr = trace.
For the following discussions about each location, the samples will be referred to as shallow and deep within each profile, representing B-horizon and C-horizons (i.e. saprolite), respectively. Also, the results refer to the modeled abundances of mineral phases in the Mg-sat/EG states. Model solutions were calculated for the other states as discussed above in the methods section, but they were used primarily to ensure that the solutions derived for the Mg-sat/EG patterns were correctly mass balanced (i.e. the expected changes in d spacing with the various treatments were observed in the XRD patterns).
Research Watershed 1 Cultivated Sites
The most abundant mineral deep in the R1C2 profile was KV(87-83)R0 (42 wt.%), followed by kaolinite (8 wt.%), KI(87-83)R0 (13 wt.%), IB50R0 (9 wt.% ), and IV(91-87)R0 (8 wt.% ). In the shallow sample, the most abundant phase was KI98R0 (53 wt.%) with KK00R0 (37 wt.%) and minor amounts KI, IB, IV, and HIV phases (<3 wt.%). Two populations of IB were observed in R1C2 that were distinguished by differences in their mean CDS (67 vs 10; i.e. well ordered and poorly ordered, respectively). HIV was not detected in the deep R1C samples, which is consistent with the observations of Barnhisel & Bertsch (Reference Barnhisel, Bertsch, Dixon and Weed1989), who noted that HIV generally forms at shallow depths in the soil where aluminum activity is high. Also observed were a small percentage of KI(44-32)R0 (2 wt.%) and an increase in KI98R0 from 13 wt.% to 53 wt.%, deep-to-shallow, respectively. Discrete kaolinite (KK00R0) was more abundant in the shallow sample than the deep sample.
Though the land-use histories for sites R1C2 and R1C3 are the same, the mixed-layer clays and abundances are distinctly different in several ways. One notable example in the deep sample of R1C3 is a greater abundance of vermiculite layers. The NEWMOD2 model solution included a discrete vermiculite phase because of a sharp 14 Å peak in the pattern, which indicated a large mean CDS. The reported Tr % indicated that the well-ordered vermiculite was probably present in trace amounts, but the abundance was too close to the detection limit using this method (Fig. S5). NEWMOD2 quantification has up to ±7% relative error and ±3 wt.% for layer-type abundance, which is based on repeated independent modeling of several samples by Austin et al. (Reference Austin, Perry, Richter and Schroeder2018). The deep samples also included two IS phases (IS73R0 and IS68R0) plus IV(77-61)R1 and IV(84-74)R0).
The shallow R1C3 downslope sample is distinct from the shallow R1C2 upslope sample where the relative abundance of kaolinite (52 wt.%) is greater than KI (41 wt.%) in R1C3, whereas the KI mixed-layer phase was more abundant than the kaolinite phase in R1C2. The abundances of the remaining phases in the shallow samples are comparable between R1C2 and R1C3.
Research Watershed 7 Pine Site 2
Deep in the forested profile (R7P2), two distinct forms of IB were found; one well ordered with a large mean CDS (47, 1 wt.%) and one poorly ordered with small mean CDS (14, 7 wt.%). Also observed were two KS phases that accounted for 31 wt.%. Kaolinite layers were more abundant (37 wt.%) than IB layers (16 wt.%). The deep sample also contained IV(94-89)R0 (8 wt.%).
The abundance of kaolinite (46 wt.%) was greater than the KI phase (29 wt.%) in the shallow sample (as in the profile at R1C3). The abundances of IV mixed-layers (7 wt.% combined) and KI (5 wt.%) with a majority of illite-like layers were the greatest for all the profiles. Trace amounts of HIV and an illite-like phase were also present (1 wt.% each).
Discussion
Quantification of mixed-layer clay phases allows comparison of the relative trends in clays as a function of land use and position in the depth profile, as proposed by Austin et al. (Reference Austin, Perry, Richter and Schroeder2018). Knowledge of the types of clay minerals present, especially with respect to their capacity to exchange cations with the biota and soil solution is fundamental for understanding the cycling of nutrients in the soil (see e.g. Lybrand et al. Reference Lybrand, Austin, Fedenko, Gallery, Rooney, Schroeder, Zaharescu and Qafoku2019). Areas such as the Calhoun CZO are perceived to bear only discreet clay-mineral assemblages (i.e. no mixed-layer clays). The present authors submit that, as a rule, although mixed-layer clays are not always abundant in soils, they are common in soils. Correct identification and accurate quantification of these mixed-layers requires careful and nuanced interpretations of oriented XRD patterns under variable saturation states. The combination of new paradigms for mineral-microbe relations (Lybrand et al. Reference Lybrand, Austin, Fedenko, Gallery, Rooney, Schroeder, Zaharescu and Qafoku2019) and advances in XRD analytics now allows the quantitative importance of mixed-layer clays and their role in CZ ecosystem function to be addressed. In particular, from the standpoint of uplift cycling of cationic nutrients (i.e. K+), the selectivity of microbial communities in contact with specific mineral surfaces, as shown by Lybrand et al. (Reference Lybrand, Austin, Schroeder, Zaharescu and Gallery2017), is important to both the early stages of mineral weathering and the late stages of establishing well-defined argillic horizons.
The modeled abundances of mixed-layer clays in the Calhoun CZO support the notion that they are present at both shallow and deep levels in the weathering profiles and often comprise >50% of the clay-mineral assemblage (Table 3 and Fig. 6). From the standpoint of exchangeable sites for nutrient sources and sinks, 2:1 layer types (i.e. B+S+I+V+H) have a greater capacity than 1:1 layer types (i.e. K) because of redox-induced changes in layer charge stemming from octahedral iron. The mechanism for this process, as proposed by Stucki (Reference Stucki, Stucki, Goodman and Schwertmann1988), involves uptake of cationic species coupled with structural Fe reduction during seasonal wet periods and release of cationic species coupled to structural Fe oxidation during seasonal dry periods (see also Barcellos et al. Reference Barcellos, Cyle and Thompson2018). Wetting and drying cycles in surface conditions have been shown to increase the abundance of illite in Fe-rich I-S mixed-layer clays, and that this process is only partially reversible (Huggett & Cuadros Reference Huggett and Cuadros2005; Ramirez et al. Reference Ramirez, Righi and Petit2005). The current working hypothesis is that the cation exchange capacity of the samples with more abundant 2:1 layer types would be greater than those with fewer 2:1 layer types.
Summation of layer-type abundances from all discrete and mixed-layer phases

Modeled abundance (wt.%) of layer types in each sample. K = kaolinite, I = illite-like, V = vermiculite, S = smectite, H = HIV. See text, which highlights general trends of greater abundance of 2:1 clays (I+V+S+H) at depth in all of the profiles and greater abundance of smetitic layers in the forested site and cultivated site situated in lower landscape positions

Deep samples at the CCZO have a relatively greater number of 2:1 layer types than equivalent shallow samples, for both forested and cultivated settings. The cultivated site situated lower in landscape position (R1C3) has a greater number of 2:1 layer types than the cultivated site higher in landscape position (R1C2). The weathering profiles in the forested site have a greater number of 2:1 layer types than the cultivated site. These trends point to factors that Jenny (Reference Jenny1941) established long ago, whereby variations in climate, parent material, topography, biota, and time all have an influence on the suite of minerals that are present in a soil. The exact mechanisms by which mixed-layer clays form has been a challenge to understand, but the nature of interlayer cations has been deemed important (Le Dred Reference Le Dred1978; Lanson Reference Lanson, Brigatti and Mottana2011; Viennet et al. Reference Viennet, Hubert, Ferrage, Tertre, Legout and Turpault2015). Through the multiple saturation approach and modeling results in this study, evidence is now provided that supports the idea that land cover and landscape position are causative factors in the formation of the mixed-layer mineral assemblages. Furthermore, the presence of mixed-layer clays and landscape management influence the cycling and fate of transport of potassium in temperate climate ecosystems. Samples deep in the profile of the cultivated site higher on the landscape (R1C2) show the least abundant 2:1 layer types. The deep samples from the cultivated site lower in landscape position (R1C3) have nearly the same overall abundance of 2:1 layers as the profile higher in the landscape, but the 2:1 layer types are smectitic. The pine plot exhibited the most abundant expandable layers (modeled as smectite and vermiculite) deep in the profile, particularly when compared to the deep cultivated site.
Comparing the shallow samples across all sites reveals they all have HIV present, which is common in the A-horizons and upper B-horizons of soils in this region (Barnhisel & Bertsch Reference Barnhisel, Bertsch, Dixon and Weed1989; Schroeder et al. Reference Schroeder, Kim and Melear1997). The forested site contains a greater amount of 2:1 clay layer types than the cultivated sites, thus favoring a larger pool in forested soils for sourcing/sinking cation nutrients. This is independently supported by total potassium concentrations measured in each profile (see Fig. S8). Averaging the bulk wt.% K2O in the upper 0–100 cm reveals an increasing trend of 0.18 to 0.48 to 1.00 wt.% K2O for R1C2, R1C3, and R7P2, respectively. Whereas for the deeper 100–700 cm the averaged K2O contents trend from 1.18 to 0.55 to 0.63 wt.% for R1C2, R1C3, and R7P2, respectively. Some lithologic control on these trends is likely, though the larger K2O contents of the pine-site surface soils support the notion that greater amounts of potassium are being retained, compared to the cultivated sites. Furthermore, the cultivated site in the highest landscape position has the lowest concentrations of K2O. These trends agree with the expected increase in leaching and decrease in near-surface addition of K+ hypothesized to occur via potassium uplift (Jobbagy and Jackson Reference Jobbagy and Jackson2004; Balogh-Brunstad et al. Reference Balogh-Brunstad, Keller, Bormann, O'Brien, Wang and Hawley2008). A further hypothesis is that equivalent sites forested with older hardwoods would have similar abundances of 2:1 layer types in shallow portions of their profile and greater abundances deep in the profile compared with pine and cultivated sites, thus collectively creating important pools for cation source/sink cycling, under all other equivalent soil-forming conditions (Schroeder Reference Schroeder2018).
The more detailed analysis of mixed-layer types presented here helps to define more accurately the mechanisms by which the K+ nutrient-uplift process works, particularly as discussed by Austin et al. (Reference Austin, Perry, Richter and Schroeder2018), Bacon (Reference Bacon2014), and Richter & Markewitz (Reference Richter and Markewitz1995). Proposed here is that the exchange sites in the mixed-layer clays offer a refugium for K+ (and possible NH4 +) as nutrients that are returned to the soil from decaying plant matter during the winter season. The wetter soil conditions during the winter promote reducing soil conditions, which increases negative layer charge in the mixed-layer clays. Compensating interlayer sites accommodate by adding cations, which serve for seasonal storage. Seasonal drying of the soils leads to onset of oxidation of the mixed-layer clays, which decreases layer charge and results in the release of stored interlayer cations, with subsequent availability of cation nutrients for uptake by plants during their growing season.
Conclusions
Using NEWMOD2 to simulate XRD patterns and quantify the relative abundances of mixed-layer clays in various saturation and hydration states from the CCZO revealed that land use and landscape position are causative factors in determining the differences in the mineral assemblages. The mixed-layer clay assemblages comprise a variety of 2:1 layer types (biotite, illite-like, vermiculite, smectite, and hydroxy-interlayer-vermiculite) and 1:1 layer types (kaolinite), all with variable ranges of layer types/proportions, ordering, and mean crystal size domains, depending on depth in profile, landscape position, and land use. A general trend is that more 2:1 layer types with exchangeable sites in the mixed-layering occurs in the lower landscape position relative to the higher landscape position. Another general trend is that more 2:1 layer types in the mixed-layering occur in the forested locations than in cultivated locations.
This leads to a generalization that upland cultivated sites in the Piedmont have less capacity for storage of cations, such as potassium, than managed forested sites. Potassium and other nutrients are hypothesized to be seasonally uplifted and cycled in soils. Primary minerals, biotite and feldspar, are hydrolyzed and/or transformed to create secondary mixed-layer clays. The secondary mixed-layer clays further undergo continued redox, hydrolysis, and transformation to generate other forms of mixed-layer clay. Independent measures of bulk potassium content from the samples studied showed greater concentrations in the forested sites near the surface compared with the cultivated sites. Of the two cultivates sites, the site lower in landscape position has greater concentrations near the surface compared with the site higher in landscape position. Assessment of soil clay-mineral assemblages in the critical zone by XRD, using multiple cation-saturation states and modeling is essential for quantifying the pools for cation nutrients, such as potassium. These mixed-layer clays are key components in the proposed mechanism for K+ uplift concepts.
Electronic supplementary material
The online version of this article (https://doi.org/10.1007/s42860-019-00060-x) contains supplementary material, which is available to authorized users.
Acknowledgments
This work was supported by NSF grant EAR-GEO-1331846. Thanks are given the entire team of Calzoners who can be recognized at http://criticalzone.org/calhoun/people/. The authors thank Will Cook for data archiving and management of the 2016 Big Dig program. Appreciation is also extended to anonymous reviewers and editors eho provided valuable feedback.
Compliance with Ethical Standards
Conflicts of Interest
The authors declare that they have no conflicts of interest.