





Introduction
In the aftermath of a disaster, medical coordination is crucial for facilitating an effective response to a surge in the health care needs of the affected population. Disaster medical systems in Japan have implemented disaster base hospitals (DBHs) as fundamental facilities and disaster medical assistance teams (DMATs) as national emergency medical teams (EMTs) for an effective response since 2005, following the 1995 Great Hanshin–Awaji Earthquake. Reference Egawa, Sasaki, Suppasri, Kayano, Murray and EYY1 Disaster medical coordinators have been designated in Hyogo Prefecture since 1996, followed by Miyagi, Niigata, and Hiroshima Prefectures before the 2011 Great East Japan Earthquake (GEJE). Its implementation rapidly spread nation-wide by 2015. Reference Egawa, Suda, Jones-Konneh, Murakami and Sasaki2 The Ministry of Health, Labor, and Welfare (MHLW; Tokyo, Japan) established activity guidelines for disaster medical coordinators in 2021. 3
However, a gap remains in the effective coordination of pharmaceutical assistance. Owing to logistical constraints, EMTs can only provide a limited number of medications on-site; EMTs also do not have sufficient time to explain medication use and side effects to patients and their families during the disruption of local health care services. Therefore, task sharing, cooperation, and coordination are critical.
During the 2011 GEJE, on March 11 (Day 0), the tsunami reached up to 4km inland in the Ishinomaki zone, consisting of Ishinomaki City, Higashimatsushima City, and Onagawa Town (Figure 1). 4 The tsunami destroyed most of the houses and buildings within the inundation zone, and a maximum of 30,000 people were evacuated to evacuation centers. Some evacuation centers were located within the inundation zone but were used as shelters whenever possible, even in the immediate phase. The general population aged ≥65 years accounted for 34.5%. 5 Thus, there was a strong need for both routine and emergency medications.
Tsunami-Inundated Area and Location of Evacuation Centers in Ishinomaki Zone.
Note: The zone comprises two cities (Ishinomaki and Higashimatsushima) and one town (Onagawa), as indicated by the black borderlines. The tsunami-inundation depths are represented by blue concentrations. The known evacuation centers are plotted as circles, where a blank circle indicates the evacuation centers without prescription records and the filled circles indicate those with prescription records. The JRC Ishinomaki Hospital is indicated by a double circle.

Figure 1. Long description
The zone comprises two cities (Ishinomaki and Higashimatsushima) and one town (Onagawa), as indicated by the black borderlines. The tsunami-inundation depths are represented by blue concentrations. The known evacuation centers are plotted as circles, where a blank circle indicates an evacuation center without prescription records, and a filled circle indicates one with prescription records. Many evacuation centers existed in the inundation area that could be used as shelters. The JRC Ishinomaki Hospital is indicated by a double circle in the center of the map. The contraction scale indicates 10 km.
The Ishinomaki City Hospital, a secondary hospital located on the coastline, was inundated on its second floor and lost its function. The Japanese Red Cross (JRC) Ishinomaki Hospital, a tertiary hospital and the designated DBH in the area, had been relocated to an inland location five years prior and was fully operational immediately after the disaster onset (March 11, 2011; Day 0). Pharmacies in urban areas were functionally disrupted by strong shaking and power outages. The tsunami destroyed two out of the five pharmaceutical distributors. Owing to telecommunications disruptions, staff from the remaining three distributors visited the JRC Ishinomaki Hospital in person on Day 2 to retrieve pharmaceutical orders.
On March 11 (Day 0), the JRC Ishinomaki Hospital enacted a pre-designated Miyagi Prefectural disaster medical coordinator. The initial 17 EMTs (13 JRC teams and four Japanese DMATs) arrived at the JRC Ishinomaki Hospital within 24-48 hours after the disaster onset. The first EMT peak occurred on March 14 (Day 3; Figure 2). Reference Ishii6 On March 20 (Day 9), the JRC Ishinomaki Hospital and all on-site EMTs cooperated to form the Ishinomaki Zone Joint Relief Teams (IZJRTs) and the area-line system to continuously care for patients in a large number of evacuation centers. Reference Ishii6,Reference Yamanouchi, Ishii and Morino7
Trend in the Number of EMTs and Pharmacists.
Note: The bar graph indicates the number of EMTs (teams). The lines indicate the number of relief pharmacists (individuals). Pharmaceutical coordination became effective on March 24, 2011.

Figure 2. Long description
The bar graph indicates the trend in the number of EMT teams. In Phase A, from March 11 to 23, the number of EMT teams increased from 17 on March 12 to a peak of 35 on March 14. The number of EMT teams decreased to 16 on March 17, then increased again starting March 18, reaching 48 on March 22. In Phase B from March 24 to April 5, the EMTs continued to increase from 52 and peaked at 59 teams on March 26 and 27. The number of teams decreased slightly but remained above 47 per day until April 5. The line graph shows the trend in the number of pharmacists (people), starting at 1 on March 14. On March 17, the number of pharmacists increased to seven. On March 23, it reached to 25. In Phase B, around 20 pharmacists worked for a week, gradually increasing to 34 at the peak on April 4.
The first pharmacist from outside of the JRC Ishinomaki Hospital was the director of the Ishinomaki Pharmaceutical Association (IPA)-owned pharmacy that was destroyed by the tsunami. He was evacuated from the tsunami and arrived at the JRC Ishinomaki Hospital on March 14 (Day 3), only to find that rescue work was on-going and that the necessary drugs were in short supply. He called the Japan Pharmaceutical Association (JPA) on that day, using a satellite phone, to request the dispatch of relief pharmacists as soon as possible. The JPA asked him to serve as the coordinator for the dispatched pharmacists. On March 15 (Day 4), the Miyagi Prefectural Pharmaceutical Association dispatched a pharmacist from Sendai, and additional pharmacists who were dispatched by the JPA from across the nation began to arrive on March 17 (Day 6; Figure 2).
However, during this initial phase (Phase A: March 11-23; 13 days), their activity was restricted to providing over-the-counter (OTC) medications that did not require prescriptions. They explained the use and side effects of OTC medications and previously prescribed medications to affected people. Several voluntary relief pharmacists worked at the JRC Ishinomaki Hospital pharmacy to support the dispensing of in-hospital prescriptions and prescriptions issued by EMTs at evacuation centers. Dispensed medications were distributed to people in evacuation centers by available EMTs. However, the shortage of EMTs made it challenging to distribute prescriptions on time and to explain medication use and side effects when different EMTs issued them.
After establishing the area-line system, which coordinated multiple EMTs to manage a large number of evacuation centers, the prescription and drug-delivery system for these centers became a concern. On March 23 (Day 12), the disaster medical coordinators at the JRC Ishinomaki Hospital and the pharmacists there initiated collaboration to ensure effective prescribing, dispensing, distribution, and medication education. On March 24 (Day 13), the pharmaceutical assistance system began. This system was called the “Melon Pan System,” named after a favorite relief food at that time. In the Melon Pan System, any EMT could prescribe any medications at any evacuation center and submit the prescription to the JRC Ishinomaki Hospital if they did not have the necessary medications on hand. The in-hospital pharmacy dispensed the drugs within two days, and the Melon Pan teams, comprising pharmacists, distributed them to the evacuation centers and explained their use. After implementing this system (Phase B: March 24-April 5; 13 days), all EMTs could prescribe drugs they did not have on-site. As shown in Figure 2, the number of EMTs reached a plateau and declined; however, the number of pharmacists gradually increased until the end of Phase B. The last in-field prescription in the Ishinomaki zone was issued on October 25, 2011. The cumulative total for the entire period was 1,008 EMTs (teams) and 380 pharmacists (individuals) from across the nation. Reference Ishii6,8 However, it took years for the local health care providers to recover full function.
The IZJRTs preserved disaster medical records (DMRs) from evacuation centers and homes after the GEJE because legal ownership of the DMRs was not established in Japan. Still, they were the only medical records for the in-field medical treatments. 9 Researchers have integrated these DMRs, compiled at the JRC Ishinomaki Hospital by IZJRTs, into an anonymized database with ethical approval. The prescription section of the database was completed for data cleansing in November 2024 and was ready for analysis.
This study aimed to assess prescription trends before (Phase A) and after (Phase B) the implementation of the Melon Pan System, which is the first ad hoc model of pharmaceutical coordination in Japan.
Methods
Ethical Approval
The anonymization of DMRs and their use in this study were approved by the Ethics Committee of the Graduate School of Medicine, Tohoku University (Approval Numbers: 2018-1-315, 2021-1-1038, 2022-1-1046, and 2025-1-325).
Ishinomaki Zone Pharmaceutical Data
The database collected anonymized DMRs in Minamisanriku Town, Reference Suda, Murakami and Nakamura10,Reference Nakamura, Suda and Murakami11 Kesennuma City (unpublished), and the Ishinomaki zone (current study). A privacy-mark company anonymized the handwritten DMRs, Reference Suda, Murakami and Nakamura10 and the data cleaning of the pharmaceutical data in the Ishinomaki zone was completed in November 2024. The clinical diagnosis and treatment sections are still undergoing data cleaning (as of April 2026). To compare Phase A and Phase B, the inclusion and exclusion criteria in this study were as follows.
Inclusion criteria included:
-
1. DMRs in the Ishinomaki zone from March 11 through April 5, 2011.
-
2. DMRs with prescription records, including OTC and cipher prescriptions.
Exclusion criteria included:
-
1. DMRs after April 5, 2011.
-
2. DMRs without any prescriptions.
-
3. DMRs without any visit date.
-
4. Prescriptions whose date was not recorded.
-
5. Prescription sheets without medical records.
Various types of prescriptions were handwritten in DMRs with or without copies of prescription sheets, prescriptions to the same patient several times a day, and prescriptions from different doctors (eg, surgeons, internists, and psychiatrists), making it impossible to accurately count the number of prescriptions per patient on the same day. Therefore, the number of prescriptions was defined as one per day of visit, regardless of the number of prescription sheets or prescribed medications.
After segregating the commercial and generic names, the prescribed medications were counted and categorized. Medication categories were determined based on the Kyoto Encyclopedia of Genes and Genomes (KEGG) drug database 12 and publicly available medical data sources. Medication names, dosage regimens, and prescription durations were digitized.
Patient visits were counted as one visit on the same day, with the earliest recorded date defined as the first visit, even when the handwriting suggested an earlier visit without a recorded date. Unrecorded dates, sex, age, or other parameters blacked out for anonymization were treated as missing values.
Retrospective Cross-Sectional Analysis of Pharmaceutical Trends
The numbers of new patients, returning patients, prescriptions, prescribed medications, and prescription durations during Phase A and Phase B were compared. The prescription duration of a cold remedy (typical short-term prescription in ordinary times) and that of overall anti-hypertensive drugs (typical long-term prescriptions in ordinary times) were compared. As the distribution of prescription durations was not normal, the nonparametric Wilcoxon rank-sum test was used, and P < 0.05 was considered statistically significant. Point estimates of prescription durations were reported as medians with 95% confidence intervals (CIs), ranging from the 2.5th to the 97.5th percentile.
Geographical Analysis
The locations of the evacuation centers were plotted on a map using ESRI ArcGIS Pro (Ver. 3.5.1; ESRI; Redlands, California USA). The number of evacuees on the date closest to March 24, 2011 was retrieved from publicly available local government reports. 13,14 The addresses of the evacuation centers were obtained from the municipalities’ official websites. Evacuation centers where prescriptions increased by more than three-times in Phase B and those where prescriptions started in Phase B were visualized on maps.
Results
Patient Characteristics during Phase A and Phase B
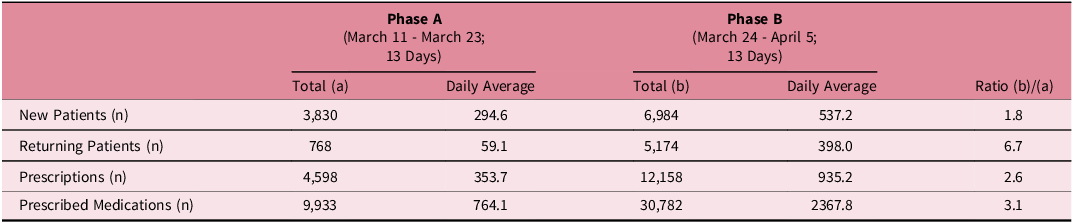
Of the 12,142 patients treated at the evacuation centers in the Ishinomaki zone, the number of new patients during Phase A and Phase B was 10,814 (89%), which was 5.1% (1.8% in Phase A, 3.3% in Phase B) of the general population of 213,157 based on the 2010 Census data. 5 The number of new patients increased 1.8-times from 3,830 in Phase A (294.6/day) to 6,984 in Phase B (537.2/day), while the number of returning patients increased 6.7-times from 768 in Phase A (59.1/day) to 5,174 in Phase B (398.0/day; Table 1). The age and sex distribution of patients in each phase are shown in Figure 3A and Figure 3B, along with the 2010 Census data for the Ishinomaki zone as the general population in Figure 3C. 5 Compared with the general population, the ratios of older individuals and females treated in the evacuation centers increased. The proportions of female patients were 77.1% in Phase A and 56.9% in Phase B, both of which were higher than that of the general population (51.9%).
Number of New and Returning Patients, Prescriptions, and Prescribed Medications in Phase A and Phase B

Table 1. Long description
The total number of new patients was 3,830 (294.6/day) in Phase A and 6,894 (537.2/day) in Phase B, with an increase ratio of 1.8. The number of returning patients was 768 (59.1/day) in Phase A and 5,174 (398.0/day) in Phase B, with an increase ratio of 6.7, indicating that close to half of the total patients are returning patients in Phase B. Because the prescriptions were counted as one for a patient per day regardless of the number of medications and actual prescription sheets, the number of prescriptions is the number of prescribed patients. The number of prescriptions was 4,598 (353.7/day) in Phase A and 12,157 (935.2), with an increase ratio of 2.6. The number of prescribed medications was 9,933 (764.1/day) in Phase A and 30,782 (2367.8/day) in Phase B, with an increase ratio of 3.1.
Patient Demographics by Age and Sex.
Note: (A) Age and sex distribution of patients who first visited in Phase A; (B) in Phase B; and (C) general population data based on the 2010 Census data (two cities and one town). The proportion of patients aged ≥60 years, and of females, are indicated.

Figure 3. Long description
Black bars indicate males; White bars indicate females. Under the graphs, the ratios for 60 y.o. and older and for females are indicated. In panels A and B, the age and sex distribution of patients who first visited in phases A and B is shown, respectively. The age distribution reflects the background population, but the patient age groups 20-29 and 30-39 were lower than in the background population. In Phase A, the age groups 0-9 and 10-19 exceeded 200, peaking at 493 in the 70-79 age group. The ratios for 60 y.o. and older and for females were 46.3% and 77.1%, respectively. In Phase B, the age groups 0-9 and 10-19 exceeded 400, peaking at 1,169 in the 60-69 age group. The ratios for 60 y.o and older and for females were 45.2%, and 56.9%, respectively. In the background population, the ratios for 60 y.o. and older and for females were 34.9% and 51.9%, respectively.
Prescriptions during Phase A and Phase B
Figure 4 shows the daily trends in the total prescriptions and prescriptions for new patients. The overall number of prescriptions was 16,756 (644.5/day) and the number of prescribed medications was 40,715 (1,566.0/day); Table 1. The number of prescriptions increased 2.6-times and the number of prescribed medications increased 3.1-times, indicating that pharmaceutical needs and deliveries increased significantly in Phase B. The remarkable increase in returning patient prescriptions accounted for more than one-half of the daily prescriptions in late Phase B (Figure 4).
Trend in the Number of Prescriptions.
Note: White bar - number of prescriptions in Phase A. Grey bar - number of prescriptions in Phase B. Black line - Number of prescriptions for new patients.

Figure 4. Long description
In Phase A, the number of prescriptions increased linearly from 4 on March 11 to 825 on March 23. Most of them were for new patients. In Phase B, the daily prescriptions peaked at 1,124 on March 26, then remained around 1,000 for a week and above 800 until April 5. The rate of new-patient prescriptions began decreasing on March 18 and became more apparent in Phase B. After April 1, the prescription numbers for new patients were less than half of the daily prescriptions.
Trend of Drugs for Acute Conditions and Non-Communicable Diseases
The prescription durations of a cold remedy (typical short-term prescription in ordinary times) and that of overall anti-hypertensive medications (typical long-term prescriptions in ordinary times) Reference Suda, Murakami and Nakamura10,Reference Murakami, Sasaki, Pascapurnama and Egawa15 were compared. As shown in Figure 5, the median prescription durations of the cold remedy were very similar in Phase A (three days; 95% CI, 2-7 days) and Phase B (three days; 95% CI, 2-7 days), although the Wilcoxon test indicated a statistically significant difference (P < 0.0001; Figure 5A). In contrast, the median prescription duration for anti-hypertensive drugs significantly increased from seven days (95% CI, 2-14 days) in Phase A to nine days (95% CI, 3–30 days) in Phase B (P < 0.0001). The typical prescription durations for anti-hypertensive drugs in Phase A were three or seven days, whereas in Phase B, durations were seven, fourteen, or thirty days (Figure 5B).
Prescription Durations of (A) Cold Remedy and (B) Anti-Hypertensive Drugs.
Note: The prescription duration for each phase is plotted. Median and 95% CI. *P < 0.0001, Wilcoxon signed-rank test.

Figure 5. Long description
Panel A shows the prescription durations for a cold remedy (PL, registered trademark), which is typically prescribed for three days in ordinary times. Panel B shows the prescription durations of anti-hypertensive drugs, which are typically prescribed for the long term. For PL, the median prescription durations in Phases A and B were the same, 3 days, with 95% confidence intervals (CIs) of 2 to 7 days, respectively, and the difference was statistically significant (p<0.0001) by the Wilcoxon signed-rank test. The frequency of 5- or 7-day PL prescriptions increased. For antihypertensive drugs, the median prescription duration was 7 days in Phase A (95% CI: 2-14 days) and 9 days in Phase B (95% CI: 3-30 days). The difference was statistically significant (p<0.0001) by the Wilcoxon signed-rank test. Compared to the frequent 3-day anti-hypertensive prescriptions in Phase A, the frequency of 14- or 30-day anti-hypertensive prescriptions increased in Phase B.
As the Melon Pan system became the standard of operation, the number of prescribed medications and their categories increased. In Supplementary Table 1, the medication categories are sorted according to the frequency of prescribed medications. Of the 169 medication categories, there were nine categories with >1,000 frequencies during the two phases (per 26 days), including oral non-steroidal anti-inflammatory drugs (NSAIDs), anti-hypertensive drugs, antibiotics, anti-tussive drugs, anti-allergic drugs, anxiolytic and hypnotic drugs, expectorants, peptic ulcer drugs other than H2 blockers and proton pump inhibitors, and laxatives. Fifty (29.6%) categories increased more than three-times in Phase B. These included respiratory, gastrointestinal, and metabolic drugs not only for acute symptoms, but also for the treatment of pre-existing chronic non-communicable diseases (NCDs). Reference Murakami, Sasaki, Pascapurnama and Egawa15 Prescriptions for ointments to treat various skin conditions and eye drops to treat allergies, dry eyes, and cataracts also markedly increased in Phase B. Several traditional Japanese herbal drugs were used more frequently to treat flu-like symptoms in Phase B. Sixty-two (36.7%) categories were first prescribed in Phase B, including anti-fungal drugs, vitamin D, polakisuria drugs, among others, suggesting the increased capacity to respond to the diverse needs of patients.
As shown in Figure 6, 33 out of 37 (89.2%) evacuation centers where prescriptions increased more than three-fold in Phase B and 37 out of 39 (94.9%) evacuation centers where EMTs began visiting in Phase B were located within the tsunami-inundated areas or were remote (>10km from the JRC Ishinomaki Hospital; Supplementary Table 2 and Supplementary Table 3).
Location of Evacuation Centers and Prescription Trends.
Note: Black circles - Evacuation centers in which prescriptions increased more than three-fold in Phase B. Grey circles - Evacuation centers in which the number of prescriptions did not increase three-fold. Red triangles - Evacuation centers where prescriptions were first prescribed in Phase B.

Figure 6. Long description
Black circles are evacuation centers in which prescriptions increased more than three-fold in Phase B. Grey circles are evacuation centers in which the number of prescriptions did not increase three-fold. Red triangles: Evacuation centers where prescriptions were first prescribed in Phase B. The black circles and red triangles are mostly located in tsunami-inundated areas with limited access or in remote areas more than 10 km from the JRC Ishinomaki Hospital.
Discussion
In Japan, there are few studies on drug delivery and related task sharing in disaster-stricken areas during major disasters. The DMR database provides anonymized primary data on the situation after the 2011 GEJE, including treatment and prescription details. Using this database, previous studies have analyzed the prevalence and time trends of diseases, Reference Suda, Murakami and Nakamura10 sleep disturbances, and prescriptions for sleeping pills and anxiolytic drugs, Reference Nakamura, Suda and Murakami11 as well as the delay in medical relief for evacuees at home compared to those in evacuation centers in Minamisanriku Town. Reference Tsuboi, Sasaki and Park16 The current study employed a retrospective cross-sectional analysis of pharmaceutical trends before and after the Melon Pan System’s implementation using DMRs in the Ishinomaki zone. The Melon Pan System was made possible by disaster medical coordinators in Miyagi Prefecture. Reference Egawa, Suda, Jones-Konneh, Murakami and Sasaki2,Reference Ishii6 However, the operational details of the collaboration between medical and pharmaceutical workers took two weeks to finalize. Although a retrospective cross-sectional analysis could not prove causality, the IZJRTs, including pharmacists, effectively responded to the remarkable increase in pharmaceutical needs among affected people. The extraordinary growth in the total prescriptions, returning patients, prescribed medications, and prescription durations indicates that the medical needs of the affected people dramatically increased after two weeks and remained high during Phase B, possibly because the people who survived the earthquake and tsunami were not severely injured, and they needed to continue taking their daily medications for their chronic condition in situations where local health care providers were disrupted. This was similar to the change in medical needs in Minamisanriku Town, where the first visits of the patients with NCDs, infectious diseases, minor injuries, and mental health issues peaked within two weeks after the onset. Reference Suda, Murakami and Nakamura10 If coordination was not possible, the medical relief provision would have faced significant difficulties in prescribing, dispensing, delivering, and educating medications to the affected people. As shown in Figure 6, prescriptions increased more than three-times in Phase B or became possible only in Phase B, especially in the evacuation centers located in the tsunami-inundation zone or remote (>10km from the JRC Ishinomaki Hospital) areas. This suggests that the relief activities of the IZJRTs became significantly easier after the Melon Pan System was implemented.
In Phase A, the IZJRTs provided only the medications they had on-site for patients’ acute needs, such as pain, fever, and diarrhea. In Phase B, the number of medication categories increased significantly to support the diverse medical needs of the affected people. Figure 5 indicates that the prescription duration of anti-hypertensive drugs significantly increased in Phase B to reduce the frequency of revisits. Medications were prescribed more often in response to patient requests because of difficulties in accessing health care, and this was more prominent for anti-hypertensive drugs for patients who needed continuation of the medication. Due to damage to local health care services, the IZJRT’s relief aid and long-term prescriptions were necessary for months until local services reopened.
The increase in the number of medication categories (Supplementary Table 1) indicated the diversity of medical needs in the affected population. As shown in Figure 3, the age and sex distributions of patients in the evacuation centers and at home mirrored those of the general population. The total number of patients significantly increased in Phase B, whereas the number of prescriptions for new patients decreased (Figure 4). In the previous study in Minamisanriku, NCDs (68.0%) represented the most frequent medical need, followed by infectious diseases (22.0%), mental health issues (6.0%), trauma (4.0%), and maternal and child health issues (0.2%). Reference Suda, Murakami and Nakamura10 Though the actual diagnoses in the Ishinomaki zone are under investigation, the diversity of medications suggests similarly frequent NCDs and diverse medical needs in this area.
In the chaotic aftermath of the disaster, the role of pharmacists, through the Melon Pan System, in terms of providing medication education to evacuees helped ease the anxiety of patients and their families. The EMTs lacked the time to deliver the prescribed medications to patients and to provide adequate medication education; even the other teams that took over could not remain there for prolonged periods. Although it took one or two days for the drugs to be delivered to the patients, the Melon Pan System team’s pharmacists were confident in providing the correct medication to the right patient and guiding the patients and their families on the appropriate use of their medications. They also served as sentinels for health and hygiene situations in evacuation centers. Reporting environmental conditions to medical coordinators enabled the implementation of proactive measures to prevent disease outbreaks. Reference Akaishi, Morino and Maruyama17
In light of the Nankai Trough Earthquake, Tokyo Metropolitan Earthquake, and Kuril Islands Trench Earthquake, the MHLW has stipulated – effective as of the 2024 Financial Year – that each prefecture must designate disaster pharmaceutical coordinators. 18 However, no standards have been established for specific systems or human resource development. If such a system were established and training were in place, earlier relief aid could be possible. In an aging society such as Japan, people need daily medications more frequently. Even if prepared, stockpiles of daily medications are limited. Therefore, early pharmaceutical support is essential. The Melon Pan System is a result of the collaboration between disaster medical coordinators, EMTs, and pharmacists. The area-line system was published in 2014; Reference Yamanouchi, Ishii and Morino7 the development of the conductor-type health care workforce for disaster medicine, including the disaster pharmaceutical affairs curriculum, was presented in 2023. Reference Ishii and Shimada19 The good practice of the Melon Pan System was also presented at academic conferences. The voices of pharmacists, EMTs, and medical coordinators all promoted the implementation of the MHLW’s policy, which established activity guidelines for disaster pharmaceutical coordinators in 2025. 20 Currently, 29 (61.7%) of 47 prefectures have appointed disaster pharmaceutical coordinators as of March 31, 2025. 18
There are other areas for improvement in pharmaceutical coordination beyond implementation and training. Prescriptions and medical records are handwritten, making them difficult to digitize and hindering the quick flow-through of orders and verifications in an era of digital medical records. In 2015, a Joint Committee of related academic and medical associations reached a consensus that the legal aspects of DMRs should be temporarily exempted from medical record guidelines. The format and usage were updated in 2018, including the adoption of a standardized digital medical record format; however, digital prescriptions are not yet available. 9 Continuous improvements are necessary to provide more efficient relief aids. Pharmacists were heavily involved at the JRC Ishinomaki Hospital, where they handled the influx of relief aid drugs and medical supplies, incoming prescription orders, dispensing, and distribution of outgoing medications. These are linked to supply chain functions, logistics, and communication. Standard terminology and improvements to the backyard process should be shared.
Medical and pharmaceutical datasets in the anonymized DMR database can serve as the basis for assessing disaster health impacts. By comparing the Ishinomaki data with those from tsunami-affected Minamisanriku Town and Kesennuma City, where the communities are aging but have different geologies, remaining functional health care facilities, and EMT coordination in place, these datasets can serve as quasi-experimental models Reference Vigneri and White21 or a digital twin model for disaster health management. Reference Koshimura, Mori, Chikasada, Goda, De Risi, Gusman and Nistor22
Limitations
This study presents a retrospective cross-sectional analysis of a dynamically changing situation immediately following a low-frequency large-scale disaster, the GEJE; therefore, it is not possible to prove the effectiveness of the pharmaceutical coordination system. However, the experience of establishing an ad hoc initial model of pharmaceutical coordination made Japanese practitioners aware of its importance. Actual clinical diagnoses still require data cleaning by medical professionals because of the large volume of anonymized handwritten DMRs containing numerous specific medical terminologies.
This study used only data from 26 days (until April 5) after the disaster’s onset to compare prescriptions between Phase A and Phase B, although the relief operations lasted until the end of October. However, this period encompassed the peak number of new patients (89%) and showed a notable increase in prescriptions in Phase B.
In this study, the details of the backyard process were not able to be analyzed, including supply chains and dispensing activities, all of which require specific disaster management. However, the practitioners involved shared their experiences and knowledge with the relevant societies.
Conclusion
Following the 2011 GEJE, the Melon Pan System in the Ishinomaki zone became the first model in Japan for pharmaceutical coordination during large-scale disasters. The ad hoc pharmaceutical coordination system was effective and necessary for EMTs to focus on patient care and for pharmacists to provide more pharmaceutical assistance to patients. The number of prescriptions increased significantly within two weeks of disaster onset and remained high, with a remarkable increase in returning patients in Phase B. The DMR database enabled the statistical analysis of prescription trends and the effectiveness of medication delivery. Establishing proactive and effective pharmaceutical coordination, including supply chain management, is necessary for resilient disaster medical systems.
Supplementary Materials
To view supplementary material for this article, please visit https://doi.org/10.1017/S1049023X26109042
Acknowledgements
This work is derived from the dissertation for a master’s degree.
The authors sincerely appreciate the help of Yuriko Takeda for her generous technical support in creating the geological maps of municipalities, evacuation centers, and tsunami inundation depths. The authors also appreciate the tireless efforts of Aya Murakami, Tomomi Suda, Yayoi Nakamura, Hiroe Terakawa, Mari Sato, Risa Fujiwara, Hirotsugu Kawasaki, and Yo Chida for their technical assistance in the creation of the anonymized database.
Author Contributions
YT, SE, TK, and TI designed the study. SE provided the anonymized disaster medical record database. YT was Vice President of the Miyagi Pharmaceutical Association at the time of the Great East Japan Earthquake. TI was the disaster medical coordinator assigned by Miyagi Prefecture at the time of Great East Japan Earthquake. HS and TI are the disaster medical coordinators of Miyagi Prefecture. YT, RA, and SE analyzed the prescriptions and evacuation center data using the anonymized disaster medical record database. ST advised on the traditional Japanese Kampo drugs. YT and SE drafted the manuscript. TK and TI supervised the study. RA, ST, MT, HP, and HS critically reviewed the manuscript. All authors approved the final version of this manuscript.
Funding Statement
This work was partly supported by the JSPS KAKENHI Grant Numbers 17H00840, 17H06108, and 21H05001. The Disaster Resilience Co-Creation Center, IRIDeS, and the Core Research Cluster for Disaster Science in Tohoku University partly supported this work.
Competing Interests
All authors declare that there is no conflict of interest.
Use of AI Technology
No artificial intelligence (AI) tools were used to construct the manuscript except for translational assistance.




 Open access

