The adolescence encompasses a change in the relationships pattern characterized by a greater closeness to the peers, the focus on the group as the key reference, and the overhauling of parents’ major role on childhood (Erwin, Reference Erwin1998). In fact, the reciprocity of peer relationships includes the adolescent’s perception that he/she is validated by his/her friends which has an important function in terms of youth’s social development (Bukowski, Motzoi, & Meyer, Reference Bukowski, Motzoi, Meyer, Rubin, Bukowski and Laursen2009). From a developmental point of view, the adolescent understands early that the world contains different groups and that these groups vary as a function of some features (e.g., gender or ethnicity) (Killen, Rutland, & Jampol, Reference Killen, Rutland, Jampol, Rubin, Bukowski and Laursen2009).
As such, the social comparison characterizes the intergroup relationships and the need to categorize the world is a significant part of human cognition (Brown, Reference Brown2000). In this context, social comparison (i.e., people tend to compare themselves with others and, particularly, their group with other groups) plays an important role in terms of self-concept and identity, since this comparison could contribute to the self-enhancement (Hogg, Reference Hogg, Suls and Wheeler2000). In fact, according to the social identity theory, the individual’s self-concept includes the emotional and valued membership in social groups (Tajfel, Reference Tajfel1982). As such, a positive social identity derived from a constructive evaluation of the group, and the literature suggests that this membership seems to contribute to enhance the individual’s social development (Tarrant, Reference Tarrant2002). The sense of belonging to a group is associated with positive outcomes in terms of development (e.g., individual security, social companionship, intellectual stimulation and collaborative learning), given that the group can provide a sense of stability, meaning and life goals, which is associated with higher levels of mental health (Haslam, Jetten, Postmes, & Haslam, Reference Haslam, Jetten, Postmes and Haslam2009).
Nevertheless, the ability to categorize the world leads to different patterns of inter-group relationships, which can include processes of labeling (Bartusch & Matsueda, Reference Bartusch and Matsueda1996; Brown, Reference Brown2000). The social labeling seems to have a key developmental function in the adolescence since social interactions allow the construction of a social reality by youth, the selection of friendships, and the definition of different status groups - according to the social-type labels (Kinney, Reference Kinney1993). During the adolescence it becomes increasingly important to be accepted in the peer group and to belong to a group positively evaluated (Erwin, Reference Erwin1998). When the individual perceives that he/she belongs to a group that is socially viewed as being inferior to other groups, this perception may have a negative impact in terms of his/her well-being (Haslam et al., Reference Haslam, Jetten, Postmes and Haslam2009). Since the group membership is part of the individual’s self-concept, a positive evaluation of the group seems to be associated with a better well-being and social development (Tarrant, Reference Tarrant2002). Furthermore, the more the individual feels good about themselves (Diener & Diener, Reference Diener and Diener1995) and the more positive are their relationships with their peers, the higher the life satisfaction they will reveal (Gilman & Huebner, Reference Gilman and Huebner2003).
Despite the well-established importance of peers and groups in the adolescence considering the youth social and psychological development, there are some problems in the literature about this issue. On the one hand, even though the literature has explored self-concept and self-representations more systematically, both theoretically and in terms of measurement, (e.g., Harter, Bresnick, Bouchey, & Whitesell, Reference Harter, Bresnick, Bouchey and Whitesell1997; Holahan, Holahan, & Wonacott, Reference Holahan, Holahan and Wonacott1999; Isabella & Diener, Reference Isabella and Diener2010; Markus & Wurf, Reference Markus and Wurf1987), the adolescents’ perceptions about their groups has been less explored; and when the studies do consider these perceptions there are no samples of young people in residential care. In fact, the assessment of group perceptions is grounded on social identity framework and, typically, the studies have been used a set of descriptors to evaluate those perceptions (Tanti, Stukas, Halloran, & Foddy, Reference Tanti, Stukas, Halloran and Foddy2011; Tarrant, Reference Tarrant2002). These measures comprises a list of attributes that are rated by adolescents as positive or negative in terms of valence as well as if they are a good or bad description of the group (Tarrant, Reference Tarrant2002). However, these measures merely allow an analysis on negative or positive evaluation of the group, but there is no detailed analysis in terms of latent content behind those attributes. In fact, if the self-representations scales provide information about the content of these representations (e.g., Intelligence, Emotional, Physical Appearance; e.g., Martins, Reference Martins2012), these measures used to evaluate or describe the group do not include these content dimensions. Moreover, considering the specificities of a sample in residential care (since this is a group that could be socially stigmatized; Casas, Cornejo, Colton, & Scholte, Reference Casas, Cornejo, Colton and Scholte2000), these measures do not account the ecological validity of those attributes. For that reason, this study aims to add evidences on the measurement of youth’s perceptions about their group in residential care, in terms of latent dimensionality and considering a participatory approach of youth in care. To our best knowledge, there are no instruments specifically developed or adapted to assess these perceptions with the specific populations of youth in care. As such, the aims of this study are: 1) to describe the construction of a scale focused on youth’s perceptions about their group in care and 2) to provide evidences of validity and reliability.
Method
Participants
This study included 360 adolescents (55% males) from 11 to 18 years old (M = 14.72; SD = 1.81) in residential care. In terms of academic degrees, most of them are attending the third cycle (49%) and 80% failed at least once (18% failed three or more times). These youth came from vulnerable families characterized mainly by unemployment (42%), parental divorce/separation (32%), alcohol abuse (30%), domestic violence (26%), and psychiatric disorder (21%). Looking for the placement history, 65% of young people are in residential care for the first time, and considering those who had been previously in another institution, 24% had been in two or three settings. The mean of placement’ time in the present institution is 39 months (approximately 3 years) and the mean of total placement’ time is 54 months (approximately 4 years and half). Regarding the reasons for the residential placement, the majority of youth was neglected (58%) followed by an exposure, directly or indirectly, to behaviors seriously affecting their protection (39%).
In terms of residential settings, 59 institutions are represented here, in a national study, which involves settings from all districts of the country (68% in urban contexts), including the three typologies: mix (42%), only for females (25%), and only for males (32%). It is important to note that these residential settings are part of the promotion and protection system for children and young people at risk, for protection reasons and not therapeutic. Also, the residential care is the most frequent out-of-home service adopted in the country (it represents 89% and the foster care only 5%) (Social Security Institute, 2013).
Instruments
The Group Perceptions Scale
This scale was developed based on the literature, specifically, from the list of adjectives used by Tarrant (Reference Tarrant2002) with normative adolescents. These adjectives were translated and adapted to the present work. The author used those adjectives in a group evaluation task in which the adolescents rated them in terms of group description and valence (positive vs negative), in order to provide evidences in terms of ingroup and outgroup comparisons. In the present study, those adjectives were adapted and included in the process of construction of the final scale, which involved the inclusion of data provided by youth in residential care (gathered previously in focus groups). Similarly to the Tarrant’ list of adjectives (Reference Tarrant2002), the present instrument would be answered in a scale from 0 (the adjective is a bad description of the group) to 10 (the adjective is a good description of the group).
The Satisfaction with Life Scale
The Portuguese version for adolescents was used in this study (Neto, Reference Neto1993, adapted from the original version developed by Diener, Emmons, Larsen, & Griffin, Reference Diener, Emmons, Larsen and Griffin1985). The Satisfaction with Life Scale is a five item measure answered in a 7 point likert scale (ranged from 1 (strongly disagree) to 7 (strongly agree). In terms of internal consistency, the author found a Cronbach’ Alpha of 0.78 (Neto, Reference Neto1993).
Procedures focused on the instrument development
A pool of 30 items was created based on data from prior literature (16 items were translated and adapted from Tarrant, Reference Tarrant2002) and from a previous study (Magalhães & Calheiros, Reference Magalhães and Calheiros2014) developed with youth in residential care (14 items). The 16 items from Tarrant (Reference Tarrant2002) were translated and adapted for the Portuguese language, followed by a back-translation. The 14 items that emerged from a previous study were obtained in six focus groups with 29 adolescents, aged 12 to 18 years old, in six residential settings (Magalhães & Calheiros, Reference Magalhães and Calheiros2014). This set of 30 items was then evaluated in terms of their understanding with a spoken discussion with youth in residential care, in order to guarantee that the items’ content was clear and that the adjectives were adequate to the group description. Furthermore, evidences based on test content were achieved also by a careful analysis from five experts. The final version of the scale contains 26 items that was filled out by the participants in this study, and then the further evidences of validity and reliability analysis were tested.
Ethics on data collection
The data collection was performed respecting the ethical principles for research, safeguarded by an Ethical Disclaimer from the Scientific Commission of the hosting institution. This study was presented to the institutions and permission was requested for the participation of youth in this study. The main objectives of the study were presented to the participants in the institution, and a friendly and reserved space was selected for the completion of the questionnaire. Their consent was required by the researcher using a clear and accessible language to assure that they understand the information, and safeguarding that their participation was voluntary and that they apprehend the confidential nature of the data. The risk associated with the participation in this study involved the possible weariness associated with the completion of the questionnaires. For that reason, youths were informed that they could withdraw from participating at any time (even if they merely completed a few questions) in order to avoid any exhaustion that could affect their well-being. The participants agreed with the terms and conditions of the study and wanted to participate.
Procedures of data analysis
The data analysis was performed with the IBM SPSS Statistics for Windows (IBM, 2010) and AMOS 20 (Arbuckle, Reference Arbuckle2011). A set of validity evidences were tested: 1) Evidence based on test content: five experts composed an evaluation panel that assessed the relevance of those attributes to assess the youth’s perceptions about their group in residential care. These experts are psychologists with practical and/or research experience in child protection and welfare. They filled out a form with a brief description of the theoretical framework behind the scale and the items listed. Each item was classified by these experts as “relevant” or “not relevant” to assess those perceptions in care. The consensus from these judgments was quantified using the approach provided by Lawshe (Reference Lawshe1975); 2) Evidence based on response processes: a spoken discussion was performed with a small group of youth in residential care (N = 4) in order to verify if the individuals understand those items and consider that these items are pertinent to assess their perceptions about the group; 3) Evidence based on internal structure: this type of evidence was tested with a Principal Components Analysis (PCA) and a Confirmatory Factor Analysis (CFA). According to Schermelleh-Engel, Moosbrugger, and Muller (Reference Schermelleh-Engel, Moosbrugger and Muller2003) the analysis of the model fit from the CFA should consider a range of criteria based on different measures. Since the χ2 statistic is sensitive to the sample size, we considered the ratio χ2/df to evaluate the appropriateness of the model (Schermelleh-Engel et al., Reference Schermelleh-Engel, Moosbrugger and Muller2003). The measures based on model comparisons (GFI and CFI) should be high to be indicative of a good model fit (Hu & Bentler, Reference Hu and Bentler1999; Schermelleh-Engel et al., Reference Schermelleh-Engel, Moosbrugger and Muller2003). It is suggested that a good fit implies values of GFI between .90 and .95 and values of CFI between .95 and .97 (Schermelleh-Engel et al., Reference Schermelleh-Engel, Moosbrugger and Muller2003); 4) Evidence based on relations to other variables: this was tested by correlating the group perceptions scale with the life satisfaction. The relationship between group perceptions, individual characteristics (age, gender) and placement length was tested in order to identify potential differences on this construct according to these variables; 5) Reliability evidences were tested calculating the Cronbach’s Alpha.
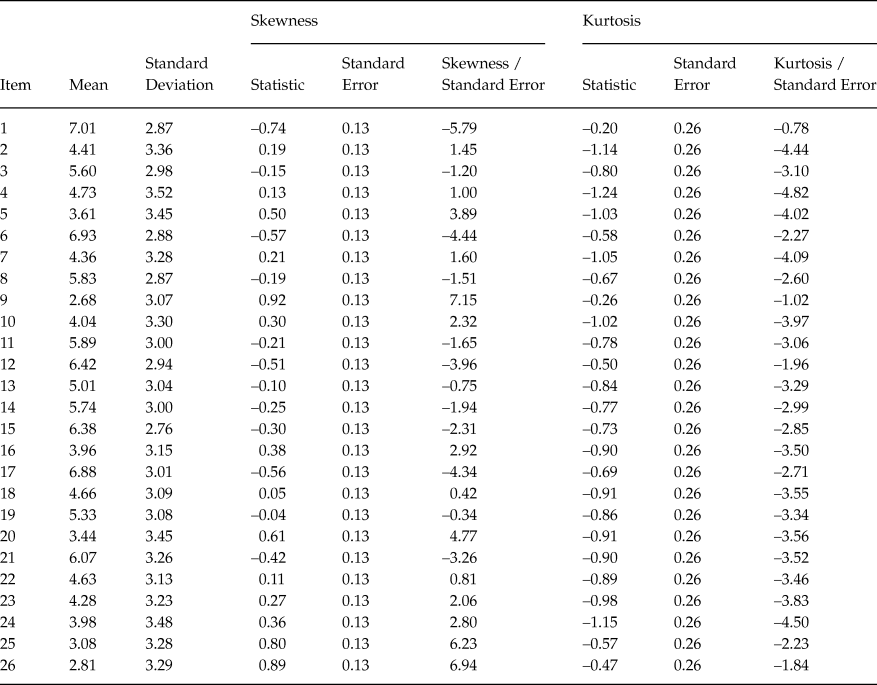
Previous the statistical analysis on the internal structure and the relationship with other variables, a descriptive analysis was performed in order to identify missing values and to obtain information about the symmetry of the distribution. This analysis revealed that there were no items with more than 5% of missing data. As such, given the small number of missing values, its imputation would be suitable (those missing values were replaced by mean). The analysis of the ratio Skewness/Std Error (Table 1) revealed that there were ten items (1, 5, 6, 9, 12, 17, 20, 21, 25 and 26) with values not too close to the range –2 and 2. However, it was found that the absolute values of skewness were lower than 3 which can be considered as non-problematic in terms of distribution (Kline, Reference Kline2005).
Descriptive statistics - Means, Standard Deviation, Skewness and Kurtosis

Results
Validity Evidences
Evidence based on test content
Five experts analyzed the items’ content of the 30-item version in order to provide feedback about the relevance of each item to measure the group perceptions with youth in residential care. All items were considered relevant by four experts; however, there were 14 items that were considered non-relevant by one of those experts. Since more than half of these experts perceive the items as relevant some degree of content validity exists (Lawshe, Reference Lawshe1975), which justifies retaining all items for further analysis.
Evidence based on response processes
This type of validity evidence was assessed with a spoken discussion with youth in residential care in order to determine whether these youth understand the questionnaire items and if they have some suggestions of reformulation. From this discussion, four adjectives were removed from the scale (i.e., “Mean” and “Unfriendly” that were adapted from Tarrant, Reference Tarrant2002, and “Beggars” and “Homosexuals” which came from focus groups), since the youth considered that they were not clear in terms of meaning or that they were not adequate to describe the group. The final version with 26 items was then tested in terms of further validity evidences.
Evidence based on internal structure
The construct validity was tested with a holdout method for cross-validation randomizing the full sample of 360 adolescents into two sub-samples (through the random sample of cases, approximately 50% of the cases): Sample A - 188 participants; Sample B - 172. A Principal Components Analysis was applied in the Sample A, and a Confirmatory Factor Analysis was applied in the Sample B with Maximum Likelihood estimation method.
Principal Components Analysis (PCA)
The assumptions for PCA (Varimax rotation) were tested and assured: KMO = 0.85 and Bartlett's Test of Sphericity significant (p < .001). Initially, a structure with five components was found (variance explained = 60.45%), though, 6 items revealed cross-loadings (items: 3 - Popular, 18 - Boring, 19 - Quiet, 20-Poor thing, 22- Shy and 23 - Ignorant). These cross-loadings mean that the item loads at least .32 on more than one factor (Costello & Osborne, Reference Costello and Osborne2005), and the difference between the primary loading and the secondary one is smaller than .20 (Nunnally & Bernstein, Reference Nunnally and Bernstein1994).
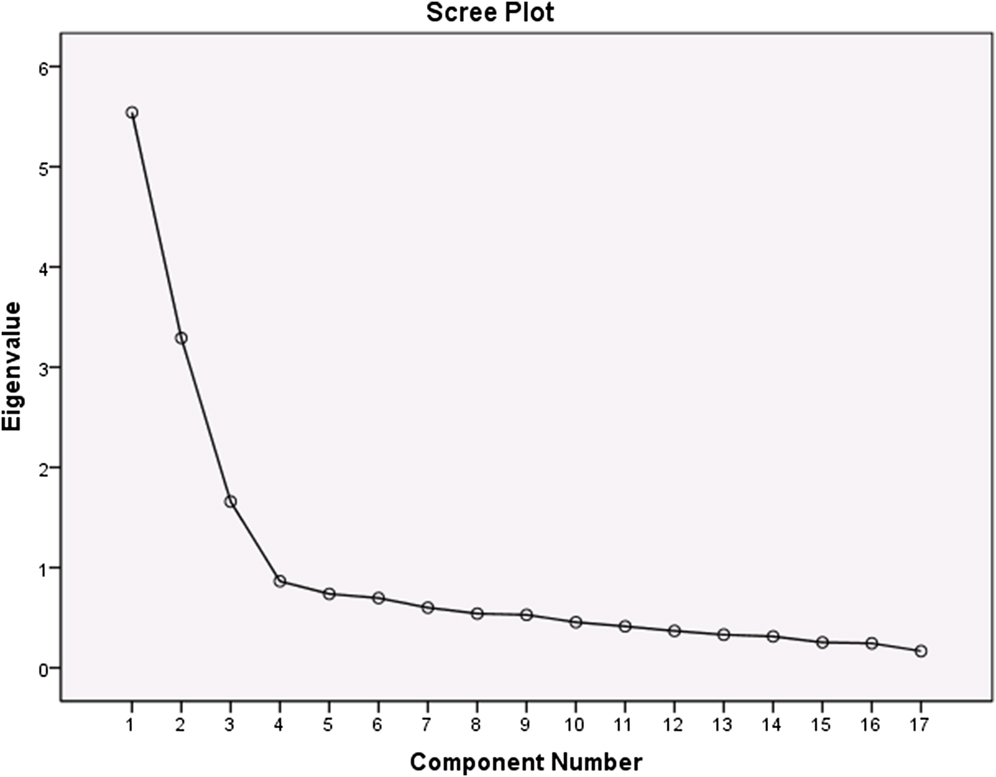
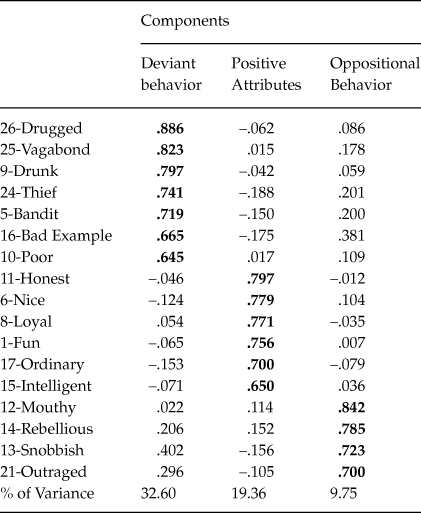
These items were excluded from the analysis and a new PCA shown a new item revealing cross-loadings (4 - Fugitives), this item was excluded and a new PCA was performed. This new exploratory analysis revealed another item with cross-loadings (7 - Not reliable). A new PCA was performed and a four dimensional structure was found. The fourth dimension includes merely the item 2 - Unfashionable, and for this reason, the item was excluded. As such, a new data analysis was performed and a three dimensional structure was clearly found (as it can be seen on the scree plot; Figure 1): Deviant behavior, Positive Attributes and Oppositional Behavior, explaining 62% of variance (Table 2).
Scree plot from the Principal Component Analysis.

Final structure from Principal Components Analysis

Confirmatory Factor Analysis (CFA)
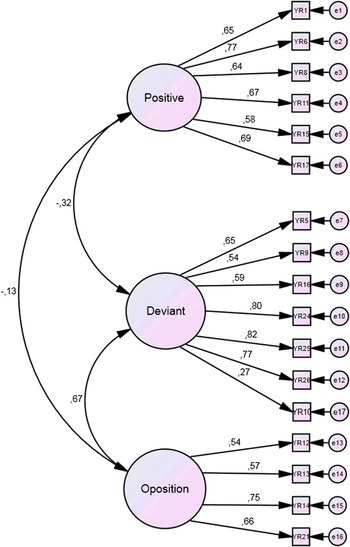
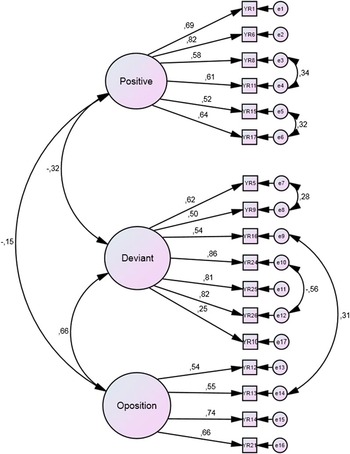
The CFA was performed in the subsample B and the fit statistics are summarized on Figure 2 and 3. Results revealed that the model from the PCA can be considered appropriate since it was obtained a ratio χ2/df close to 2, however the values of GFI and CFI were lower than the thumb rules previous described in the procedures of data analysis. As such, a second model was tested allowing specific correlations errors, based on the high modifications indices and on the theoretical content of those items. The correlations were allowed between items from the same dimension, except on the item 13 and 16, which are from Deviant and Oppositional dimensions. However, we allowed this correlation since these two dimensions reflect negative attributes that can be theoretically related. As such, results from the fit statistics reveal that this second model presents a better fit.
Model 1 - CFA of the structure from the PCA.
Note: χ2/df = 1.96, p < .001; GFI = .86; CFI = .89; RMSEA = .075.

Model 2 - CFA with correlations allowed.
Note: χ2/df = 1.54, p < .001; GFI = .90; CFI = .95; RMSEA = .050.

Evidence based on relations to other variables
This type of validity evidences was tested with a correlation with life satisfaction (N = 340), and a higher correlation was found between Positive Attributes and Life Satisfaction (r = .47, p < .001) than between Life Satisfaction and Deviant behavior (r = –.18, p < .01) or Oppositional Behavior (r = –.18, p < .01). Considering the youth’s characteristics, the results revealed a positive and significant correlation between the dimension of Deviant behavior and youth’s age (r = .119, p < .05), suggesting that as the youth’s age increases, the group in care is perceived as more deviant. However, the magnitude of this correlation is weak. Also, significant gender differences were found merely for Deviant Behavior (t(358) = –3.62, p < .001; d = .38, 95% CI [–9.97, 2.94]), with young males (N = 197; M = 27.08, SD = 17.32) reporting higher scores on this dimension than females (N = 163; M = 20.62, SD = 16.30). Finally, no significant correlations were found between group perceptions and the length of placement in the residential setting.
Reliability
The reliability analysis revealed adequate values of Cronbach's alpha regarding the three dimensions: Deviant Behavior (.87), Positive Attributes (.84), and Oppositional Behavior (.77).
Discussion
This study aimed to present a new tool that can be used to assess youth’s perceptions about their group in residential care, and the results provided interesting evidences of validity and reliability. The exploratory factor analysis revealed a three component structure which includes one component consisting of positive attributes and two components containing negative features (reflecting deviant and oppositional behaviors). This result add information about the latent content of those attributes, more than merely the dichotomy of positive versus negative evaluation, previous described in the literature. This structure explained 62% of the variance and it replicated eight items (i.e., Fun, Loyal, Intelligent, Ordinary, Nice, Honest, Snobbish and Rebellious) which were adapted from the previous work of Tarrant (Reference Tarrant2002), and nine from the focus groups with youth in residential care (i.e., Drugged, Drunk, Vagabond, Thief, Bandit, Bad Example, Poor, Outraged and Mouthy). This result strengthens the instrument’s potential to be used with different samples of youth, across a diverse range of developmental contexts, since it includes items previously used with normative samples of adolescents, but adds specificities regarding the context of youth in residential care. By analyzing the items from the focus groups with youth in residential care, we found that these items are closely related with data from the literature in terms of its content. In fact, the studies advance that this group of children and adolescents tends to present more emotional and/or behavioral problems when compared with normative youth (e.g., Vorria, Wolkind, Rutter, Pickles, & Hobsbaum, Reference Vorria, Wolkind, Rutter, Pickles and Hobsbaum1998) or with youth in another context of out-of-home care (e.g., Fernández-Molina, Del Valle, Fuentes, Bernedo, & Bravo, Reference Fernández-Molina, Del Valle, Fuentes, Bernedo and Bravo2011). As such, this scale reflects two dimensions containing attributes that are congruent with these difficulties (e.g., deviant and oppositional behaviors), highlighted in the studies with youth in residential care.
The results from the Confirmatory Factor Analysis revealed good values of fit in terms of the measures based on model comparisons (GFI and CFI) as well as the descriptive measure of overall model fit, suggesting that this three dimensional model is adequate in terms of group perceptions assessment with these adolescents. Furthermore, the reliability data revealed appropriate values of Cronbach’s alpha for the three components, and the strength of this scale was reinforced by a positive correlation between the positive attributes and life satisfaction and a negative association between the deviant and oppositional behavior dimensions and the life satisfaction. These results are congruent with the theoretical assumptions that reveal that a positive perception about the group is associated with higher well-being and better social development (Tarrant, Reference Tarrant2002), as well as with the literature on self-representations, suggesting that a positive perception about the self is related with higher life satisfaction (Diener & Diener, Reference Diener and Diener1995). In fact, even considering that these youths did not deliberately become part of the group in residential care (e.g., as it can happen in peer groups at school or in sports groups), the result suggest that the more they perceive the group as having positive characteristics, the more they feel satisfied with their life.
Furthermore, the potential of this scale was strengthened by the results found on gender differences, since the young males reported higher scores on deviant dimension compared with young females (with a median effect size). In fact, this result can be framed in the literature that report that boys tend to reveal more externalizing problems (e.g., Roussos et al., Reference Roussos, Francis, Zoubou, Kiprianos, Prokopiou and Richardson2001), which can explain the males’ perception about their group as revealing more attributes related with a deviant behavior. Additionally, a positive and significant correlation between the deviant dimension and youth’s age is congruent with results from the literature that show that older youth tend to have more problems in terms of their functioning (Roussos et al., Reference Roussos, Francis, Zoubou, Kiprianos, Prokopiou and Richardson2001).
In sum, these evidences of validity and reliability suggest the usefulness and relevance of this scale for further studies with this population of young people.
The present study aimed to present a measure of group perceptions focused on a vulnerable social group. This measure was developed from the previous literature and from the youth’s discourse in residential care which would allow us a more accurate application and data interpretation, considering the specificities of this context. Although these results are relevant and interesting, it is important to note some limitations. There was no assessment of the youth’s perceptions about the attributes valence (i.e., positive or negative). As such, when these items are considered as a positive dimension in the present manuscript, it is purely bearing in mind the content of those attributes. Despite these limitations, given the instrument’s appropriate psychometric characteristics that were found in the present study, these results revealed the potential of this instrument to be used with these adolescents.
This work is funded by a doctoral grant for the first author, from the Portuguese Foundation for Science and Technology – (Reference FRH/BD/77554/2011). The authors thank all institutions that accepted to participate and especially all adolescents who took part of this work. The authors would like to thank the text review provided by Carla Sofia Silva.
Annex 1
The Group Perceptions Scale
(Version for youth in residential care)
Below you will find a list of adjectives that can describe the group of youth in residential care. Please, think about the group that you belong (i.e., the group of youth in your institution), and answer how well these adjectives describe your group.
For each adjective, we ask you to answer using the scale from 0 (the adjective is a bad/poor description of the group) to 10 (the adjective is a good description of the group).