Introduction
Nepalese agricultural farms contain living collections of different crop species, including rare and threatened species that not only allow for the continuous evolutionary process, but also help to preserve the local knowledge associated with their production and use. Thus, rural farmers conserve a wide range of crop plants through active management for their livelihood and food security, and maintain the modified ecosystems (i.e., agro-ecosystems) through their use. Different drivers give impetus to the cultivation of crop species. These include: daily subsistence needs, culinary diversification and the requirements of cultural festivals. The cultural significance of the crops, with their multiple uses by rural communities, determines the selection criteria of crops to grow on-farm and maintain crop diversity in the farmer's fieldReference Bellon 1 .
Nepal is home to more than 90 different ethnic groups, each with their specific food habits. A range of crops is grown in subsistence agriculture systems by each ethnic group to provide for the specific food preferences of each group. Therefore, in the culturally diverse farming population, the variation in food habits would be expected to maintain a diversified cropping system in the farmers’ fields. However, studies on crop diversity in farmers' fields in Nepal have been limited to a few crops such as riceReference Bajracharya, Steele, Witcombe, Tiwari, Sthapit, Jarvis and Sthapit 2 (Oryza sativa); taroReference Rijal, Sthapit, Rana, Jarvis and Sthapit 3 (Colocasia esculenta); finger milletReference Tiwari, Joshi, Rana, Baniya, Bajracharya, Khatiwada, Tiwari, Upadhyay, Sthapit, Joshi and Sthapit 4 (Elusine coracana) and buckwheatReference Bajracharya, Tiwari, Pandey, Baniya and Sthapit 5 (Fagopyrum tartaricum).
Recent studies in Nepal and other countries have mainly focused on home garden agrobiodiversityReference Wezel and Bender 6 – Reference Perrault-Archambault and Comes 10 without considering the importance of other socio-cultural factors in agrobiodiversity management. Therefore, crop diversity studies were conducted in central Nepal with the aim to investigate: (1) the distribution of crop diversity across the production domains at the household level, and (2) the factors that account for the variation in crop diversity. Surveys were conducted first in 2004 and again in 2010, using a more refined survey questionnaire, with no significant differences recorded between survey results. Therefore, the results presented in this paper are from the 2010 survey only.
Study Area
Jutpani Village Development Committee (VDC) in the Chitwan district of central Nepal was selected for a detailed study because of its predominantly subsistence agriculture, diversity of land use, ethnic diversity, diversity of economic well-being and mixed farming systems. This VDC experiences three distinct seasons: rainy (15 June–15 October), winter (15 October–15 February) and summer (15 February–15 June). In the study area, the land-use types (ecosystems/production domains) are locally classified into upland, Tandikhet lowland and home garden, based on moisture regime, fertility and distance from the home. The moisture and fertility levels are comparatively higher in lowland then decrease in Tandikhet and upland.
Upland is an area with no irrigation facilities. This type of land has poor moisture-holding capacity and farmers use larger quantities of compost fertilizer compared to other production domains. Major crops grown in this area are maize (Zea mays), lentil (Lens esculenta), rapeseed (Brassica campestris var toria), and a few farmers also grow finger millet and buckwheat. Farmers in the area plant maize in the rainy season followed by rapeseed/lentil in winter, and maize in summer. Tandikhet is irrigated land, either by pump-sets (a machine to pump up the underground water), boring or kulo (kulo is a traditional irrigation system maintained and managed by farmers' groups). Tandikhet is a well-drained area, has low soil fertility and poor moisture conditions compared to lowland. In Tandikhet farmers use more compost fertilizer compared to lowland. Rice, wheat, maize, rapeseed, lentil, potato and pumpkins are the major crops grown in Tandikhet. The main cropping system in Tandikhet is rice in the rainy season followed by rapeseed/lentil in winter and then maize in the summer. The lowland area is submerged with water during the monsoon season and drained in the summer, and contains predominantly sandy loam soil. Lowland is more moist and fertile than Tandikhet and upland production domains. Farmers use less compost fertilizer in this type of land. Major crops grown are rice, maize, rapeseed, lentil and pumpkin (Cucurbita pepo). The main cropping pattern adopted in the lowland production domain is rice/lentil in the rainy season followed by wheat in winter and then maize in the summer season. Both Tandikhet and lowland farmers practice rice-based cropping patterns (rice is grown every year but other crops in rotation are changed), whereas upland farmers practice a maize-based cropping pattern in which maize is grown every year but other crops in rotation are changed. Farmers practiced relay cropping of lentil with rice (lentil is broadcasted inside the rice field 20–25 days before rice harvesting) and mixed cropping with rapeseed (lentil and rapeseed are mixed and broadcast in field), or sole cropping (growing individual crops at a time) of rapeseed or lentil in lowland and in Tandikhet. Similarly, they practiced row intercropping of potato (Solanum tuberosum), wheat and radish (Raphanus sativus), and mixed cropping of maize, pumpkin and cowpea (Vigna unguiculata) in upland and Tandikhet. Each of these production domains/land-use types can be found in a small area; therefore, individual household may have lands that are representative of two or more types of agro-ecosystems.
A home garden is a permanently managed small area around the house, where farmers grow fruits and vegetables for household consumption and sometimes for the market. Of the total households in the VDC, every household has a home garden around their home. Of the total population in the VDC, 90% of households had more than one production domain. In this study area, the average land holding and home garden sizes were 0.5 11 and 0.034 ha, respectively. People in the study site are broadly classified into Indo-Aryan (they are people with Indian origin and they are influenced by North-Indian culture) and Tibeto-Burmans (they are people with Tibetan origin and they are influenced by Tibetan culture) ethnic groups. In this study, religion was considered an important factor in the analysis because, depending on their religion, people prepare different foods for daily use and for festivals. This affects the choice of crops to be grown on their farm. People in the area are either Hindu (82%) or Buddhist (18%).
Research Methods
An intensive survey of 134 households (5% of total households) was carried using a semi-structured questionnaire. Well-being ranking, focus group discussions and key informant interviews were used to validate and gather more information. Five key informants from each ward (a ward is the smallest political unit of the VDC, one VDC has nine wards) were invited to identify the resource-rich and resource-poor households. The selected key informants are identified as respected persons in the society. They were active in their community and knowledgeable on farming practices. Key informants divided the total households of the village into resource-rich (n=923 households) and resource-poor (n=1757 households) groups based on criteria such as size of land holding, number of livestock, food sufficiency, bank balance (if known), credit history, off-farm income and house, shop and/or land ownership in the city areas.
Farmers with land size more than 0.5 ha (1 ha=30 katha), one buffalo, two goats and three chickens were categorized as resource-rich. Farmers were also considered rich if they could not support year-round food requirements from their own production but had off-farm incomes (shop, governmental or non-governmental jobs) and could buy enough food from neighbors or from other market sources. Here, a market is considered any place where buying and selling occur. On the other hand, farmers with large land holdings (>0.5 ha) with or without farm machines (tractors, threshers and so on) but with bank loans, which they were unable to repay, were categorized as resource-poor farmers. In rural settings, farmers having enough bank balance are considered rich, although this is difficult to measure, but key informants subjectively considered people based on their social status and income sources. Also, farmers who could not maintain their living for more than 12 months from their own production and earning were categorized as resource-poor.
Households from each wealth stratum within the list compiled by the key informants were selected by random sampling. Random sampling was carried by using the lottery method, so that each household had an equal chance of being selected for a survey interview. Before carrying out the actual household survey, questionnaires were tested and then adjusted to confirm that requisite data could be captured. Farmers’ participation was voluntary in the focus group discussion, which was guided by a short checklist of the crops grown in that area and the crop characteristics. The vernacular names of the crops were identified, referring to the International Development Research Centre 12 glossary as well as utilizing the services of an expert from the Institute of Agriculture and Animal Sciences (IAAS) located in the Chitwan district.
Descriptive Unit and Scoring System
Crop diversity in this study is calculated by counting the number of crops cultivated by each farmer in the previous (last) year. Each crop was given one score. Crops were defined according to the farmer's perception, which does not always correspond with the scientific classification. For example, vegetables belonging to the same species are common in the genus Brassica but farmers defined them as different crops (e.g., cauliflower and cabbage are different as perceived by farmers, and given one score for each) but different varieties within a crop were defined as same crop (e.g., different types of lettuces or beans that are grown in the study area were defined as only lettuce or beans). Individual households, social and ethnic groups, and production domains securing high scores in crop counting are defined by having comparatively high crop diversity. Data were analyzed using the ‘R’ program 13 .
Findings
Physical characteristics
Jutpani VDC covers 3863 ha. Of the total area, 2537 ha is forest, 1202 ha is cultivated area, and the rest is covered with grassland and river banks 14 . Of the total cultivated area, only 500 ha are irrigated 14 . The production potential of the Jutpani VDC is considered high. In the study site, rain-fed areas (areas that depend on rain water for cultivation) are decreasing with the extension of the kulo irrigation system and installation of groundwater pumping systems, which influence the farmer's choice of crops.
Economic characteristics
Based on the farmer's criteria of well-being, 34% of the households were classified as resource-rich and 66% as resource-poor. Thus, the majority had smaller land and livestock holdings, and limited off-farm income activities and savings. Most of the respondents had one production domain and at least a few head of livestock.
Crop diversity
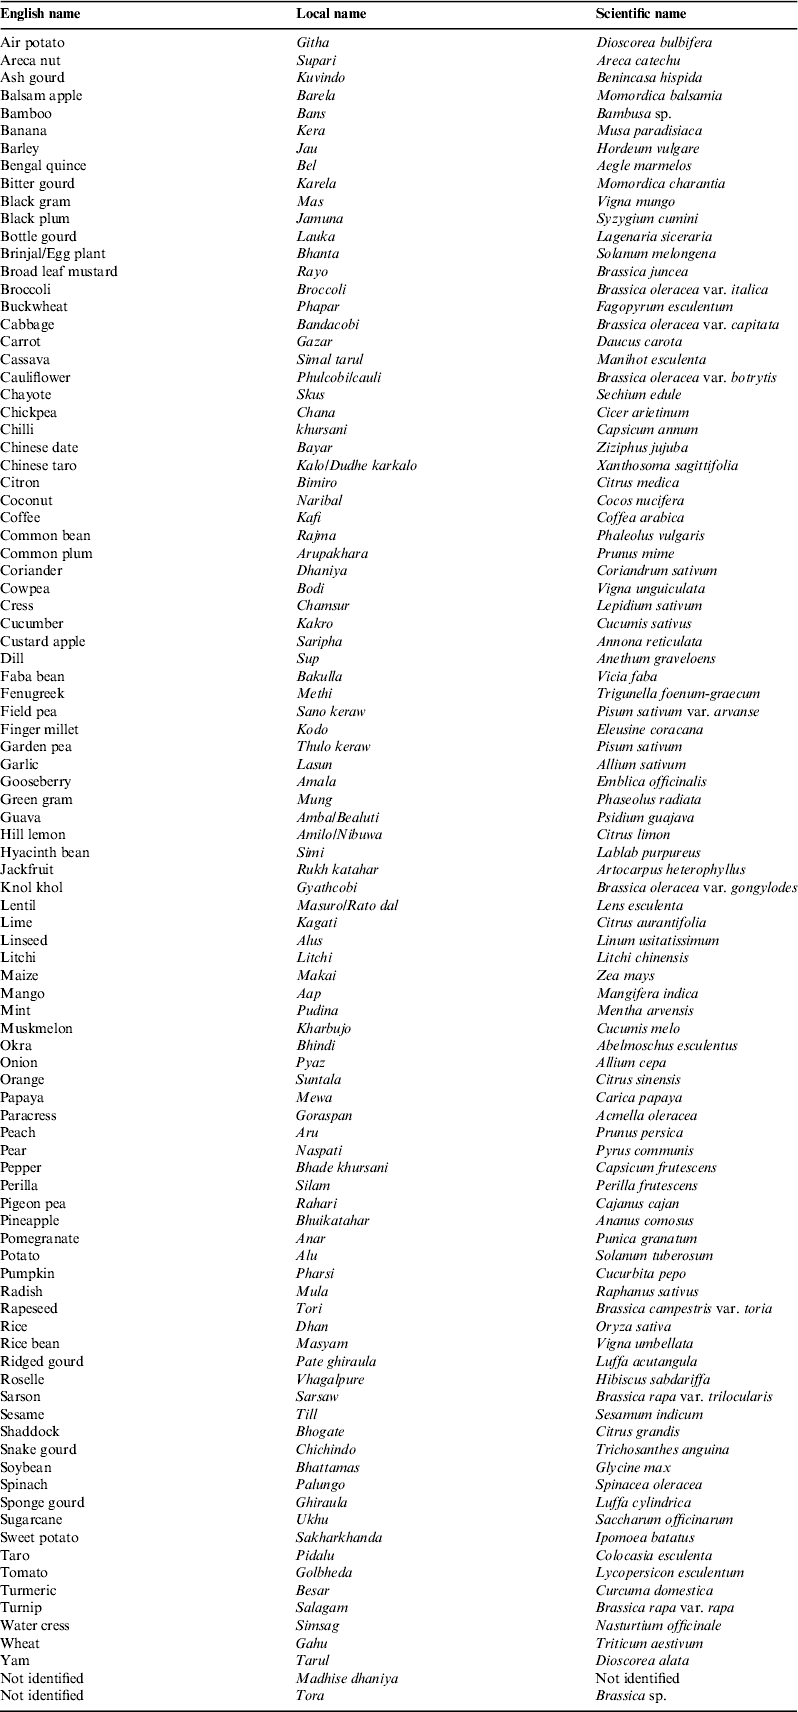
A total of 96 crops were grown in the area (Appendix 1) with an average of 26 crops per household. The number of cultivated crops per farm varied from 11 to 45. A total of 78 crops were grown in home gardens, 31 in Tandikhet, 16 in upland and 16 in lowland. The average number of crops grown in each production domain per household was 19 in the home garden, 6 in Tandikhet and less than one in upland and lowland. However, upland had a lower range of crops per household compared to lowland, with ranges of 0–7 and 0–10, respectively.
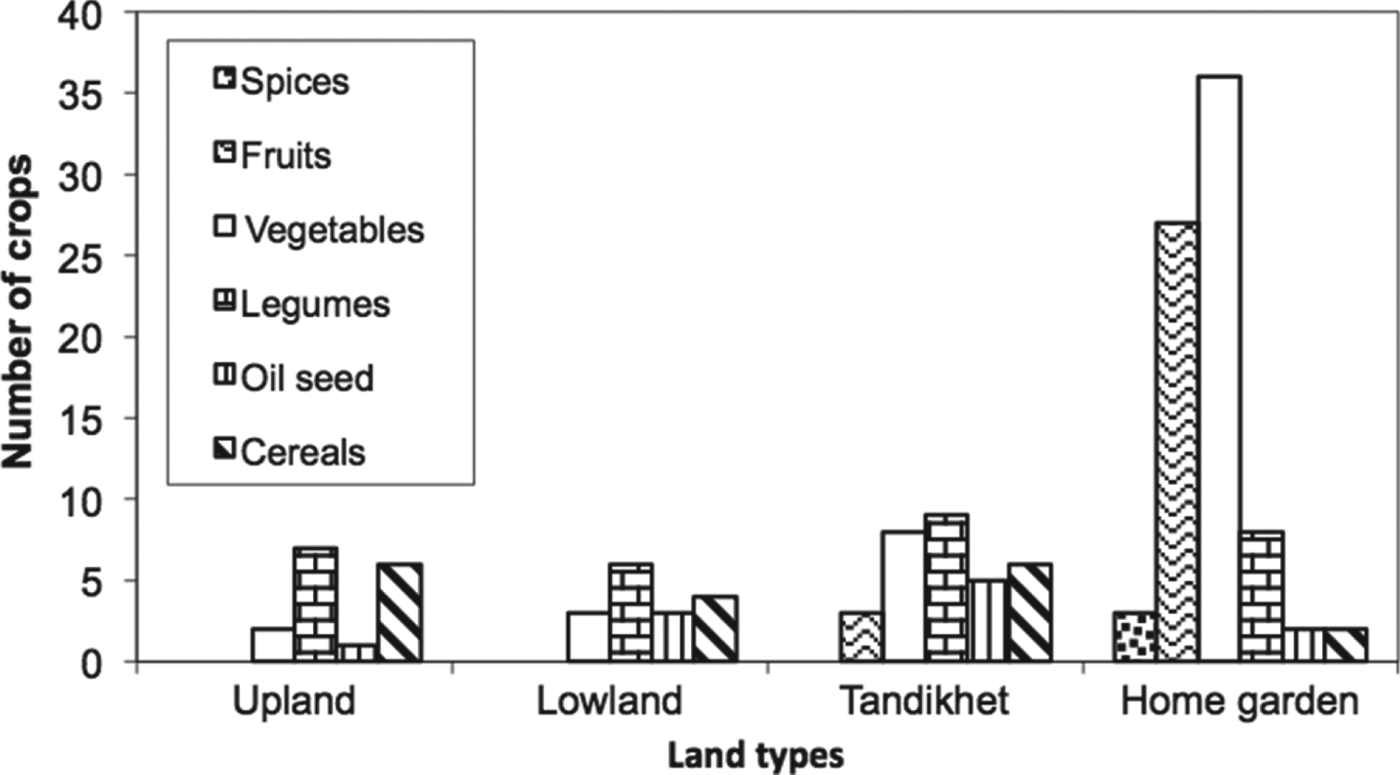
In the home gardens, the relative frequencies of different types of crops are represented as vegetable crops (46%), fruits (35%) and legumes (10%). Similarly, oil seeds and cereal crops accounted for 4 and 3% of the total crops grown in home gardens, respectively. In the case of Tandikhet, legumes (29%), vegetables (26%), cereals (19%) and oilseeds (6%) were the most commonly encountered crop groups. In the lowland, legumes (38%), cereals (25%) and oilseeds (19%) were the crop groups most commonly grown. In the upland areas, legumes (44%) and cereals (38%) were higher in frequency but vegetables (13%) and oilseeds (6%) were less encountered crop groups. Spices were only grown in home gardens. Fruits were not grown at all in upland and lowland areas (Fig. 1).
Number of crops grown in various land types in Jutpani Village Development Committee (VDC), Chitwan.

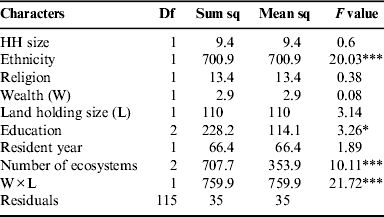
To understand the factors accounting for the variation in the diversity of cultivated crops, analysis of variance (ANOVA) was carried out for the household characters, describing total crop diversity (total number of crops grown) as the dependent variables and other factors such as ethnicity, religion of the household, number of ecosystems/production domains available, size of cultivated land area, sex of the household decision maker in crop production, education of the household decision maker, and many others as the independent variables. The variables that describe most adequately the total number of crops grown are presented in Table 1.
Analysis of variance (ANOVA) for the household (HH) characters describing crop diversity.

Significance level: ‘***’ 0.001 and ‘*’ 0.05.
Crop diversity on farm was affected by ethnicity, level of education of the decision maker in the household, number of ecosystems, and the interaction between wealth strata (well-being) and size of land holdings. Further analysis showed that Indo-Aryans maintained higher crop diversity compared to Tibeto-Burmans (Fig. 2A). Also farmers with a higher education level (above high school education) maintained higher crop diversity in their farm compared to illiterate farmers. Farmers having three different production domains had a significantly higher number of crops compared to those utilizing one or two production domains/land-use types (Fig. 2B).
Comparing crop diversity (Tot Crops) between (A) Indo-Aryan (1) and Tibeto-Burman (2) ethnic groups, and (B) among farmers having one (1), two (2) or three (3) different ecosystems. Different letters show a significant difference at 0.001.

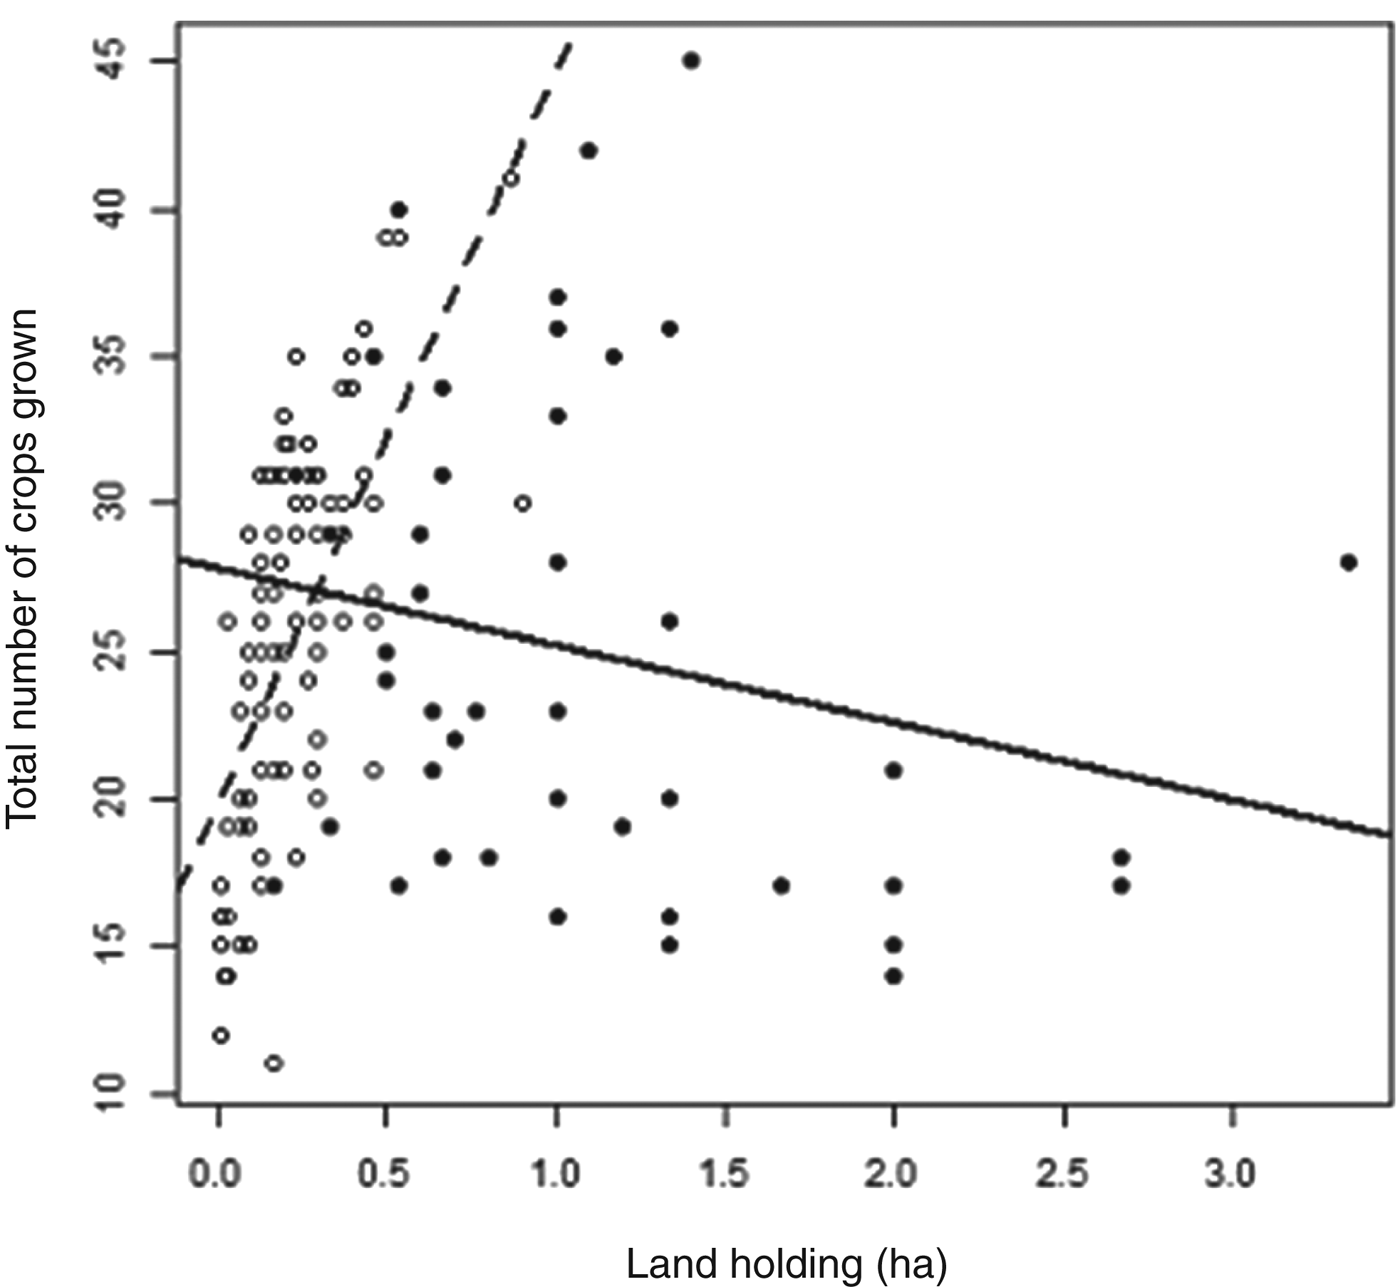
Statistical analysis shows that among the resource-poor people the crop diversity increased with increasing land size, but for resource-rich people increase in cultivated land size decreased the number of crops on their farm (Fig. 3).
Interactions between wealth (W) and size of land holding (L) for total number of crops grown. Empty circles with dotted line represent resource-poor and filled circles with solid line represent resource-rich farmers.

Discussion
Our study demonstrates that the traditional home garden maintains the highest number of crops and exists as a permanently managed area around the house where farmers plant the crop of interest either in a small area or in larger numbers. If the crop performance in the home garden is good, then the farmer tends to grow that crop in a large area in other production domains. Therefore, the home garden functions as a performance trial area for the individual household. Furthermore, when crops decline in use value they are also limited to a small area such as home gardens. Crops with reduced use value are maintained in the home garden because of their religious and cultural importance, otherwise they would be discontinued from the farmer's field. For example, barley (Hordeum vulgare) and sesame (Sesamum indicum) are each used to make two different food items compared to more than ten different food items from rice, maize and wheat (Triticum aestivum)Reference Pandey 15 . The lower use/food value of the crops limits their cultivation to mainly in the home gardens, but they continue to be grown because of their use. Also, farmers grow perennial fruit trees mainly in the home gardens. Growing perennial fruit trees in upland or Tandikhet hinders land preparation for crop cultivation, shades field crops and harbors birds that negatively affect total food production.
The home garden is the only area where farmers, for convenient access, grow most of their vegetables and all of the spices crops. Farmers grow them near the kitchens, i.e., in the home garden, which gives them easy access and saves time for those involved in kitchen activities. After the home garden, Tandikhet receives the higher number of crops because of the extension of irrigation infrastructure, which supports production of a greater diversity of crops (including rice). Nevertheless, Tandikhet is mainly used for cereals and oil seed crops along with a few vegetables but no fruit trees. The lack of irrigation in upland and waterlogged soil in lowland limits the growth of many crops in those environments. Therefore, home gardens support higher crop species compared to other ecosystems. This result corresponds with the results of previous studies showing that the home gardens are continuously cultivated with accumulation of plant speciesReference Coomes and Ban 7 – Reference Pandey, Rai, Singh and Singh 9 , which makes for the highest plant diversity compared to other cultivated fields.
Among the household characteristics, statistical analysis showed that the number of ecosystems (production domains), ethnicity and interaction between resource-richness (wealth; W) and size of land holding (L) are the strongest determinants of number of crops grown or crop diversity on a farmer's field. This study did not support the concept of a primary role for land size alone in determining crop diversity, which was considered one of the major determining factors of crop diversity in a previous studyReference Benin, Smale, Pender, Gebremedhin and Ehui 16 . The analysis did show that the number of crops grown on-farm is greater for resource-poor farmers for which the number of crops on farms increases as the land size increases. Among resource-rich farmers, when the land size increased the total number of crops cultivated on farm decreased. This is because rich farmers, having large land size, are cultivating few crops on a large scale, focusing on crop management and market demand. Within the resource-poor group, the number of crops grown increases as the land size increases because they try to meet their food demand, maximizing the use of their limited land area. But, when land area is very small the resource-poor are not interested in managing the available land area because they are committed to working for wages on other farms in order to survive. As the disparity between rich and poor continues to increase, above a certain land size poor farmers maintain higher crop diversity compared to rich farmers. This is illustrated in Fig. 3.
Farmers with three different production domains have higher crop diversity than those having one (home garden) or two (Tandikhet and home garden, or upland and home garden) production areas. Farmers with three different production domains are always included with lowland compared to farmers having one or two production domains. The lowland area with waterlogged conditions provides a different environment for the cultivation of lowland rice along with soybean (Glycine max), rice-bean (Vigna umbellata) and black gram (Vigna mungo) in the rice field bunds. The diverse edaphic conditions or environmental heterogeneity support a collection of various crops in different stages and successionsReference Coomes and Ban 7 , Reference Van Dusen 17 . Therefore, in this study farmers with one or two ecosystems have lower crop diversity than farmers with three ecosystems. Farmers with access to a higher number of different ecosystems that provide distinct environments are able to grow a greater variety of crop species on their farm.
Educated people usually travel to different places within the country and abroad, and they trial novel crops encountered during travel for use on the farm. Educated farmers are also knowledgeable about the nutritional value of various crops, which may have promoted collection of diverse plants on their farms. Further, the statistical relationship shows that ethnicity is an important factor in determining crop diversity. Indo-Aryans have a higher mean crop diversity than Tibeto-Burmans (28 crops per farm versus 23 crops). The study in this area showed that several minor ethnic groups within Indo-Aryans follow more festivals with a variety of foods compared to the Tibeto-Burmans groupReference Pandey 15 . Since the total number of different food items and dishes prepared is higher in the Indo-Aryan group compared to the Tibeto-Burman group, this encourages them to grow more crops on their farm within subsistence agriculture. The festivals and different cultural practices that diverse ethnic groups follow in the study area provide an incentive for the continuous planting of different crops in the farmer's fieldReference Pandey 15 . The result concurs with the pervious study, which concluded that ethnicity is one of the determining factors of on-farm crop diversityReference Perrault-Archambault and Comes 10 .
Conclusions
The home garden provides a continuous supply of dietary needs in a subsistence farming system. It plays a vital role of receiving crops from outside for the first time and also the last resort for many crops when their use value decreases. And also in terms of access for daily use of leafy vegetables, legumes and spices, home gardens maintains higher crop diversity compared to Tandikhet, lowland and upland. However, total crop diversity in farmers’ fields is tightly linked with social, cultural and economic dimensions of the farm households. They are the important factors for building on-farm biodiversity. Hence, it is important to have an understanding of farm management, and associated cultural and religious practices, while planning crop diversity management programs. Finally, understanding crop diversity status at the household level and the factors affecting it supports assessment of the pool of crop germplasm maintained by farmers in the specific area. This information helps to locate specific crops when needed, and to develop and implement crop biodiversity management plans.
Acknowledgements
Norwegian Agency for Development Cooperation (NORAD) is acknowledged for funding the study in 2004. The author also thanks Mr Peter Brown from Central Queensland University for correction of English.
Crops grown in the study area.