

1. Introduction
Language’s variability and constant change have always been key elements of the sociopragmatic organization of human cultural practice. People use language in speech acts for various purposes in everyday life. Speech acts therefore have practical consequences in the lifeworld (e.g., a legal judgment), but also carry culturally complex social meanings. This includes regional features often linked to social evaluations, such as a person’s origin, social status, or intelligence (see for example Heblich et al., Reference Heblich, Lameli and Riener2015; Kristiansen, Reference Kristiansen2009). Taken together, language variation and the evaluation thereof contribute significantly to the structuring of cultural practice, for example with regard to the negotiation of group membership based on linguistic (dis)similarity (Purschke, Reference Purschke, Evans, Benson and Stanford2018). In the German-speaking area (GSA, including mainly Germany, Austria, and parts of Switzerland),Footnote 1 these distinctions were traditionally bound to local communities, creating small-scale local dialects along a continuum. Through a combination of increased mobility, technical development, the institutionalization of standard languages, and changing sociocultural orientations, these fine-grained distinctions have gradually diminished, leading to regionally-bound intermediate varieties that combine resources from the old local dialects with influences from the standard language. Rather than disappearing, distinctions persist at a regional level, allowing people to still use them as a linguistic resource to stylize their language use and, therefore, for social positioning in interactions. These distinctions still very much govern people’s sociocultural orientation, as Falck et al. (Reference Falck, Heblich, Lameli and Südekum2012) have shown in a recent study: dialect similarity was one of the strongest predictors of people’s relocation decisions.
In this paper, we take linguistic variation in online communication as a starting point to examine how regionally-bound aspects of language use contribute to regional communication networks and large-scale spatial linguistic structures. There is ample evidence that people use regional forms in digital media, both to define social styles in interactions and to create social group membership (see for example Nguyen, Reference Nguyen2017). However, we go further and ask how regional variation helps people structure their online communications. Furthermore, we want to differentiate between different types of linguistic resources that contribute to regionally-bound communication networks, such as traditional regional languages, items of online communication, or code-switching phenomena.
We base our analyses on a large sample of anonymous online communications. While this provides ample information regarding regional variation, it does require the use of quantitative analysis methods. We turn to a very recent method from the field of computational linguistics, namely representation learning with neural networks. These models allow us to learn representations (points in a high-dimensional space represented by vectors of numbers) that concisely capture linguistic differences and similarities between entities (here: cities). These city representations allow several analyses: they can be clustered to discover larger geographic areas, which we compare to traditional dialect distinctions, but they also enable us to visualize continuous dimensions of variation, and to find region-specific (“prototypical”) words for geographic areas, ranging from individual cities to entire dialect regions. The latter allows us to pinpoint pertinent markers of (digital) regional identity.
With this combination of large-scale, quantitative methods and qualitative analysis, we hope to show that “rather than replacing traditional methods […], new techniques complement and augment existing humanities methods and facilitate traditional forms of interpretation and theory-building” (Kitchin, Reference Kitchin2014:8). We develop our approach in the following sections: in Section 1, we discuss the variationist and computational linguistic background of our study. In Section 2, we explain the methodology for our study, including the data set and technical details, before we discuss the resulting spatial linguistic structures in our data set (Section 3). Section 4 comprises a discussion of methodological and linguistic aspects of our study, including benefits and limitations of the data-driven approach.
1.1 Regional Variation in German
Variation and change in German dialects are long-standing research topics. One of the main results of classic dialectology is a number of spatial classifications of these dialects. In Map 1, we contrast two such dialect maps, one based on Wiesinger (Reference Wiesinger, Besch, Knoop, Putschke and Wiegand1983)Footnote 2 and another, more recent one by Lameli (Reference Lameli2013). While both maps share many structural division features of regional German varieties, they differ markedly in the ways they have been created. Wiesinger (Reference Wiesinger, Besch, Knoop, Putschke and Wiegand1983) used the traditional approach of defining and evaluating a comprehensive number of dialect isoglosses, from which he deduced the structural divisions. Lameli (Reference Lameli2013), on the other hand, used a sizeable database with (historical) regional variants of a number of words from all administrative districts in Germany to construct a quantitative map with dialectometric methods.
Dialect division of German. Left: according to Wiesinger (Reference Wiesinger, Besch, Knoop, Putschke and Wiegand1983), right: according to Lameli (Reference Lameli2013).
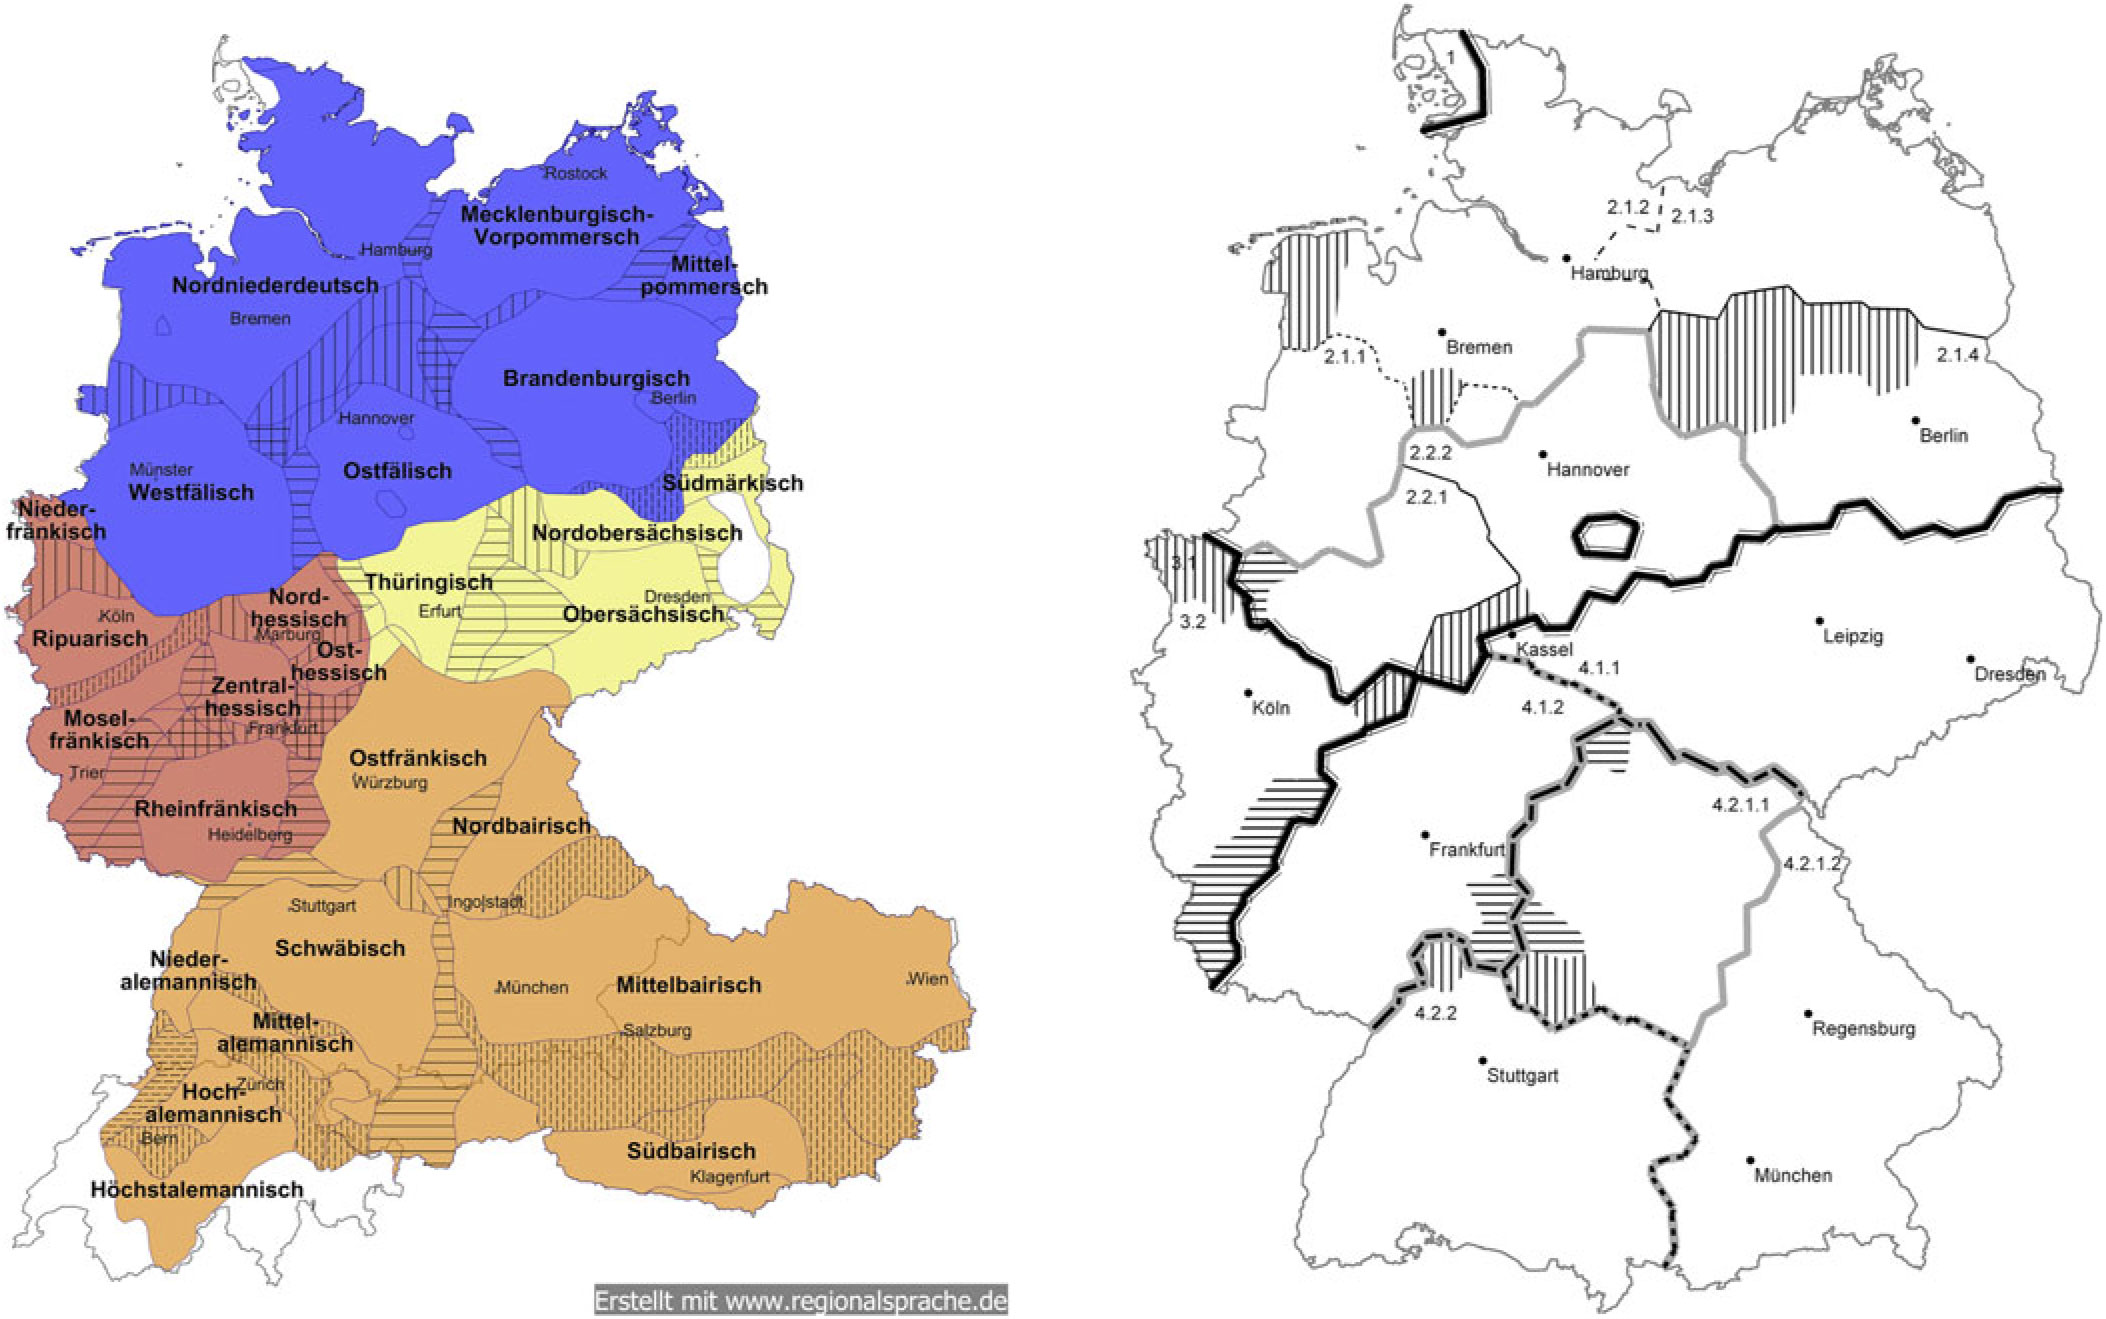
Despite these methodological differences, both maps reproduce a similar macro-structure of the German dialects, with Low German (Niederdeutsch, blue area) dominating in the north, and Upper German (Oberdeutsch, brown area) in the south. The latter is split further into a Western part that consists of Swabian (Schwäbisch) and the Alemannic dialects (Alemannisch), an Eastern part that contains the Bavarian dialects (Bairisch), and Eastern Franconian (Ostfränkisch). In between Low German and Upper German we find a band of varieties, the so-called Middle German dialects (Mitteldeutsch), which again are divided into a Western (Westmitteldeutsch, red area) and an Eastern group of varieties (Ostmitteldeutsch, yellow area). The only substantial macro-difference between the two maps is the westernmost area in the middle of Germany, which is subsumed by Western Middle German in the Wiesinger (Reference Wiesinger, Besch, Knoop, Putschke and Wiegand1983) map but shows up in the Lameli (Reference Lameli2013) map as a structurally independent macro-region he calls Historisches Westdeutsch (‘Historical Western German’). In the following, we will use a combination of these two maps as the basis for our analysis, which highlights Historical Western German as an independent macro-area as opposed to the rest of the Middle German varieties. Note that despite the discrete nature of the regions, both maps essentially depict a continuum of dialects, albeit along several dimensions. As we will see, the method we explore allows us to recover this continuum.
Over the last 20 years, German variationist linguistics has undergone substantial restructuring, with the advent of new theoretical and methodological approaches. Traditional dialect divisions are no longer of primary interest to variationist linguistics. Instead, many studies focus on the extensive interferences between the old local base dialects (‘Basisdialekte’), the standard language, and the new intermediate registers, so-called regiolects (‘Regiolekte’), which lead to the formation of complex modern regional languages (‘Regionalsprachen’; see Schmidt, Reference Schmidt, Auer and Schmidt2010) integrating all non-standard registers. Another important methodological innovation is the consideration of speakers’ perception and evaluation of variation for language dynamics and change (Purschke, Reference Purschke2011; Stoeckle, Reference Stoeckle2014).
Regarding the dynamics of spoken German, there is a substantial shift of locally-bound use of regional languages towards standard-oriented registers (Kehrein, Reference Kehrein2012). At the same time, the advent of digital media has produced online language that incorporates many aspects of oral speech (Androutsopoulos, Reference Androutsopoulos2003). Social media is dominated by informal (conceptually oral) language use (Barton & Lee, Reference Barton and Lee2013; Herring, Reference Herring, Tannen and Trester2013) that often makes use of online-specific resources like abbreviations, missing capitalizations, use of acronyms, emoji, logograms, or rebus writing (Dürscheid & Frick, Reference Dürscheid and Frick2016; Dürscheid & Stark, Reference Dürscheid, Stark, Neef and Scherer2013; Schlobinski, Reference Schlobinski2006). Another distinctive feature in online communication is the hybridization of elements from different linguistic resources to create specific writing styles and social stances (Androutsopoulos, Reference Androutsopoulos2007; Thurlow & Mroczek, Reference Thurlow and Mroczek2011). Nonetheless, regional languages have proven to be a vital resource for online communication in German (Tophinke & Ziegler, Reference Tophinke, Ziegler, Cuonz and Studler2014), especially in German-speaking Switzerland, where the Swiss-German dialects are the default written variety in digital communication for most language users (Schümann, Reference Schümann, Brigitte and Purschke2011).
Traditionally, regional variation (in German) has been captured by carefully-designed studies that map the distribution of a limited number of pertinent variables. This is true even for recent large-scale studies on regional variation in German or English that make use of a crowdsourcing approach (Leemann et al., Reference Leemann, Kolly, Schmid and Dellwo2015, Reference Leemann, Kolly, Purves, Britain and Glaser2016). However, this approach relies on a number of prerequisites, including the predefinition of variables with high discriminative power for representative sections of the variety in question. These criteria are hard to enforce with online communications. While these communications provide us with sufficient amounts of data for in-depth studies and often cover a wide range of demographics and regions, they differ thematically and stylistically from offline communication and therefore often lack any of the traditional variables used to measure and establish variation (see also the stylistic analysis in Section 4.2). Working with online communications therefore presents some methodological challenges compared to well-designed interpretation-driven variationist studies, including the composition of the corpus (e.g., noisiness, mixed modality, lack of control over social demographics; see Androutsopoulos, Reference Androutsopoulos, Mallinson, Childs and Herk2013 for a discussion). However, these data sets provide us with some unique possibilities (beyond simple volume) that allow for a data-driven analysis of language variation and change.
Advantages of online communications include their availability as directly machine-readable data, and that they represent unsupervised everyday practice rather than language use from carefully-designed experiments. These features provide the basis for new approaches to variationist analysis. For example, the large amounts of online data allow quantitative modeling and visualization, which can then be compared to a hypothesis-driven interpretation. Quantitative modeling thus serves as a complementary step for qualitative analysis, and vice versa.
In this paper, we use a data-driven approach, which does not rely on prior assumptions about the observed variables, but rather aims to uncover patterns contained in the data that we can subsequently interpret. We use a bottom-up approach for spatial structures by first learning a regionally-sensitive representation based on lexical variation at the city level, followed by clustering and visualizing the learned city-representations to discover larger regional patterns.Footnote 3
Starting from individual interactions that contribute to the overall structure of a speech community, we combine the data-driven modeling—which allows us to find patterns in the large collections of data—with an interpretation-driven analysis—which lets us contextualize and explain the patterns we discover. Or, as Kitchin (Reference Kitchin2014:8) writes: “It is one thing to identify patterns; it is another to explain them. This requires social theory and deep contextual knowledge. As such, the pattern is not the end-point but rather a starting point for additional analysis.”
Consequently, we are trying to merge the individual strengths of both computational linguistics and sociolinguistics. Under the label computational sociolinguistics, this combination fosters the idea of a shared perspective between the two disciplines, while at the same time benefitting from the body of knowledge (data-driven and interpretation-driven, respectively) they each provide. This fusion is especially important since—despite recent efforts in computational social science—both disciplines have been mostly unwitting about the respective other’s research rationale, methodological potential, and empirical limits.
1.2 Computational Sociolinguistics
The scientific fields concerned with the computational study of language are computational linguistics (CL) and natural language processing (NLP), both of which lie at the intersection of linguistics and computer science. NLP’s main focus is the development of engineering solutions to linguistic problems (e.g., Google Translate or Siri), whereas the main focus of computational linguistics is the use of computational models to learn about language. Regardless, there is a host of fascinating work in this intersection touching upon sociolinguistic topics, and several recent approaches have shown the potential of combining the two fields (Nguyen et al., Reference Nguyen, Doğruöz, Rosé and Jong2016). These works look at the correlation (and presumed causality) of socio-economic attributes with linguistic features (e.g., Bamman et al., Reference Bamman, Eisenstein and Schnoebelen2014b; Doyle, Reference Doyle2014; Eisenstein, Reference Eisenstein2013a, Reference Eisenstein2013b, Reference Eisenstein2015; Eisenstein et al., Reference Eisenstein, O’Connor, Smith and Xing2010, Reference Eisenstein, Smith and Xing2011). Most of this work has focused on lexical, and phonological aspects represented in the data.
Hovy et al. (Reference Hovy, Johannsen and Søgaard2015) and Hovy & Johannsen (Reference Hovy and Johannsen2016) have explored the use of social media as a source of variation and showed the prevalence of regional lexical variants reflected in this data as well as phonotactics in British English and standardization in German. Johannsen et al. (Reference Johannsen, Hovy and Søgaard2015) employed a quantitative approach to measure the influence of age and gender on syntactic constructions (see Cheshire, Reference Cheshire2005). Due to the inherent complexity and scale of the problem, syntactic change is hard to evaluate empirically. Their quantitative approach confirmed the hypothesis that syntax changes with age and gender, with clear differences in the preference for certain syntactic constructions (women show significantly more verbal conjunctions than men).
There is already a number of works exploring regional variation with statistical methods, from the dialectometric analyses of German and Dutch (Nerbonne & Heeringa, Reference Nerbonne and Heeringa1997, Prokić & Nerbonne, Reference Prokić and Nerbonne2008; Pröll et al., Reference Pröll, Pickl, Spettl, Elmentaler, Hundt and Schmidt2014; Szmrecsanyi, Reference Szmrecsanyi2008; Wieling et al., Reference Wieling, Nerbonne and Baayen2011) and regional patterns in the UK (Grieve et al., Reference Grieve, Speelman and Geeraerts2011) to work on regional differentiation of African American Vernacular English throughout the United States (Jones, Reference Jones2015) based on Twitter data.
Using a similar neural methodology to us, Bamman et al. (Reference Bamman, Dyer and Smith2014a) have shown how regional semantic differences for the same term between US states (e.g., the meaning of “wicked”) can be found by learning general word representations (also called embeddings) and a specific transformation for each US state. Östling & Tiedemann (Reference Östling and Tiedemann2016) have shown that neural methods can learn word representations for national languages, rather than regions, which capture typological similarities that can improve machine translation quality. Similarly, Kulkarni et al. (Reference Kulkarni, Perozzi and Skiena2016), and Rahimi et al. (Reference Rahimi, Baldwin and Cohn2017a, Reference Rahimi, Cohn and Baldwin2017b) have shown how neural models can be used to exploit regional lexical variation for the task of geolocation (i.e., locating the spatial origin of an utterance), while at the same time enabling dialectological insights.
2. Methodological Approach
2.1 Data Source
In our study, we use data from the social media app “Jodel,”Footnote 4 a mobile chat application that lets people anonymously talk to other users within a limited radius around them. The app was first published in 2014 and has seen substantial growth since its beginning. Today, Jodel has several million users in the GSA, but the company is also expanding to new markets in France, Italy, Scandinavia, Spain, and lately the United States. In our study, we restrict ourselves to the GSA.
Jodel users have anonymous accounts from which they can post anonymously and respond to other users’ messages. Posts are visible to all users within a radius of about 10 to 15 km around the user’s current location.Footnote 5 Threads are conversations initiated by an initial post, to which future interlocutors can respond. Within a thread, users can refer to each other through a deictic system referring to the order of posts (i.e., addressing previous posts/users. See Section 4.1 below). There is also the possibility to up- or downvote posts and answers. The developers constantly implement and publicly test new features, for example the use of hashtags, thematic channels, a sharing system for threads, changes to the deictic reference system, or a gallery view for images. The main audience of this service is college students, who initially used the app to discuss campus-related topics, but given the anonymity of the Jodel platform, conversations quickly expanded to (and are now dominated by) all kinds of private or even intimate topics.
The nature of Jodel and the ways it can be used by its users therefore influence the structure of our data set and the community practice we can survey in four basic ways:
a) Anonymity: Posts and threads in Jodel are anonymous, which means that topics as well as stylizations of speech include informal registers close to orality. Jodel speech is medially written, but conceptually oral (Koch & Oesterreicher, Reference Koch and Oesterreicher1985).
b) Regionality: Posts and threads in Jodel are regionally bound, due to the limited range of posts based on the user’s location. This means that the data fosters the emergence of regional user communities.
c) Demographics: Many users of the Jodel app are students, which means that the data mainly covers the language use of young adults. It also directly impacts the regional composition of the data: While the majority of students pick a college that is close to their home town, there are still many that move from Hamburg to Munich or Vienna to study (Statistisches Bundesamt, 2016). As a consequence, the data may be affected by inter-areal levelling of region-specific language use, especially in larger or more popular university cities.
d) Stylistic resources: The vast majority of posts in Jodel are written in standard German. Regional or even dialectal forms are only common in Switzerland, Austria, and more rural areas in Southern Germany. Still, users actively deploy these forms to mark regionality. Beyond that, we can expect a broad repertoire of linguistic resources that users employ to stylize their online communications.
As a result of these characteristics, the current study differs in many ways from traditional approaches to the study of language variation and change. Normally, such studies survey small groups of carefully chosen participants (in specific situations) which fulfil certain criteria regarding speech competence, age, gender, social status, and mobility. In contrast, our data set combines data from thousands of anonymous users who contribute to conversations by posting. While this allows for a broader population sample, it does relinquish some control over confounding factors. And while this might be seen as a disadvantage compared to classical sociolinguistic study designs, it can also be a decisive advantage, because our data set was not assembled based on predefined criteria (except for an initial list of locations). As a consequence, our data sample mirrors true-to-life language use more closely than controlled studies could. In return, we do not have any information about the writers in the sample.
We used a Python implementation of the publicly available API to download data from 79 German cities with a population over 100k people, all 17 major cities in Austria (“Mittel- und Oberzentren”), and 27 cities in Switzerland (the 26 cantonal capitals plus Lugano in the very south of the Italian-speaking area).Footnote 6 This leads to a list of locations that is relatively evenly spread across the entire GSA, albeit with some gaps in the Northeastern and Eastern Middle parts of Germany, which have a lower population density.
Our collection covers a period of roughly 2 months between April 11 and June 19 2017, resulting in a total of 2.3 million threads with 16.8 million posts, or 87.8 million tokens (after preprocessing, see Section 2.2). Note that the number of conversations differs widely between the selected cities due to user activity, ranging from mere dozens to over 40,000 in cities like Cologne, Vienna, Hamburg, Munich, and Berlin. Since individual posts often contain only a few words, we use threads as core units of analysis. This incurs the risks of accidentally including posts from nearby cities in a city-specific thread, and thereby diffusing regional differences. As we will see, though, this risk is minimal enough that it does not affect the outcome of the analysis.
2.2 Preprocessing
In order to use the data in algorithms, we need to preprocess it to maximize the signal and minimize noise. During this process, however, it is unavoidable to lose some small amount of signal as well. As a first step, we lowercase the entire input, to make it more uniform and easier to process. However, this also eliminates the stylistic or grammatical function of capitalization, which in social media is often used for emphasis. In order to find potentially discriminative regional words, we restrict ourselves to content words (nouns, verbs, adjectives, adverbs, and proper names), if they are not contained in a list of common stop words. However, a large class of regionally-distributed content words is that of place names (often the city they are used in, or specific places within these cities), since people talk about their own region more than about other regions. Eisenstein et al. (Reference Eisenstein, O’Connor, Smith and Xing2010) and Bamman et al. (Reference Bamman, Dyer and Smith2014a) focused to some extent on this aspect by exploring “regional topics.” However, while regionally distributed, we want to focus on other markers, so in contrast, we exclude all words identified as named entities (proper names for places, companies, etc.). We use the Python spacy package to filter out words based on their part of speech and named entity type, and the NLTK package to define stop words and reduce the words to their stem. The last step is necessary to remove the rich inflectional patterns found in German. Keeping these patterns in the corpus would create an additional source of variation based on standard German grammar that does not reflect regional variation and therefore would lead to a lower signal-to-noise ratio. Note that both part-of-speech tagging and named-entity recognition are stochastic models, so there is a risk of false positives and negatives. One observed effect is that non-standard items are predominantly identified as nouns. While grammatically often incorrect, its only effect is that these items are kept at a higher rate than standard items (e.g., different inflection forms of the same verb). Empirically, however, we find that the error rates are low enough that it does not impact the discriminating power of the analysis.
Also, both stop words and automatically detected place names are based on standard German. They are therefore only reliably detected and excluded in posts that are written in standard German. This may lead to a higher amount of variation due to non-standard tokens in certain regions (as in Switzerland). While this may be seen as methodological weakness, it actually supports our goal of detecting regional variation with standard German as the “unmarked” point of reference.
2.3 Word and City Representations
Ultimately, we want to represent each city in our data set as a distinct vector (i.e., a list of numbers that capture various linguistic aspects of the city), which can be thought of as a point in a high-dimensional space. Ideally, cities with similar language use patterns should end up with similar vectors (i.e., close together in the space, as can be measured by cosine similarity). In order to learn such a representation, researchers have traditionally defined a small set of variables which formed a vector, with each dimension (i.e., position in the vector) corresponding to one variable. While successful, this approach requires us to pre-define a (preferably) limited set of discrete variables, i.e., to use prior knowledge about dimensions of variation (Lameli, Reference Lameli2013). In our approach, however, we would like to abstain from pre-defined variables that could limit the epistemological potential of our model. Rather, we would like to discover inherent patterns of variation in the data. In order to achieve this goal, but still represent each city as a distinct vector, we rely on a neural network method that has recently gained popularity, called representation learning.
We use an algorithm, paragraph2vec (Le and Mikolov, Reference Le and Mikolov2014), that learns a vector for each city based on the words observed in that city. It also learns representations for individual words in the same vector space. It achieves both goals by learning to predict the vector representation of a word from the city representation in which the word was observed. If the algorithm fails to predict the correct word, we adjust the representations of both the words and city in such a way as to enable the correct prediction the next time. We repeat this process for all words in all threads in our corpus, incrementally improving prediction, until we reach a predefined number of iterations. As a result, we get vector representations of both the words and the cities in the same high-dimensional space. We can imagine this process as placing kitchen magnets for both words and cities on a fridge, and iteratively adjusting them to reflect similarities. Only, the fridge has 300 dimensions.
This vector space enables us to make three types of comparisons: 1) cities to each other (asking: which cities are linguistically most similar to each other), 2) words to each other (asking: which words have a similar meaning, since words that occur in similar contexts receive similar vectors under the method),Footnote 7 and 3) words to cities (asking: which words are most similar to/indicative of a city, see Figure 1). In our experiments, we use the Python implementation of the algorithm in the gensim package. Note that the individual dimensions of the vectors do not correspond to any particular feature (e.g., the fifth dimension does not correspond to the presence of a particular word), but that the vectors have to be interpreted holistically and in relation: a vector simply denotes a point in a high-dimensional space where distance and similarity are meaningful. Words occurring in similar contexts end up closer together in this space (this can be understood as a soft matching of context).
Visualization of learned city representation for Wien (Vienna) and its 10 nearest word neighbors in two dimensions.

The number of vector dimensions is a free parameter we have to choose before running the algorithm. More dimensions allow us to capture more fine-grained differences, but also require more data to learn. In our experiments, we use 300 dimensions, based on dimensionality recommendations for distributed representations (Landauer & Dumais, Reference Landauer and Dumais1997; Lau & Baldwin, Reference Lau and Baldwin2016), and on initial empirical tests. Other parameters include the treatment of frequent words: untreated, they would soon come to dominate the representations. Because they occur equally frequent everywhere, they provide little discriminatory power, leveling out any differences. By down-sampling frequent words, we can shift the discriminatory power to less frequent words, e.g., regional expressions. For all parameters, we follow the settings described in Lau & Baldwin (Reference Lau and Baldwin2016). For further discussion of this method, and an application to national languages across Europe, see Hovy et al. (Reference Hovy, Rahimi, Brooke and Baldwin2019).
As described above, we can use the vectors to compare words to cities. Since vectors are points in space, we can produce a new vector by finding the center between two existing ones. In this way, we can construct artificial centroid vectors made up of several cities, and then find words close to the resulting new vector. Note, though, that the new vector is no longer representing a real geographic location, but is more akin to the theoretic linguistic center of a dialect region. This allows us to find words representative of entire clusters (prototypes).
2.4 Visualization
Prior research has shown that dimensions of variation can be captured in the principal components of vector representations (Shackleton, Reference Shackleton and Robert2005). We also use a form of dimensionality reduction in our study, but not with the intent of controlling the number of dimensions (which we can already control in the paragraph2vec algorithm). Rather, we use a method to translate the first three principal components of the inherent variation in our learned word representations into color values. We apply non-negative matrix factorization (NMF, a form of dimensionality reduction) to the learned 300-dimensional city representations in order to reduce them to 3 dimensions.
We now interpret these three dimensions (the first three principal components) as RGB channels, i.e., we assume that the first principal component signals the amount of red, the second component the amount of green, and the third component the amount of blue for a city (Figure 2). This mixture can then be translated into a single color value. For example, 0.5 red, 0.5 green, and 0.5 blue would translate into a medium grey. The advantage of this transformation is that it preserves similarities: similar colors signal similar components, which in turn mean that the city representations are based on similar word usage. This approach is related to the color assignment used for locations in Pröll et al. (Reference Pröll, Pickl, Spettl, Elmentaler, Hundt and Schmidt2014).
Schematic representation of non-negative matrix factorization. The learned representations of all cities (W) are decomposed into a three-dimensional city view (V), which we use for visualization, and a complementary matrix H.

Applying NMF to the city representations results in a continuous color gradient over the cities in our study (see Map 2). Even without applying any linguistic interpretation to the data, we can already see the difference between Switzerland (greenish colors) and the rest of the GSA, namely Germany and Austria. Within Switzerland, we see a distinction between the GSA (lighter green) and the French-speaking area around Lausanne and Geneva (darker tones). On the other hand, we find a continuous transition from red over purple to bluish colors for Germany and Austria. These gradients largely correspond to the dimensions North >> South(East) (i.e., red >> blue) and West >> East (i.e., intense tones >> pale tones). Given that there seems to be a strong connection between the south of Germany (especially Baden-Württemberg and Bavaria) and Austria, and a strong connection between most cities in the north of Germany, while the (Western) middle part of Germany defines a transition zone (speaking in colors), it seems likely that these correspondences and differences mirror regional linguistic similarities and differences in German.
Gradient color map showing the overall similarity between locations based on all data in the sample.
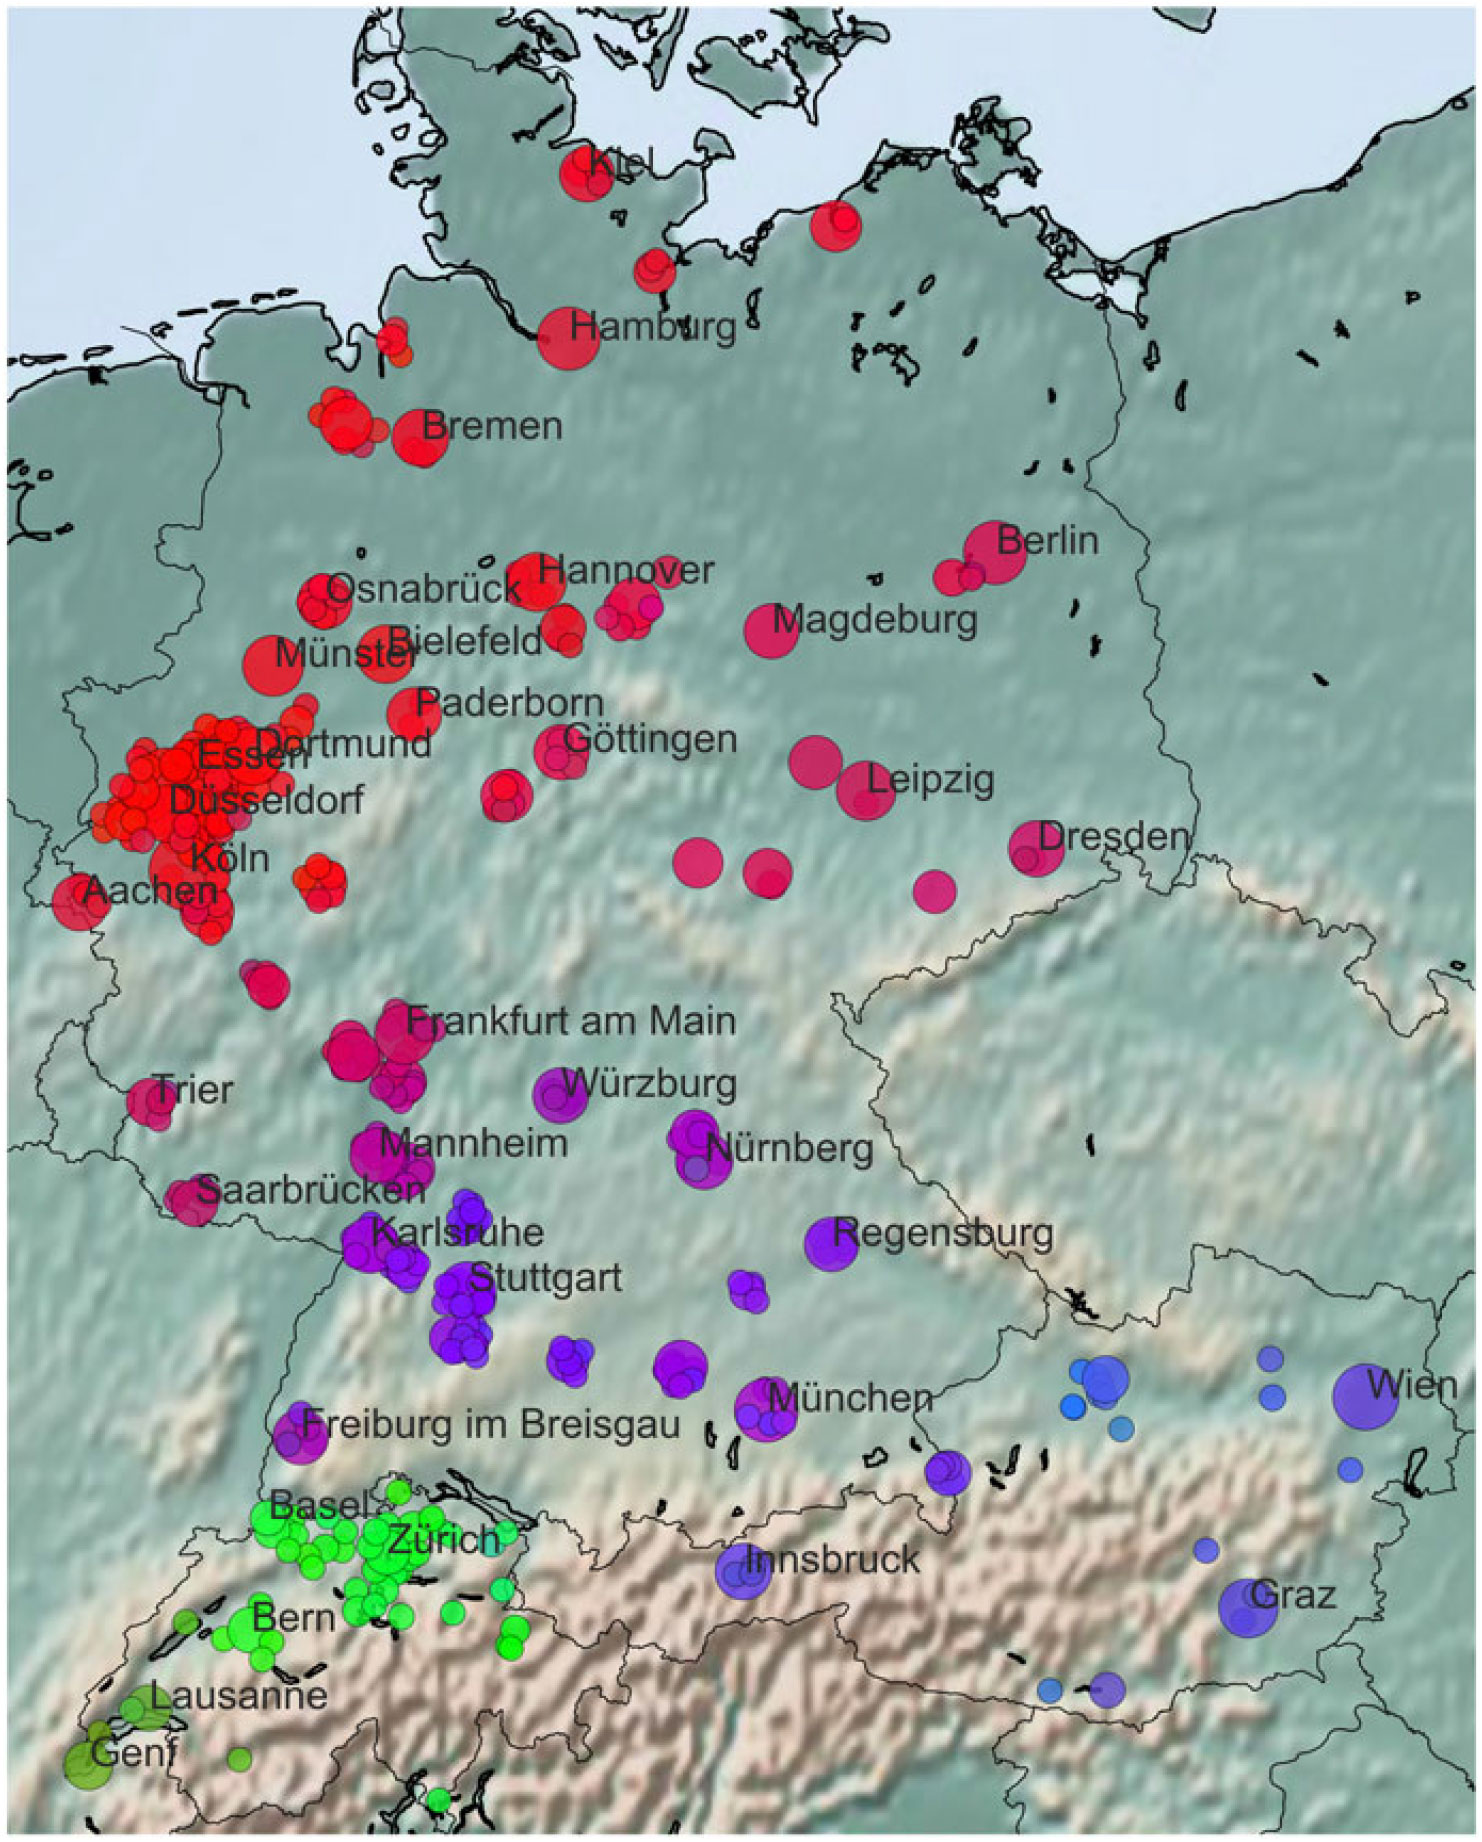
Altogether, the map contains 408 locations (333 in Germany, 27 in Austria, 48 in Switzerland) representing the initially chosen 123 locations plus smaller cities surrounding the larger ones (due to the regionally-bound visibility of conversations in Jodel). The circle size for every location indicates the relative number of conversations per location. Since larger cities tend to have a higher number of users, in most cases, the bigger cities also show the most activity on Jodel. In order to get reliable statistics in our analysis, we restrict ourselves to cities with more than 200 observed conversations. This threshold limits the number of conversations to about 2.1 million conversations (1.82 million in Germany, 173k in Austria, and 146k in Switzerland). Including cities with fewer conversations adds more data points, but often creates noise, as the corresponding representations are based on too little data, resulting in inaccurate vectors.
2.5 Clustering
The gradient color map of the cities in the last section already suggests the existence of larger areas that can be related to the macro-structure of German dialects. However, rather than defining dialect areas based on our knowledge of variation in German, we use agglomerative clustering over the city representations to discover larger structures based on linguistic similarities. This approach also serves as a test for the viability of our data-driven approach. If the clusters in our data do indeed match existing dialect distinctions (or other sociocultural spatial structures), it provides a compelling argument for the applicability of our methodology.
We run hierarchical Ward clustering on the city representations. Prior work (e.g., Nerbonne & Heeringa, Reference Nerbonne and Heeringa1997; Prokić & Nerbonne, Reference Prokić and Nerbonne2008; Szmrecsanyi, Reference Szmrecsanyi2008) has used Ward clustering successfully in a linguistic context. This algorithm groups cities into a selected number of clusters by repeatedly merging the instances that minimize the variance (sum of squared distances) between clusters. Initially, each city is in its own cluster. The merging starts with the two most similar vectors and continues until we reach the predefined number of clusters.
Since the city representations are based solely on word usage in the respective city, the clustering essentially captures regional patterns of similarity in word usage. In addition, hierarchical clustering allows the introduction of structure through the use of a connectivity matrix, i.e., weighted information about the distance between data points, that influences which clusters are merged together. We use the inverse geographic distance between pairs of cities as connectivity weight, i.e., cities that are far from each other (say, Vienna and Hamburg) are less likely to be merged than cities closer together. While this provides the model with a structured component modeling geography, it is important to note that it does not predetermine the clustering outcome, as we will see: cities that are close together, but linguistically different still end up in separate clusters. Structured clustering does, however, provide regional stability and more coherent clusters than unstructured clustering. We can visualize the groupings on a map by assigning each cluster a separate color. Setting different values for the clustering algorithm, we can create more and more fine-grained distinctions.
In the following, we discuss selected cluster solutions (i.e., the clustering steps with two highest explanatory potential) in more detail. For every cluster solution, we show the clusters on two maps, namely the base map and a dialect map for the GSA (a combination of the maps by Wiesinger, Reference Wiesinger, Besch, Knoop, Putschke and Wiegand1983 and Lameli, Reference Lameli2013) with the clustered cities superimposed. The second map allows us to check for correspondences and differences with the regional linguistic macro-structure of German.Footnote 8
Generally speaking, the juxtaposition reveals that the clusterings closely correspond to the structure of the German dialect areas as defined by traditional dialectology, despite the fact that the vast majority of messages in Jodel is written in (informal) standard German (except for Switzerland). Still, regional linguistic similarity is not likely to be the only factor affecting the structures represented in the clusterings. Therefore, we also check for other potential influences, like student mobility, socio-economic exchange, and the contribution of other than regional linguistic differences (e.g., thematic, medium-specific, or discourse-pragmatic resources). In doing so, we are combining the bottom-up quantitative approach from computational analysis with the top-down interpretative approach that uses sociocultural and linguistic knowledge to analyze the cluster patterns. To get an idea of the linguistic constitution of each cluster, we discuss the prototypical words (based on their averaged similarity vectors) for all cities in a cluster. With each new cluster, we compare the 25 most prototypical words for the new cluster with the one from which it was separated. This gives us an idea of the linguistic specificity that distinguishes a cluster from other clusters. In addition, we show word maps of some prototypical words in each cluster (see Maps 4, 7, 12, 14, and 15). These maps illustrate the regional distribution and relative frequency (circle size) of the respective lexical item.
3. Tracing Regional Patterns in Online Communications
3.1 Three Clusters
In the three cluster solution (Map 3), we find the basic distinction between Switzerland on the one hand and Germany and Austria on the other hand, as already expected from the gradient map.Footnote 9 Overall, this clear-cut division is contrary to the dialectal continua assumed for the Alemannic dialect area, which combines most of Switzerland and the southwest of Germany. Interestingly, the German and French-speaking areas within Switzerland (even including Lugano in the south, where Italian is the dominant language) appear more similar to each other under the model than they are to the rest of the GSA. Second, we find a distinction of Germany in two clusters: A northern cluster that represents the Low German region (blue area on the dialect map), the eastern part of the Middle German region (yellow area) including Northern Hessian (Kassel), and the northern part of what Lameli (Reference Lameli2013) calls “Historical Western German” (green area), i.e., Ripuarian and Low Franconian, and a southern cluster that comprises the western part of Middle German (yellow area) including Moselle Franconian (green area), and all of the Upper German varieties except Switzerland.
Three-cluster solution.

Cluster 1 (Switzerland, 52 locations, 147k threads): esch, ond, vell, gaht, wüki, nöd, besch, emmer, nor, au nöd, verstahn, muen, wükli, dänn, vode, hett, chan, rechtig, staht, sösch, abig, mached, isch de, lüüt, nanig
Cluster 2 (Northern Germany, 170 locations, 1.2M threads): ja gut, erstmal, sieht, drauf, vielleicht, mehr, gut, sehen, schonmal, ahnung, bisschen, gesagt, kommt, allerdings, gucken mal, reicht, achja, bestimmt, garnicht, musst, ansonsten, scheinbar, darauf, schon gut, wahrscheinlich
Cluster 3 (Southern Germany & Austria, 186 locations, 804k threads): afoch, voi, nd, i a, oda, möppes, nimma, is a, mei, gscheid, is, ffm, @vj, hnx, vj, lörres, @vvj, bissl, dummwiekarlsruhe, gibt, vermutlich, lässt, gerade, feuerbach, wobei
If we look at the 25 most prototypical words for each cluster, the difference in language use between them is striking: The list of prototypical words for cluster 1 contains only words that are written forms of Swiss-German dialect words, including common adverbs (wüki ‘really’, German wirklich), verbs (verstahn ‘understand’, German verstehen), nouns (abig ‘evening’, German Abend), and even conjunctions (ond ‘and’, German und). Compared to that, cluster 2 contains only standard German words, mostly adverbs (ansonsten ‘otherwise’), adjectives (gut ‘good’), verbs (gucken ‘look’), or nouns (ahnung ‘suspicion’). Some of them show typical characteristics of digital writing, like contraction of collocations (achja ‘oh well’). In contrast, the items for cluster 3 (the southern part of Germany and Austria) relates to various linguistic resources: First, we find some standard German words (gerade ‘just’, vermutlich ‘supposedly’). Second, there is a group of prototypical words that represent written versions of regional forms originating from the Upper German dialect area (including Austria), like gscheid (‘intelligent’ or ‘properly’), mei (‘well’, Bavarian interjection), or voi (‘really’). The third type of items are Jodel-specific terms that are used for the pragmatic organization of conversations, such as referring to previous messages/users in a thread (vj, @vj for ‘vorheriger Jodler’: ‘previous author/message’). A fourth type of item seems typical for the Jodel community, but without fulfilling a meta-function like “deictic reference.” This is the case for möppes (Map 4), which is commonly used in the Jodel community and refers to ‘female user’ or ‘breasts’, and lörres (‘male user’ or ‘penis’). While both words are known in regional Western German (e.g., with different meaning in the case of möpp ‘person’), the words apparently have been re-semanticized in Jodel communications. And lastly, we find discourse labels like dummwiekarlsruhe ‘stupid like Karlsruhe’ and examples for references to specific locations like ffm (abbreviation for ‘Frankfurt am Main’), feuerbach (referring to the quarter in the city of Stuttgart), or hnx (‘Heilbronx’, wordplay with Heilbronn and Bronx) which reflect the regional binding of the different user communities.
Word maps for the items erstmal (left), möppes (middle), and esch (right).
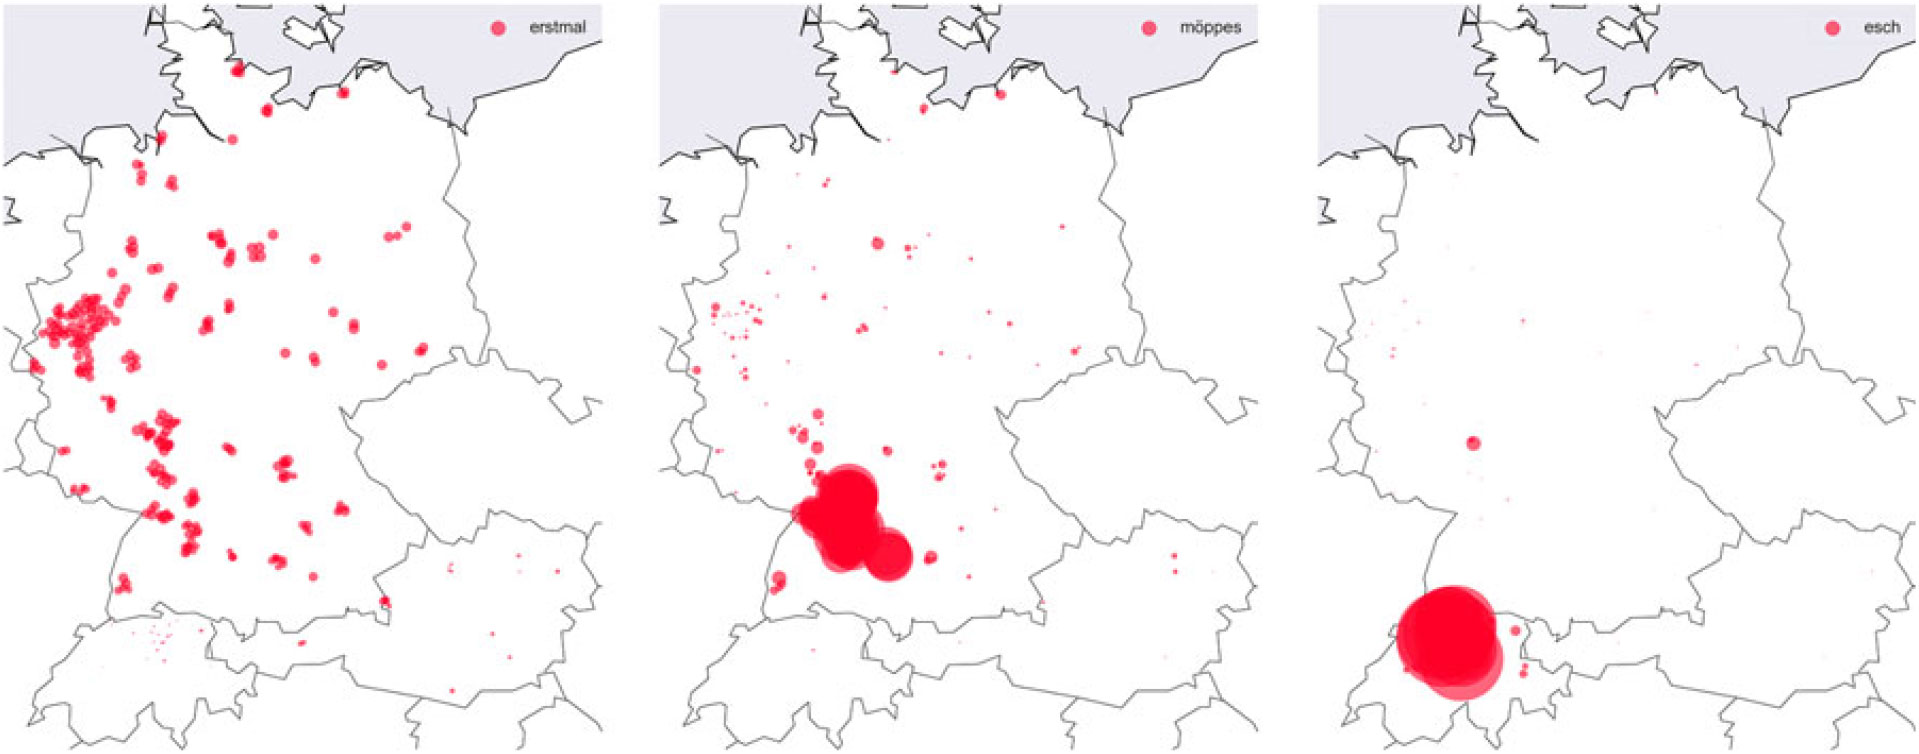
The three clusters represent different cluster-specific writing styles: the use of standard German forms (cluster 2) versus the transliteration of spoken Swiss-German forms (cluster 1) versus a mixture of different linguistic resources (cluster 3). This of course relates only to the most prototypical words per cluster, not all cluster-specific communications. Still, it is suggestive of the different characteristic linguistic resources used in the respective clusters. Map 4 shows the regional distribution of three prototypical words in the sample representing different linguistic resources, i.e., erstmal (cluster 2, standard German), möppes (cluster 3, community-specific), and esch (cluster 1, Swiss dialect). As we can see, each item shows a different regional spread: while standard German items like erstmal are evenly spread throughout the entire GSA, other items (and therefore, resources) show regional focuses of distribution (möppes) or are exclusive of a specific cluster (esch). While the prototypes in this clustering solution are calculated for rather large areas, they already demonstrate that our model can detect distinctive patterns of similar (or different) language use that is clearly linked to regional variation. Generally speaking, Swiss-German Jodel users write in their (local) variety of German, whereas Northern German users use standard written German, and Southern German and Austrian users employ a mixture of different linguistic resources.
3.2 Four Clusters
In the four-cluster solution (Map 5), we see the split of cluster 3pr into a new cluster 3 (blue dots) roughly corresponding to Austria and the German federal state Bavaria (both using Bavarian dialects),Footnote 10 and a cluster 4 (lemon dots) that is constituted by the remaining locations in the western part of middle and south Germany. Dialectologically speaking, we see the split between the Western and Eastern Upper German dialects reproduced in our data, with the interesting exceptions of Augsburg and Würzburg in Bavaria. Both are clustered together with the western locations in cluster 4, although in Lameli’s (Reference Lameli2013) quantitative dialect division Würzburg belongs to Eastern Franconian (which forms a transition zone between the Middle and Upper German dialects but is mostly subsumed by Eastern Upper German, i.e., with Bavarian), while Augsburg belongs to Swabian.
Four-cluster solution.

While in the case of Augsburg, geographic proximity can be used to explain the clustering, it does not sufficiently explain Würzburg’s cluster affiliation. However, there is additional evidence we can use that derives from regional mobility patterns of first-year college students. As mentioned above, many Jodel users can be assumed to be college students. Most of them stay in touch with friends in their home region, or even travel back over the weekends. Some effects of this regional mobility are captured in our data (see Map 6). In the case of Würzburg, there is evidence that its university attracts a high percentage of students from outside Bavaria (40% of all enrollments), especially from Baden-Württemberg, Hesse, and other Western German federal states, whereas enrollments from Bavaria (60%) concentrate on regions in the northwestern (i.e., Franconian) part of Bavaria. On the other hand, 80% of students enrolling at the University of Augsburg originate from Bavaria, especially from the surrounding administrative districts and the Munich area, all of which are part of the Bavarian dialect area. Therefore, we can assume a correlation between the cluster affiliation of the two cities and the mobility patterns of their student population. Geographic proximity and regional mobility both play a role in the structuring of the Jodel users’ social and communicative practice, and are therefore reflected in the cluster affiliations.
Home regions of students at the University of Würzburg (left) and Augsburg (right), initial enrollments for winter semester 2016/17 (data source: © Bayerisches Landesamt für Statistik, Munich, 2017).
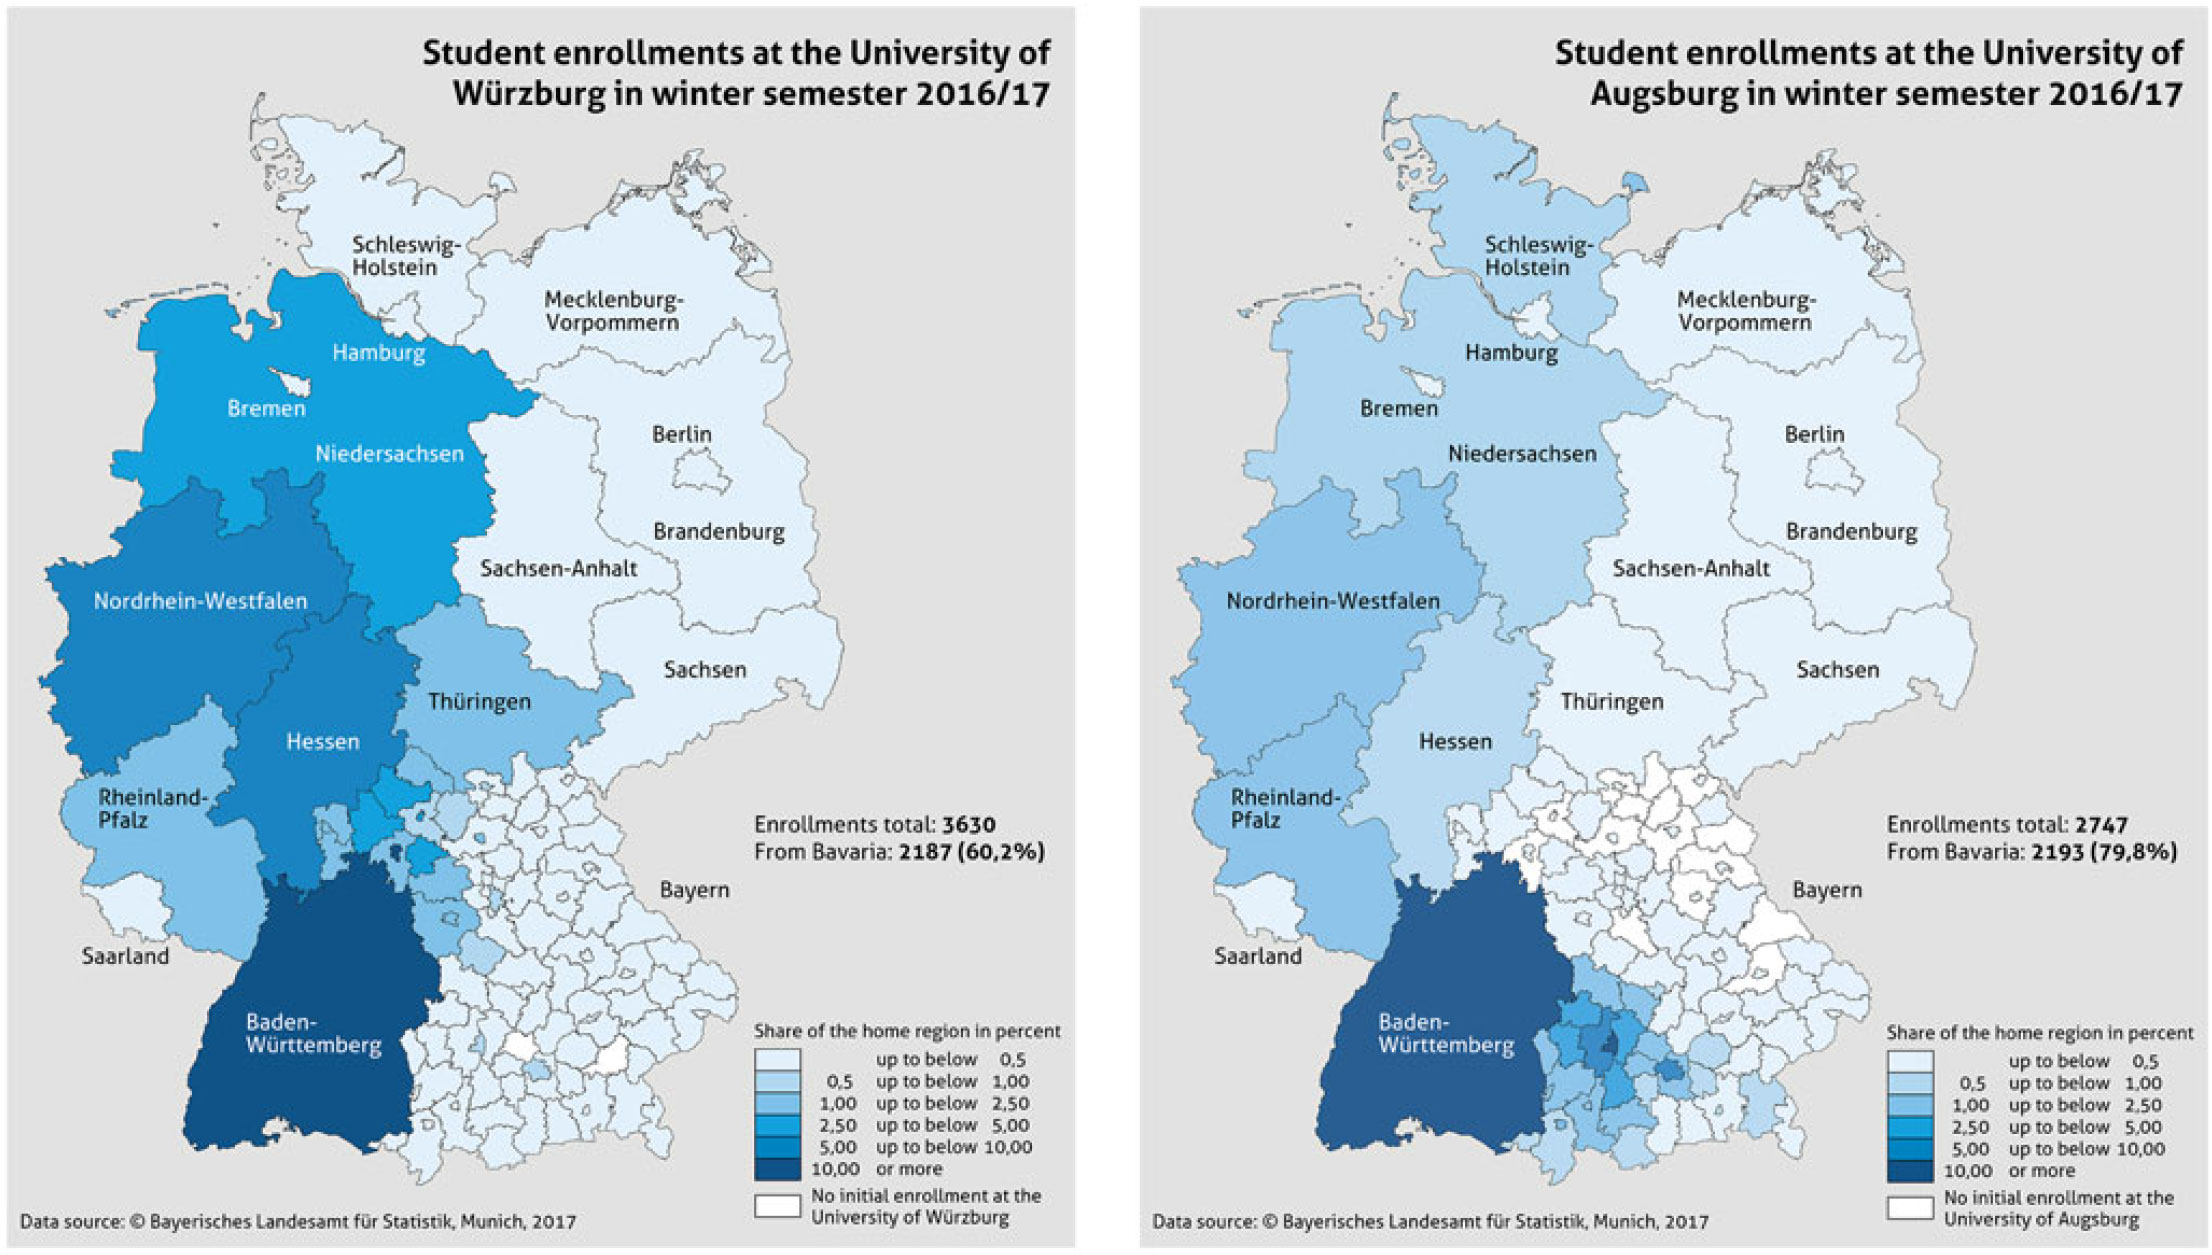
While these patterns of regional mobility versus geographic proximity already hint at some of the potential structuring forces for clusters 3 and 4, the prototypical words speak an even clearer language:
Cluster 3 (mostly Bavaria & Austria, 64 locations, 356k threads): oba, owa, einfoch, hoid, waun, hob, siag, mocht, kan, afoch, ghobt, woa, ana, ois, hobi, voi, najo, obwoi, laung, haum, amoi, fia, faungt, oiso, kema
Cluster 4 (Western Middle and Southern Germany plus East Franconian, 122 locations, 448k threads): h7, möppes, sontheim, heilbronner, ffm, @vj, hnx, vj, herrngarten, aurelius, lörres, @vvj, gibt, dummwiekarlsruhe, vermutlich, feuerbach, wobei, pforzheimer, besonders, beispiel, hohenheim, lässt, stuggi, gerade, meinst
The difference between the locations in the two clusters is quite clear: Among the prototypical words in cluster 3 are dialect words, most of which can be attributed to general Bavarian (mocht ‘makes’, hoid ‘so, well’). Still, there is some evidence for regional variation within this cluster, for example the forms laung ‘long’ and waun ‘when’ that originate from the Austrian part of Bavarian (see Map 7).
Word maps for hoid (left) and waun (right).

In contrast, cluster 4 does not contain any dialectal items among the prototypical words. Instead, this cluster shows more location names and community-specific language use (@vj, @vvj, lörres, möppes, dummwiekarlsruhe), which again hints at the role of differing linguistic resources as a structuring factor of the regional clusters in the data. Apart from that, we find some standard German words that do not tell us much about the regional constitution of this cluster.
3.3 Five Clusters
In the five-cluster solution (Map 8), cluster 1pr splits into two new clusters that nicely reflect the border between French and German-speaking Switzerland. Cluster 5 (dark blue dots) represents the French-speaking locations in the West of Switzerland, while cluster 1 (light blue dots) now contains all of German-speaking Switzerland and Lugano in the Italian-speaking part.Footnote 11 Note how the border between the two new clusters exactly matches the outer border of the Alemannic dialect continuum. While we would expect the two areas to be quite different in terms of language use, it is interesting to note that under the model, which was trained mainly on standard German, the difference between French and Swiss-German is smaller than the difference between Switzerland and the rest of the GSA (cf. the three-cluster solution). Presumably, French and Swiss-German jointly differ more from standard German than the other clusters in the rest of the GSA do (cf. the prototypical words for clusters 2 and 3 in the three-cluster solution). Another reason could be that the Swiss community is relatively small compared to the German and Austrian one: the new cluster 5 represents only 6 locations.
Five-cluster solution.
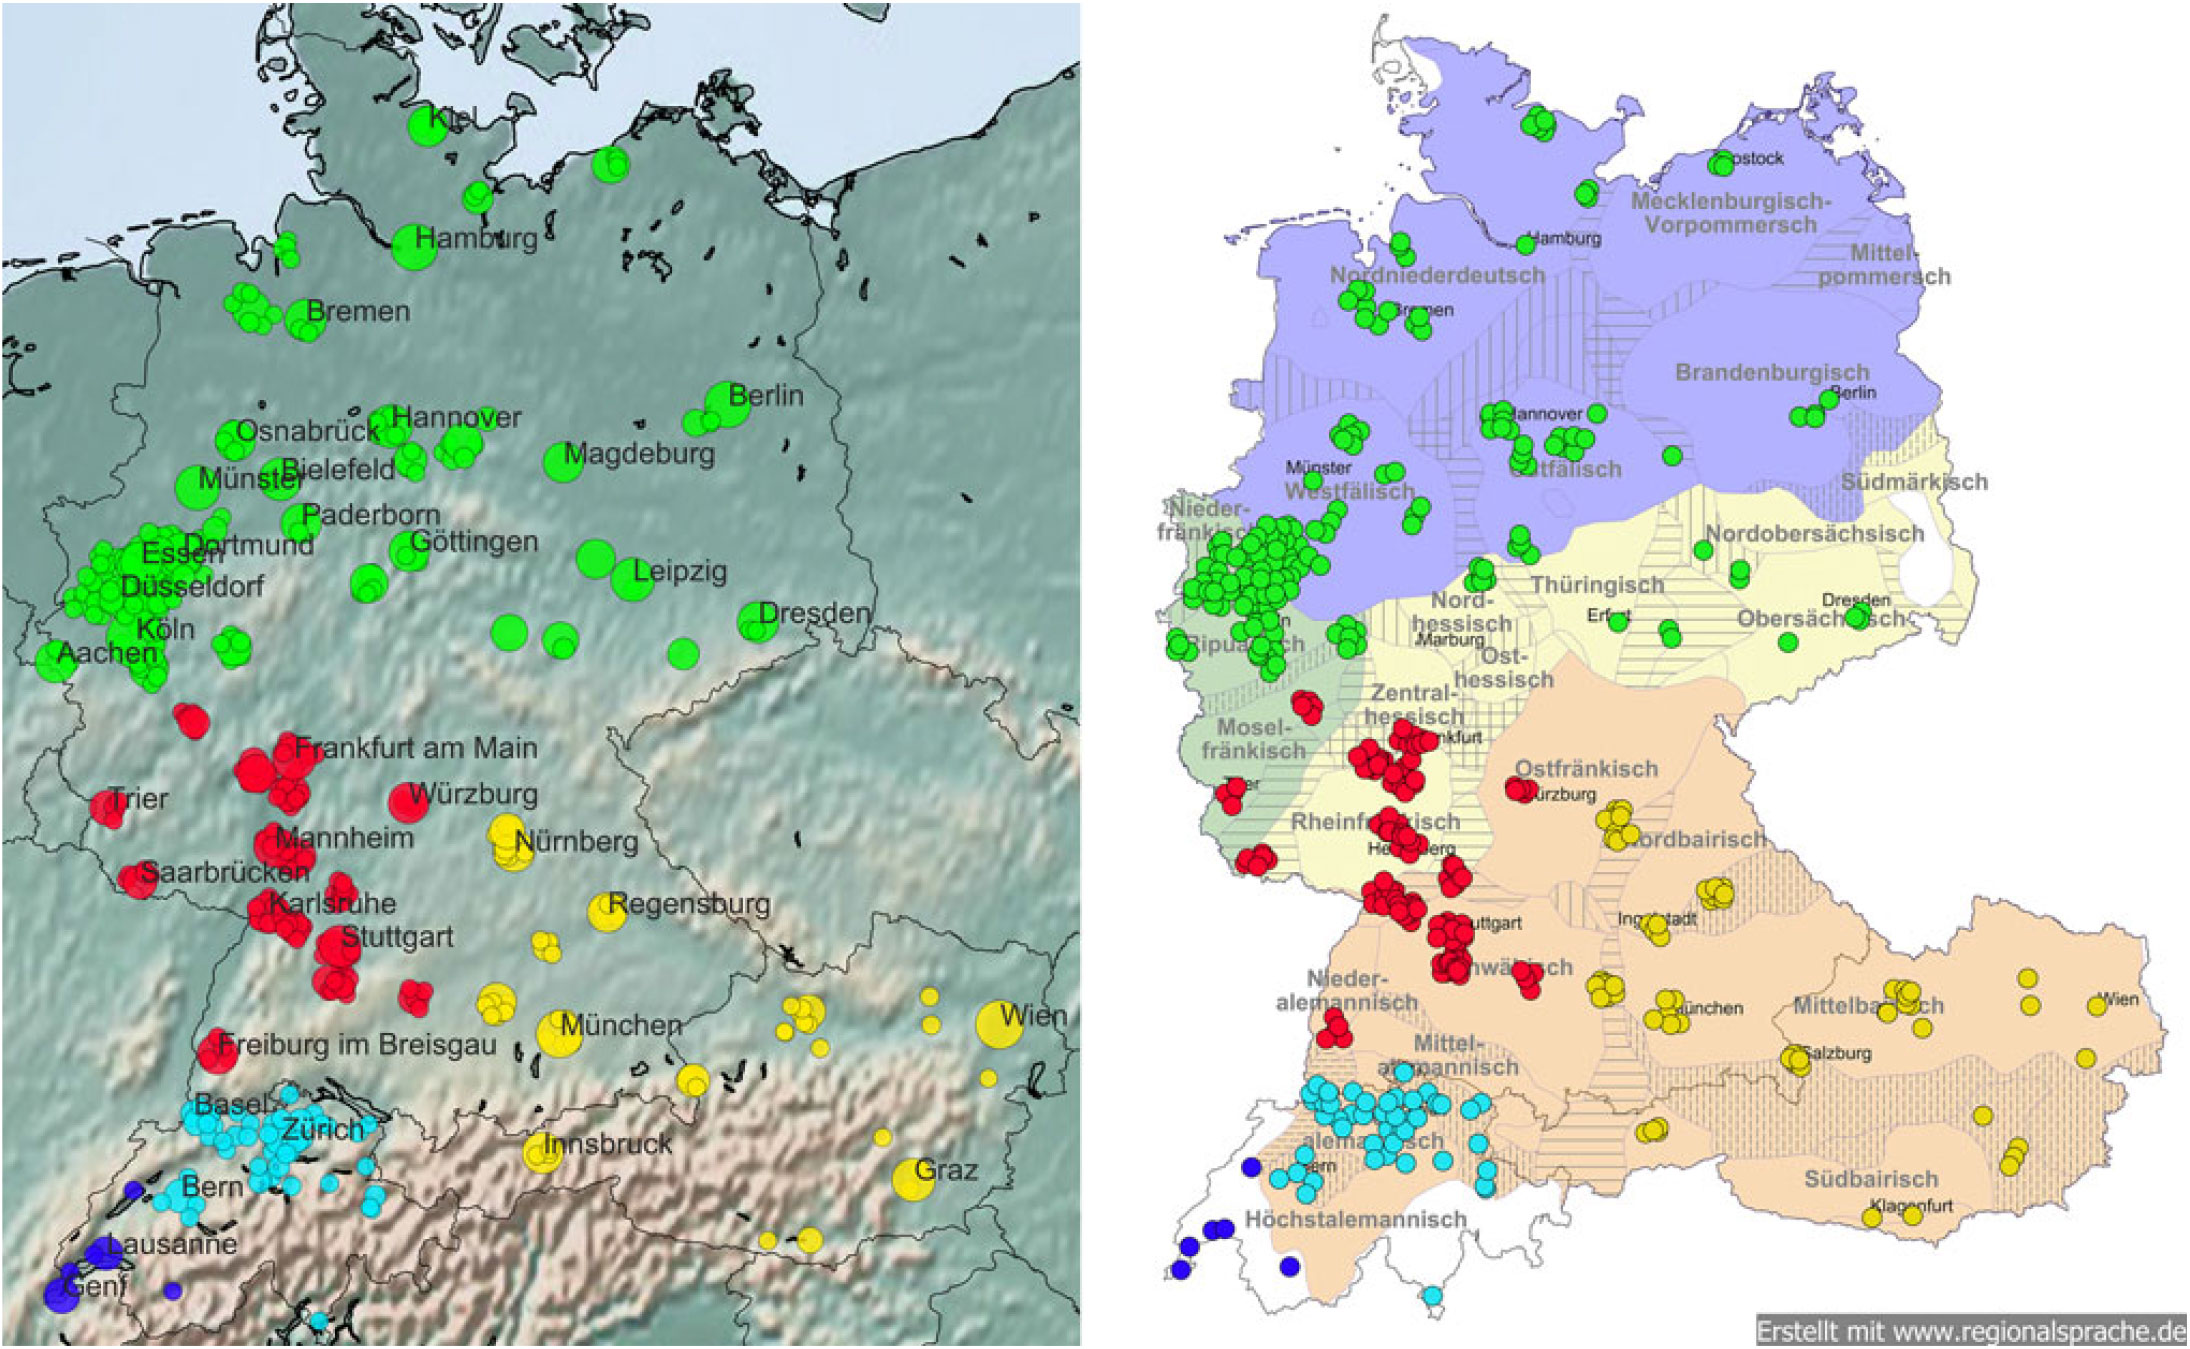
The prototypical lexical items substantiate this assumption:
Cluster 1 (German-speaking Switzerland & Lugano, 46 locations, 99k threads): esch, ond, vell, gaht, wüki, nöd, besch, emmer, nor, au nöd, verstahn, muen, wükli, dänn, vode, hett, chan, rechtig, staht, sösch, abig, mached, isch de, lüüt, nanig
Cluster 5 (French-speaking Switzerland, 6 locations, 42.5k threads): t’as, je vais, autant, pour le, que ça, peut être, j’ai, en fait, je pense, c’était, une, dans le, trouve, parler, fais, même, sinon, comme ça, je sais pas, que je, pour moi, c’est, à, pour, enfin
The Swiss-German cluster contains only Swiss-German words. Note that the list of prototypical words for cluster 1 contains exactly the same items that it did in the three-cluster solution. The main reason why French appears relatively late (cluster 5), despite the linguistic distance of French to German, might be the small amount of data from Switzerland (42.5k conversations for cluster 5, compared to 99k in German-speaking Switzerland). The list for cluster 5 consists of standard written French, including common collocations (en fait ‘actually’, dans le ‘in the’, pour moi ‘for me’) and examples of informal standard French (je sais pas ‘i do not know’, with the first part of the negation ‘ne’ omitted). The prototypicality of common French words for this cluster is due to the fact that we only excluded German stop words during preprocessing. That also explains the high number of frequent collocations among the 25 prototypes for this cluster.
3.5 Six Clusters
We find an interesting division in our data for six clusters (Map 9), which demonstrates both the accuracy of our model as well as its limits. Linguistically speaking, the new split divides the Western Middle and Upper German areas of cluster 4pr into two clusters: The new cluster 6 contains only locations within the Swabian dialect area, while cluster 4 contains the rest of the locations in the west of Baden-Württemberg, Hesse, and Rhineland-Palatinate, plus Würzburg and surroundings. This distinction affects some cities and their surroundings in the transition zone between the Middle and Western Upper German dialects, (i.e., Pforzheim, Heilbronn, and Karlsruhe belong to South Franconian “Südfränkisch,” while Heidelberg is Rhine Franconian) that are split into two groups, i.e., Heidelberg & Karlsruhe on the one hand and Pforzheim & Heilbronn on the other. This result is even further reassuring for our method: given that Jodel is highly localized, with a radius of about 10 km to 15 km per post, we might expect our model to reproduce the local proximity by clustering these nearby cities together.
Six-cluster solution.
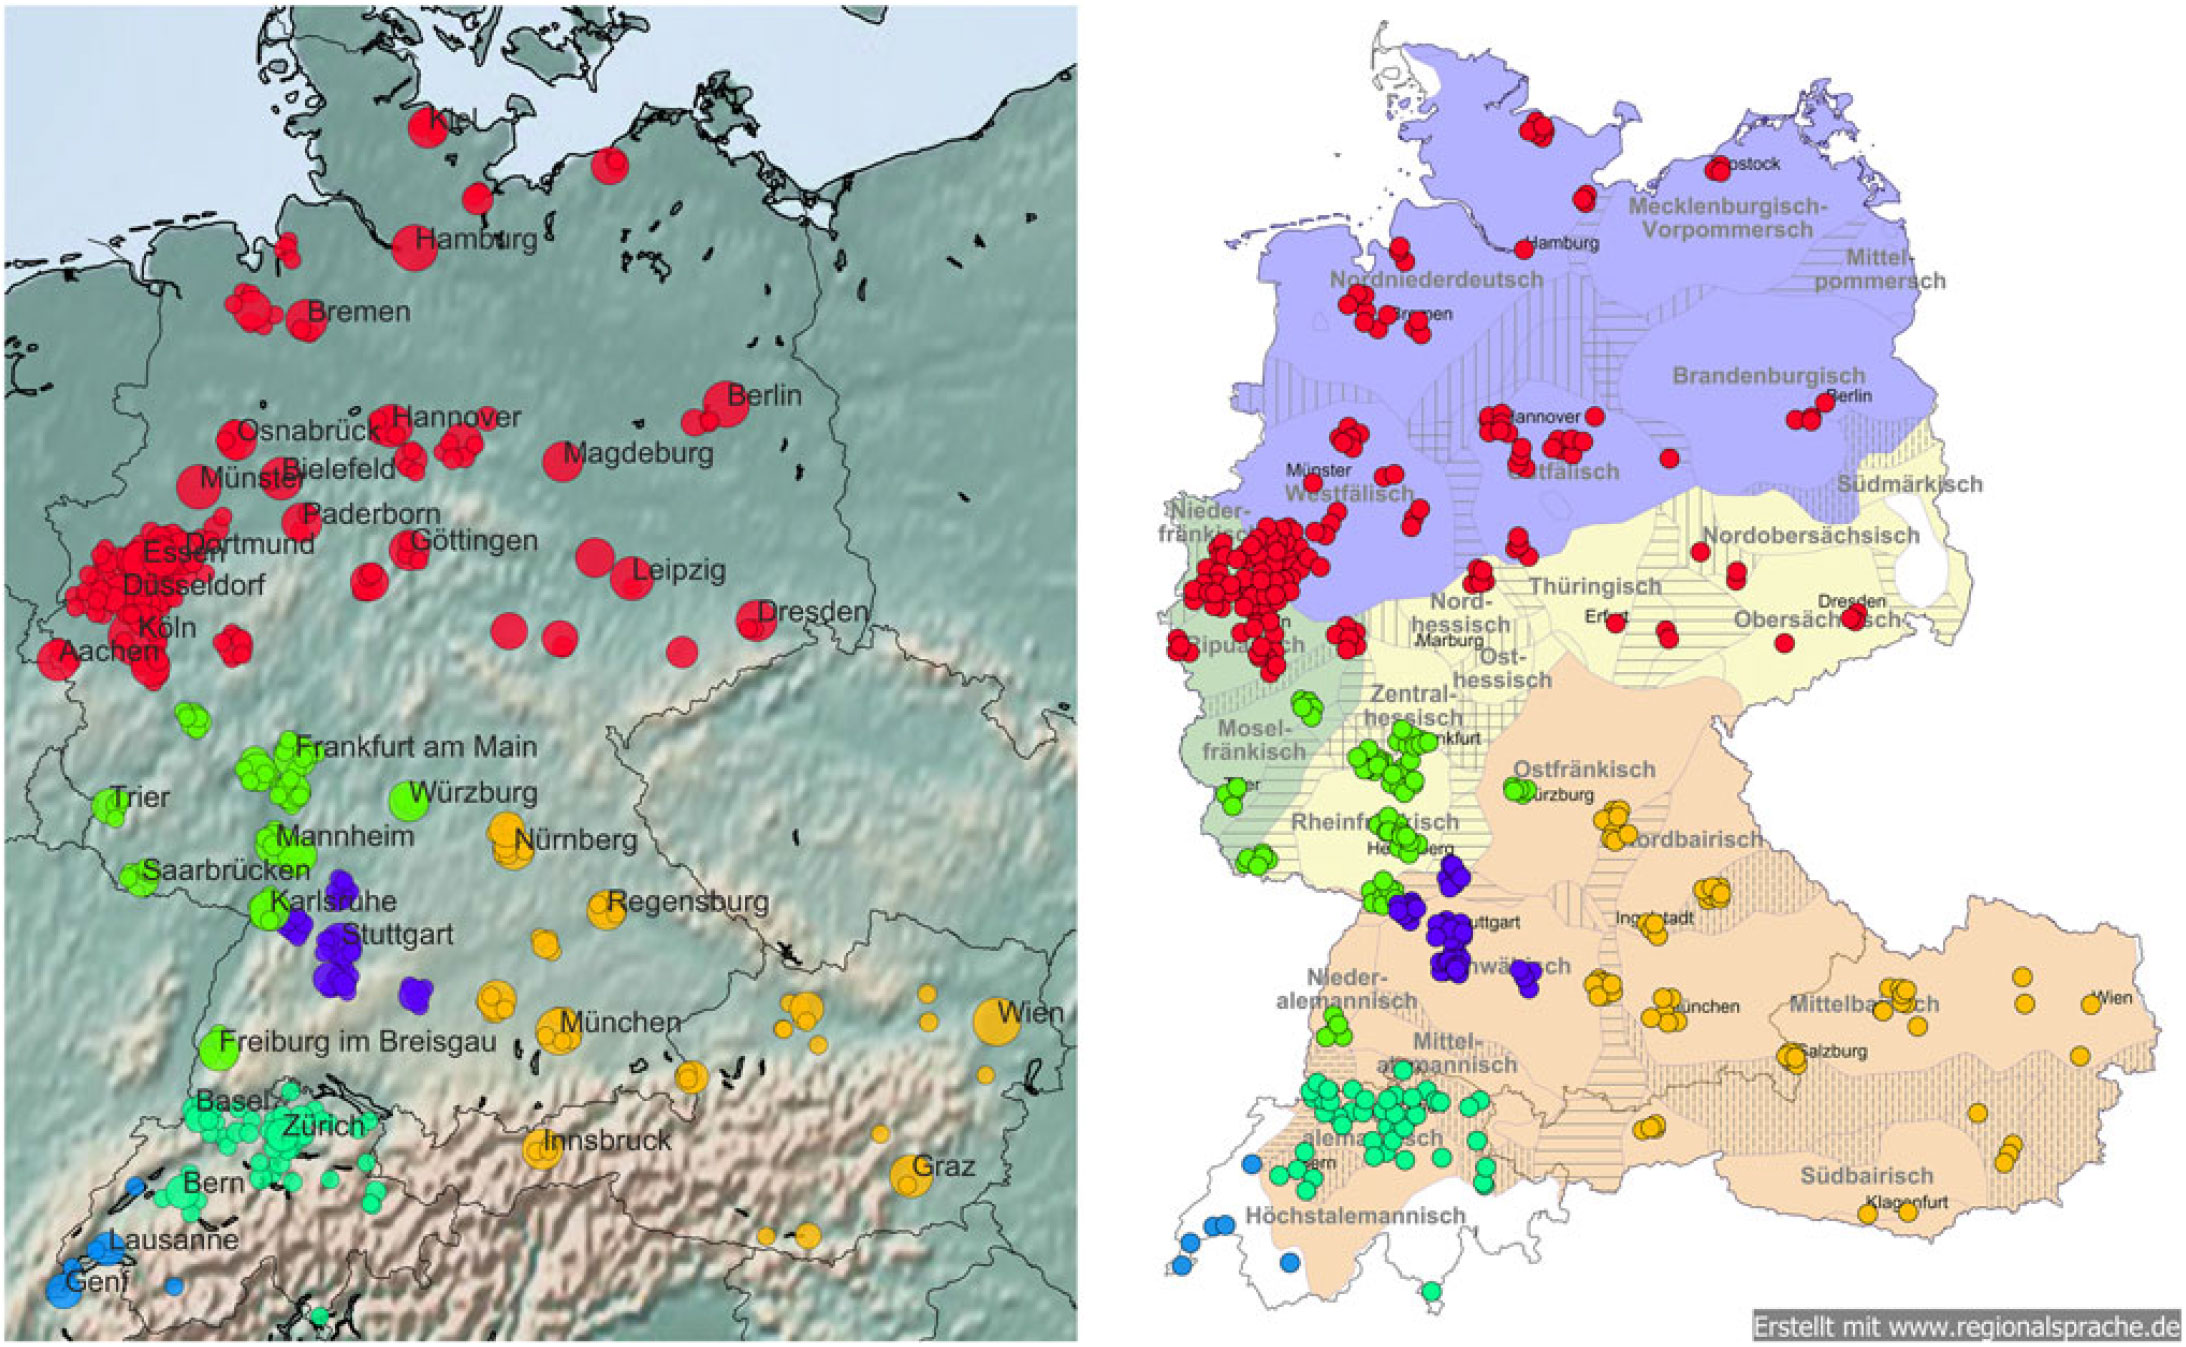
However, geographic proximity and linguistic dissimilarity cannot be the sole structuring factors in the model, since the distance between some of the locations is less than 15 km. Rather, it seems likely that this division partly reflects the effects of socioeconomic mobility, i.e., the influence of cities on smaller places around them. Statistical data on commuting traffic in the region (Bundesagentur für Arbeit, 2018) reveals a compelling pattern for all four cities: commuters between Karlsruhe and Heidelberg mainly originate from the northwest from the border, i.e., the Rhine Franconian area, whereas commuters between Pforzheim and Heilbronn originate from the southeast, i.e., the Swabian area. So in this case, the clustering not only partly reflects the linguistic border between Middle and Upper German, but also a more complex structure of diverging sociocultural orientation and socioeconomic exchange at the regional level.
The prototypical words show strong influence of location and place names for both clusters:
Cluster 4 (Western Middle German, Low Alemannic & East Franconian), 77 locations, 341k threads): sharks, neckarwiese, city döner, darmstädter, moseleck, bonames, amk, ffm, vj, herrngarten, hda, sgf, lelek, eberstadt, sachsenhausen, bessungen, arheilgen, einzelkampf, aurelius, gibt, 0-6 + 9, mainzer, @vvj, niederrad, besonders
Cluster 6 (Swabian, 45 locations, 107k threads): h7, möppes, tübinger, sontheim, aksaray, heilbronner, mpark, pf, hnx, pforzelona, blaubeurer, cannstatt, newie, bildungscampus, hn., lörres, hhn, greendoor, böckingen, wimpfen, ilsfeld, dummwiekarlsruhe, feuerbach, pforzheimer, blaubeurerstraße
Both lists predominantly reflect regional locations (sontheim, moseleck ‘a bar near Frankfurt main station’), facilities (mpark ‘abbreviation for Musikpark, a concert location in Heilbronn’, city döner ‘a kebab restaurant’), groups of users (darmstädter, heilbronner), or local elements of culture (sharks ‘a strip club in Darmstadt’). However, to some extent the prototypes still reflect regional word use or topics beyond place names, i.e., the notorious möppes and lörres (cluster 6), but also examples of swearwords, in this case the Polish word lelek ‘nightjar’ that is common in urban German ethnolects.
We conjecture that the smaller the clusters become (in terms of the geographic area), the more our data is influenced by local place names and topics that are difficult to interpret for outsiders (e.g., the meaning of einzelkampf ‘single combat’). However, note that the prototypical words only represent an average of word usage for all locations in a cluster. Bigger cities and places with more conversations therefore influence these prototypes more than places with a smaller amount of data (as we have seen in the case of the French and German part of Switzerland). For example, the prototypes for cluster 4 are dominated by location names in the Rhine-Main-Area around Frankfurt (ffm, sachsenhausen ‘a quarter of Frankfurt’, 0-6 + 9 ‘area dialing code for Frankfurt’).
With respect to preprocessing (see Section 2.2), it becomes apparent that while we can filter out many place names, many creative versions remain, such as abbreviations (hhn ‘University of Heilbronn’, hn ‘licence plate code for the administrative district of Heilbronn’), neologisms (pforzelona ‘humoristic portmanteau of Pforzheim and Barcelona’), facilities (city döner), or groups of users (heilbronner, pforzheimer, tübinger).
3.6 Seven Clusters
In the seven-cluster solution (Map 10), the northern half of the GSA (see cluster 2pr in the three-cluster solution) is split, with cluster 7 (purple dots) representing the locations in the Ruhr area and Rhineland while cluster 2 (pale green dots) contains the rest of the Northern German locations. The new cluster 7 is spread across the Western German dialect area as of Ripuarian and Low Franconian (green area) as well as the Low German dialect area Westphalian (blue area). Again, recent digital language use diverges from the traditional dialect areas. In this case, location density together with the number of users in the Ruhr area and Rhineland (some of the most densely populated in the entire GSA) as well as the high amount of mobility (socioeconomic and sociocultural) in the region lead to the closely interwoven pattern reflected in the clustering.
Seven-cluster solution.

This effect is also visible in the prototypical words:
Cluster 2 (Northern Germany & East Middle German, 81 locations, 691k threads): wolfhager, osna, wf, bs, wob, kieler, jedenfalls, gerade, bloherfelde, durchaus, braunschweiger, erstmal, deutlich, schon gut, musst, nochmal, bisschen, dürfte, drauf, schonmal, gehört, vielleicht, hast, achja, außerdem
Cluster 7 (Ruhr area & Rhineland, 89 locations, 525k threads): gerade, erstmal, ja gut, mehr, allerdings, garnicht, sieht, gut, scheinbar, kommt, vielleicht, immernoch, ansonsten, bisschen, schonmal, bestimmt, drauf, achja, einfach, gucken mal, zutun, wobei, eben, darauf, ahnung
Cluster 7 prototypes consist solely of standard German words, as in the two-cluster solution. There is no reference to regional or local place names of any kind. In contrast, cluster 2 contains a mixture of standard German words, references to location names (osna ‘Osnabrück, bs ‘Braunschweig’, wb ‘Wolfsburg’), local places (wolfhager ‘a street name in Kassel with student housing’), and references to local user groups (kieler, braunschweiger). This cluster shows the transition from a global structure that reflects macrolinguistic similarities to a regionalized structure that highlights specific regional user communities (and their word use). Given that each cluster represents roughly one quarter of all conversations collected, we can assume an interplay between location density and the geographic distribution of place mentions in the cluster: The locations in cluster 2 are spread over entire northern Germany, while the locations in cluster 7 are concentrated in a much smaller area. The prototypical place names we find for cluster 2 belong to local user communities that do not represent the most active communities. The locations responsible for the place-name prototypes are among the top 25 locations in terms of the number of threads, but do not have the highest total number conversations.Footnote 12 This could indicate that in these communities place references as a linguistic resource are more constitutive for the group-specific language use.
3.7 Eight Clusters
The eight-cluster solution (Map 11) splits cluster 3pr, which contained cities in Bavaria and Austria. The new cluster 3 consists of the Bavarian locations, while cluster 8 represents all locations in Austria. Given that the national border here is often believed to be a linguistic border,Footnote 13 and the long distance between the Bavarian and Austrian locations, this distinction is no surprise. The fact that it only occurs so late in the process, however, is. The prototypical words for the two new clusters reflect the split. Where the prototypes for cluster 3pr combined both Bavarian and Austrian dialect forms, the new list for the Austrian locations (cluster 3), is predominantly Austrian, clearly showing the split.
Eight-cluster solution.
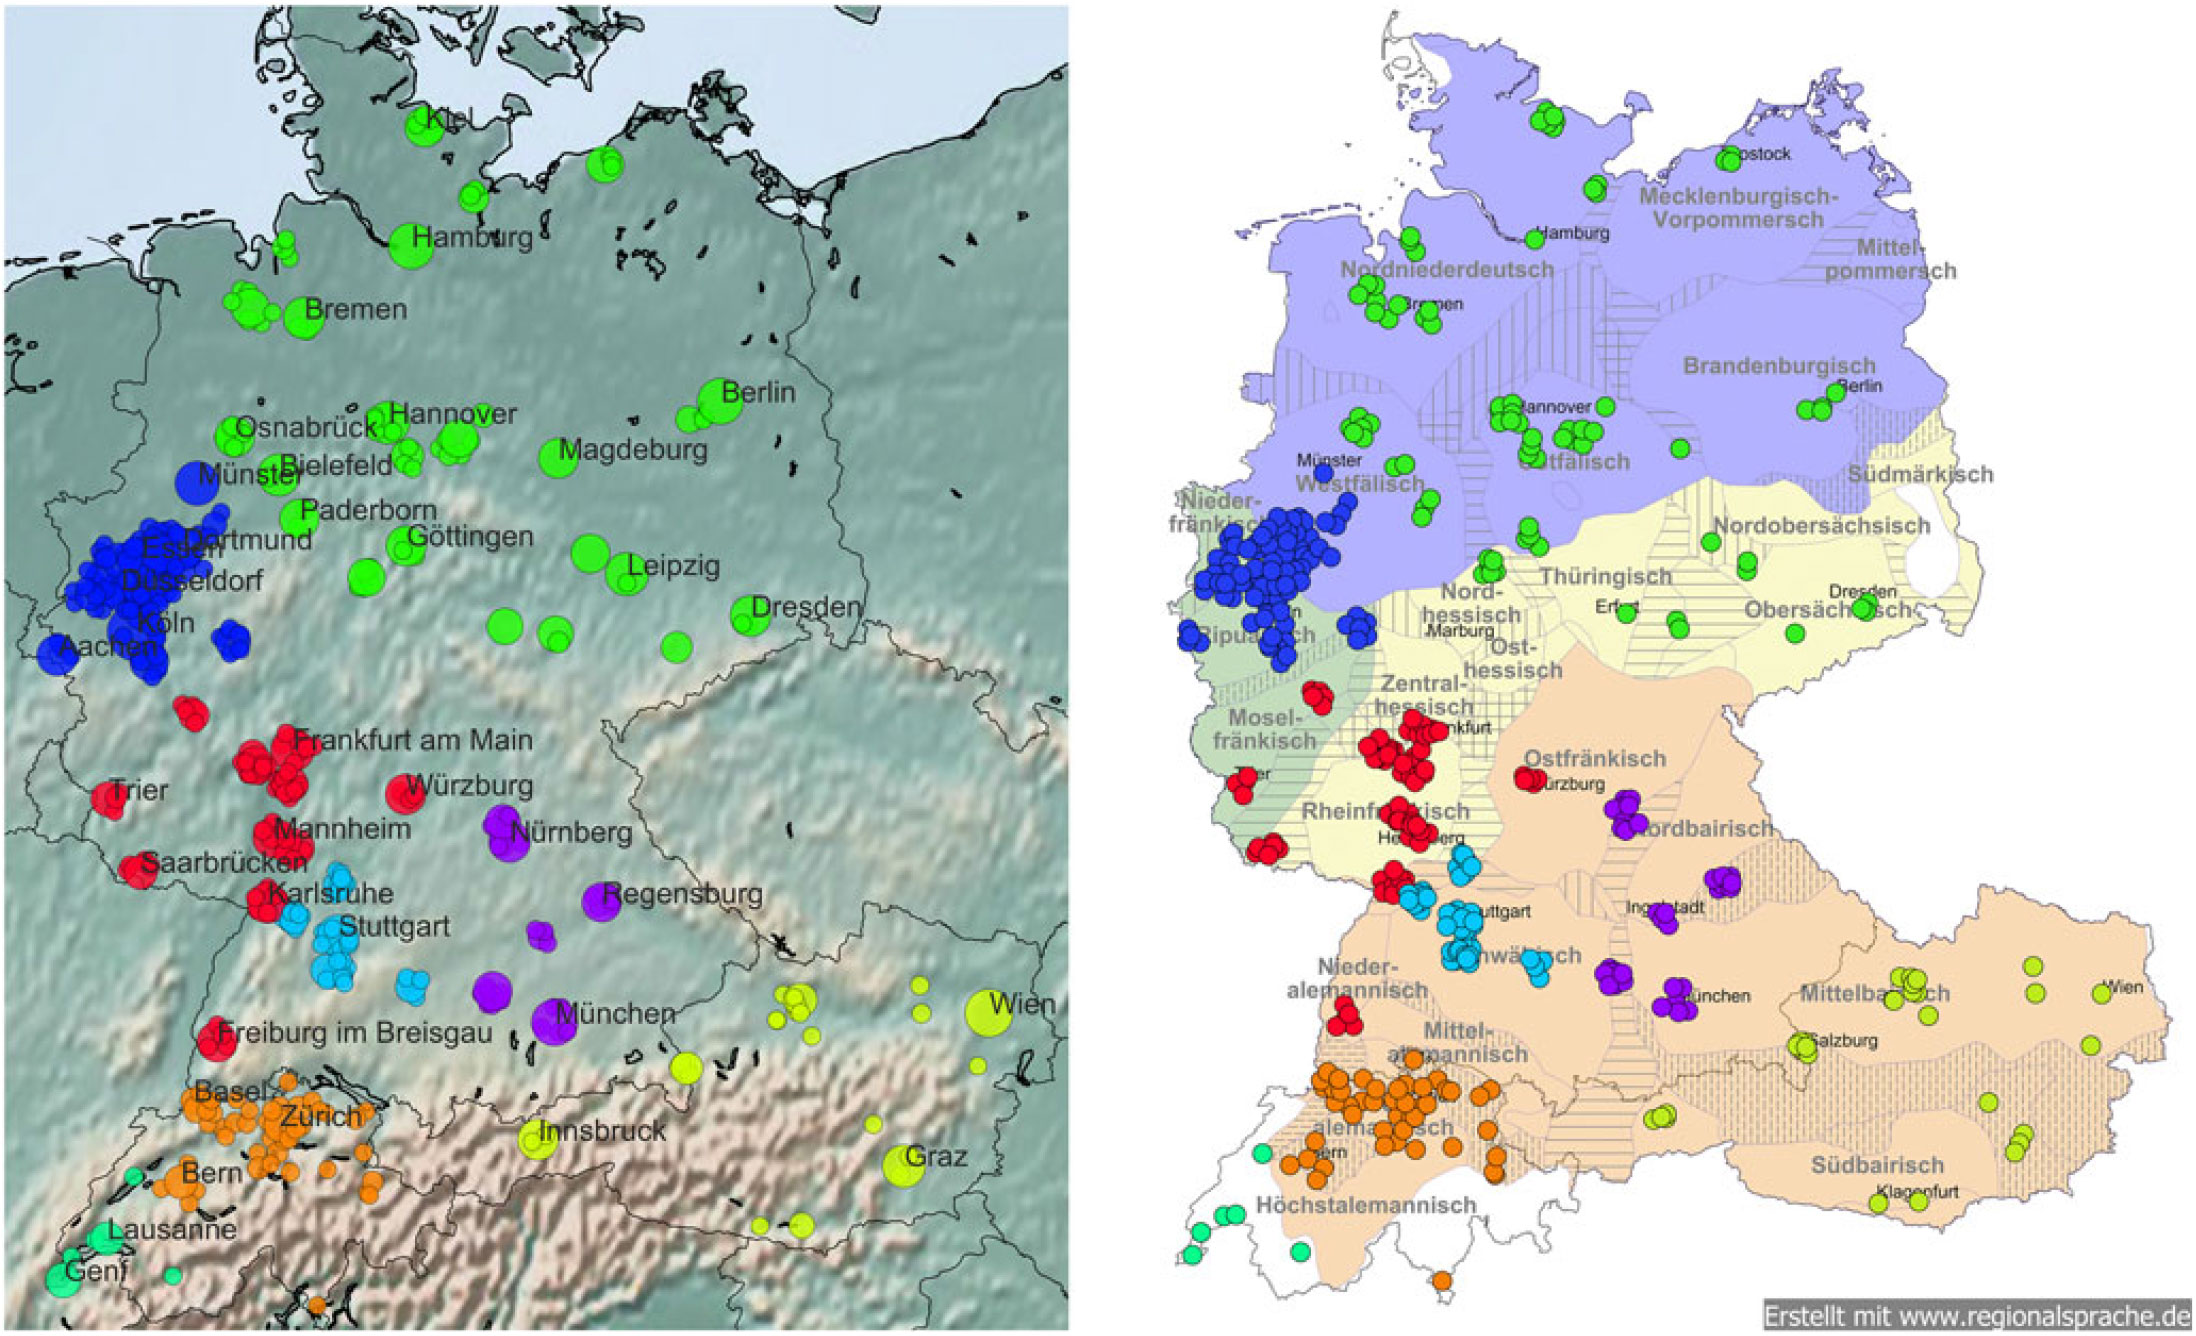
Cluster 3pr (Austrian & German Bavarian), 64 locations, 356k threads): oba, owa, einfoch, hoid, waun, hob, siag, mocht, kan, afoch, ghobt, woa, ana, ois, hobi, voi, najo, obwoi, laung, haum, amoi, fia, faungt, oiso, kema
Cluster 3 (Austrian Bavarian, 29 locations, 174k threads): sowos, oba, owa, nu, einfoch, hoid, waun, hob, oaned, siag, wiakli, mochn, gmocht, kan, fia, afoch, ghobt, woa, freind, ana, aundare, ois, oama, hobi, kinan
Many of the prototypical words from cluster 3pr (oba, owa, einfoch, hoid, waun, hob, siag, kan, afoch, ghobt, woa, ana, ois, hobi) are still prototypical for the Austrian cluster. Therefore, we can classify them as indicative of Austrian Bavarian (though they might be present in Bavaria as well), whereas the other words (mocht, voi, najo, obwoi, laung, haum, amoi, fia, faungt, oiso, kema) are replaced by words more pertinent to the Austrian community (see Map 12). While this distinction is not selective (see for example mocht ‘does’ in cluster 3pr that is an inflected form of mochn ‘do’ in cluster 3, or the examples of l-vocalization in both lists, e.g., obwoi ‘although’ vs. hoid ‘just, simply’), it still suggests that Austrian and Bavarian words are prototypical in their respective community.
Word maps for oiso (left) and brezn (right).

Cluster 8 (German Bavarian, 35 locations, 182k threads): techfak, schwarz ritter, nbg, göggingen, rgbg, brezn, dult, sax, haunstetten, frauentorgraben, mhwmk, ingolstädter, techfucked, augsburger, nürnberger, dutzendteich, hochzoll, kuhsee, pfersee, lässt, deshalb, jahninsel, plärrer, tennenlohe, gerade
In contrast, cluster 8 contains only Bavarian locations, but hardly any dialectal forms, except for brezn ‘pretzel’, a well-known Bavarian bakery product, and dult ‘fair, funfair’. Apart from that, the Bavarian subsample shows references to locations (göggingen, rbgb ‘abbreviation for Regensburg’, frauentorgraben ‘a street in Nuremberg’, plärrer ‘a place in Nuremberg, also the name of a local fair’, dutzendteich ‘lake in Nuremberg, pfersee ‘a quarter of Augsburg’), user groups (ingolstädter, augsburger), or facilities (techfak ‘technical faculty’, schwarzer ritter, sax ‘names of pubs’).
Comparing the three prototype lists, we see that for both Bavarian and Austrian Jodel users there is a tendency to use dialectal words in written digital communication. This tendency is stronger in Austria, demonstrated by the fact that all new items for cluster 3 are common Austrian Bavarian dialectal forms, but it gets overruled by the influence of place names, local references, and even standard German items in the Bavarian cluster. This distinction is likely linked to thematic and linguistic routines of the different Jodel communities, thereby underlining the importance of region-specific (or exclusive) words for the constitution of the clusterings.
3.8 Fifteen Clusters
In the 15-cluster solution, we see four important changes (Map 13):
1. Most of the Northern German locations are now split into a Northwestern (purple dots) and a Northeastern part (brown dots). The only Western city still in the Eastern part is Kassel. Unlike for Würzburg and Augsburg, we do not find an influence of students from the Eastern German federal states at the University of Kassel–their share is below 5%. Most of the students in Kassel come from Hesse, Lower Saxony, and North Rhine-Westphalia (Hessisches Statistisches Landesamt, 2018). Also, regional commuting does not orient to the east but to the north and south (Bundesagentur für Arbeit, 2018). Linguistically speaking, this clustering corresponds to the dialect division in Lameli (Reference Lameli2013), though (see Map 1) Kassel is subsumed under the Eastern Middle varieties Thuringian and Saxonian. However, the prototypical words do not suggest such a regional linguistic affiliation.
2. The Moselle Franconian locations (yellow dots) form a separate cluster, as opposed to Western Baden-Württemberg + Franconia on the one hand and the Rhine-Main area on the other. In this case, we find evidence for an increase of regional lexical items prototypical for the user community (together with an increase in regional and local place references of course). The prototypical words for this small cluster (only 16 locations and 64k threads) contains many regional variants imitating phonological features: gudd ‘good’, saarbrigge ‘Saarbrücken’, eijo ‘sure’, awwa ‘but’, bissjen ‘a bit’, and schwenker, a specific type of barbeque grill used regionally).
3. Cluster 1, containing all of German-speaking Switzerland and Lugano, is split into several local clusters grouped around Switzerland’s main cities: Basel (pale green dots), Zurich (lemon dots), and Bern (marine blue dots). Lugano is within the Zurich subcluster. Additionally, we see a subcluster that only contains three locations (skyblue dots), Chur, Landquart, and (the district) Plessur in the Eastern part of German-speaking Switzerland. In this region, the Rhaeto-Romanic language is spoken, though German is still relatively common (Lesław, Reference Lesław2015). Apart from this, we see another cluster (violet dots) around the cities of Aarau and Luzern between the Basel and the Zurich cluster.
Fifteen-cluster solution.

We take a closer look at the most typical lexical items for the Swiss-German subclusters. Traditionally, dialect maps in Switzerland have been mostly restricted to individual maps for words, phonetic features, or morpho-syntactic constructions (Scherrer & Stöckle, Reference Scherrer and Stöckle2016) due to unclear spatial structures. While we cannot claim any completeness or linguistic validity, our method does afford us the opportunity to investigate larger regional clusters in Switzerland based on linguistic city representations.
Cluster 1 (German-speaking Switzerland & Lugano, 46 locations, 99k threads): gaht, wüki, nöd, besch, emmer, nor, au nöd, verstahn, muen, wükli, dänn, vode, hett, chan, rechtig, staht, sösch, abig, mached, isch de, lüüt, nanig
– Zurich cluster (22 locations, 49k threads): gaht, wüki, nöd, nödmal, vo de, au nöd, verstahn, chan, muen, wükli, gahsch, dänn, vode, hett, isch au, demit, chönd, staht, mached, eifach, abig, isch de, isch scho, git, lüüt
– Basel cluster (8 locations, 21k threads): goht, sehni, drnoch, griegsch, syy, keini, usseht, sunsch, miehsam, mol, iebig, öbbis, miesst, au nid, joor, drugge, kha, unseri, friener, isch e, kei, sälbr, joohr, priefig, bitz
– Bern cluster (5 locations, 20k threads): geit, viu, gloub, auso, aues, ig, när, ds isch, itz, aube, aui, geng, iz, vilech, ke, ds, nidmau, schnäu, froue, u, ig ha, u när, würklech, angeri, verzeu
– Aarau/Luzern cluster (8 locations, 10k threads): esch, ond, vell, besch, ech, nor, emmer, au ned, dech, wörkli, wechtig, mech, rechtig, norno, zuekonft, beni, gfonde, brengt, sösch, wössed, drom, esh, dorom, fende, ergendwie
– Chur cluster (3 locations, 4k threads): miar, diar, dia, leba, werda, aswia, wia, aswo, iar, fraua, akli, liabsta, passiart, könna, niamert, muassi, ihar, kriaga, froga, nögsta, muass, vergessa, eba, glauba, guati
Comparing the five sublists of prototypical words to the list for cluster 1 shows several interesting aspects of dialectal variation in written Swiss-German. First, despite limited geographic extension and number of conversations, the prototypical words are distinct for all five subclusters; i.e., the Swiss varieties do not share prototypes, a feature we have seen for many of the clusters in the GSA. Since all prototypes contain common words of everyday communication, we have strong reason to believe that the five subclusters represent regional linguistic differences between the five regional user communities.
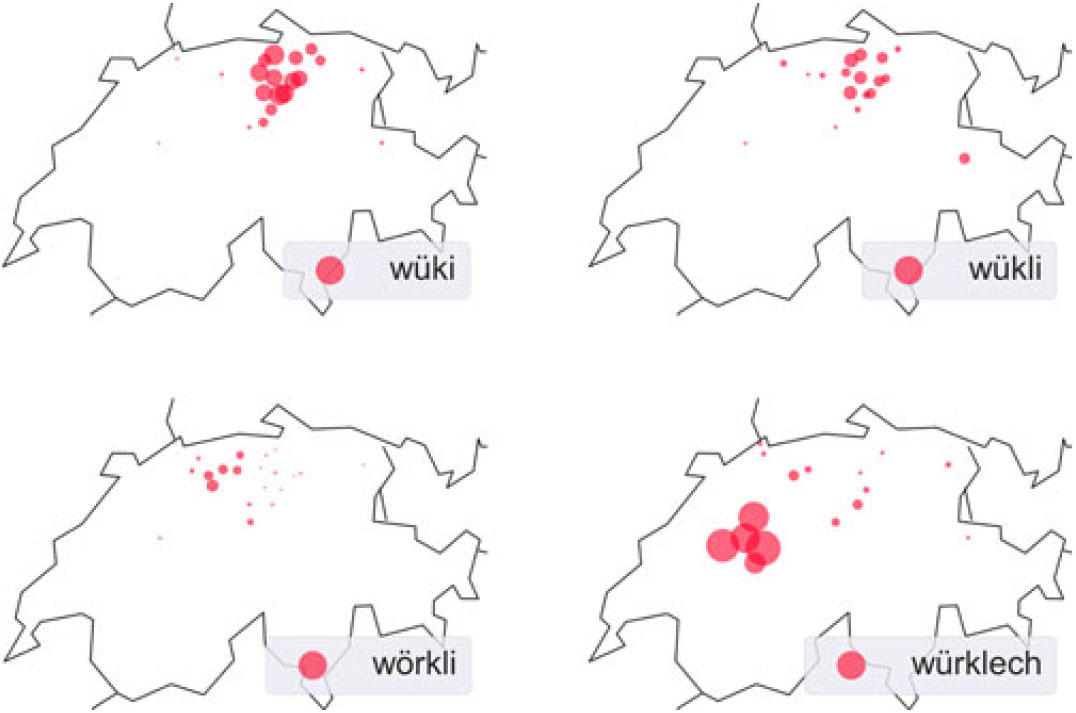
Second, comparing the prototypes for cluster 1 with the subclusters, we find that the Zurich cluster has the biggest impact on cluster 1: several prototypical words from the Zurich cluster are also in cluster 1, which is not the case for the other subclusters. Given that the Zurich cluster makes up half of the Swiss-German data, this dominance is not surprising. Third, comparing the prototypes for the five subclusters, we find dialect equivalents of standard German words that represent characteristic regional variants, e.g., gaht (Zurich), goht (Basel), geit (Bern) for geht ‘goes’ or wüki (Zurich), wükli (Zurich), würklech (Bern), wörkli (Aarau/Luzern) for wirklich ‘really’ (see Map 14). These fine-grained distinctions correspond to the prevailing approach of studying Swiss-German variation via feature-/word-based maps. Fourth, we find evidence for regional linguistic features that contribute to the regional linguistic style profile of the different communities. For example, prototypes in the Chur cluster tend to end with either -a or -ar as suffixes. Similarly, the Bern cluster contains several examples of the idiosyncratic regional l-vocalization, as in viu ‘viel’ (‘a lot’), auso ‘also’ (‘well, so’), aues ‘alles’ (‘everything’). These findings suggest that regional variation is the most pertinent (and therefore prototypical) linguistic resource for Swiss-German Jodel users’ writing styles. As such, it can also be seen as an example for “the strength of weak ties” (Granovetter, Reference Granovetter1973) in social practice: the multitude of micro-level interactions in an anonymous forum fosters the emergence of a characteristic macro-level writing style for Swiss German Jodel users as opposed to the rest of the GSA.
Regional variants of ‘wirklich’ in Switzerland: wüki, wükli, wörkli, and würklech.
4. Discussion
4.1 Corpus Structure and Linguistic Resources
The overall aim of this study was to draw the connection between language practice and regional (linguistic) structures based on a large corpus of online communications. The previous chapter showed that we can indeed detect (and interpret) many of the structural differences in our data and link them to linguistic and other aspects of everyday cultural practice. Still, in order to move beyond the bare analysis of the regional clusters found in the data, we need to take a closer look at the different factors structuring our data. In this section, we discuss some aspects of the Jodel environment, and go through some regionally defining characteristics of linguistic resources.
As mentioned previously, Jodel data is characterized by four aspects: its anonymity, user demographics, network regionality, and the (individual and group-specific) stylistic resources of the users. The anonymity impacts the type of analysis we can perform, but also encourages users to discuss topics we would otherwise not find in (publicly available) online communication and traditional sociolinguistic studies. Discussions often revolve around private or even intimate issues, especially relationship- and sex-related topics. This indicates the kind of interaction that dominates Jodel communications: informal communication that normally happens between peers, with not only thematic, but also linguistic informality (e.g., written dialect in Austria).
The demographics of the Jodel community shape the structure of the data. Strictly speaking, the exact demographics of the community are unknown, because of user anonymity. However, given the rise of Jodel as “campus chat”, and the thematic spectrum in the threads, it is likely correct to assume a young adult audience. This in turn means that the language practice we observe represents the last step in the development of language dynamics in German. That is, the users’ linguistic repertoires likely contain mainly standard German (and maybe regiolects), but no dialects, except for users from Switzerland, Austria, and some parts of Bavaria.
The regionality of the networks (based on the 10 to 15km reach of each post), inevitably structures the data, especially given the sparsity of our location raster. This effect is clearly visible in the geographic distribution for most cities: several smaller locations surrounding one of the larger cities. On the one hand, we can therefore expect our data to be highly pre-structured by the regional binding of Jodel communications: users will resort to existing institutionalized resources. On the other hand, interaction in regionally-bound communities fosters the coining of group-specific words for specific purposes (e.g., lörres, möppes) as well as technical terms (e.g., @vj) and writing conventions (e.g., the regional variants gaht, goht, geit ‘goes’ in case of the Swiss-German dialects).
That being said, individual and group-specific stylistic resources also structure the data, especially with respect to the projection of specific linguistic (and therefore social) identities online. We see the influence of various linguistic resources that contribute to both individual styles (which we did not analyze in this study) as well as community-specific style profiles (Coupland, Reference Coupland2007). The analysis showed that there are regional communities which use dialectal or regiolectal forms (e.g., Switzerland, Austria), while others can be characterized by their use of app-specific pragmatic markers to respond to specific posts (especially users in the middle and southern part of West Germany).
The many individual choices the users make aggregate into group-specific writing styles. Compared to regional varieties, they depend on various linguistic resources, including lifeworld orientation terms (i.e., place and location names, recontextualized sociocultural references), medium-specific organization terms (i.e., pragmatic markers for author reference), traditional regional items (i.e., dialectal and regiolectal words), community-specific regional items (i.e., coinings for specific thematic aspects, hashtags), typical items of online communication (i.e., emoji, logograms, or rebus writing), foreign-language and borrowed items, and standard German items.
– Lifeworld orientation terms include words that refer to places, locations, facilities, or specific sociocultural contexts/items of particular importance for the structuring and interconnectedness of regional communities. Their prevalence is easily explained by the fact that these terms refer to elements in the lifeworld like cities, administrative districts, universities, local user groups, or sociocultural items (like football clubs). These terms thereby create semantic frames of reference for speech acts to contextualize the users’ communications and connect them to different aspects of lifeworld practice.
– Medium-specific organization items: The relatively small group of Jodel-specific communication markers (vj, @vvj, oj ‘original Jodler’ etc.) contributes significantly to the overall linguistic structure of the community. They serve concrete discourse-pragmatic functions that enable users to answer directly to previous posts and authors, despite their anonymity. As such, they have to be learned by new users in order to efficiently communicate. These markers seem to be bound to a regional community in western middle Germany but are also spread across larger areas of the GSA. However, these terms will likely soon change dramatically, since a recent update to the app (late May 2017) assigns each unique participant in a conversation an anonymous ID other users can reply to (e.g., @3). We therefore expect terms like vj and @vvj to disappear in a follow-up study, and to be replaced by the ID references. Map 15 shows that they are already established in the entire community shortly after their introduction.
– Traditional regional items: For some regional communities in our corpus, using dialectal or regiolectal forms is constitutive for the overall structuring of communication practice on Jodel. This is especially true for Switzerland, where the regional dialects are the default writing styles for all interaction (in German), but also for regional forms in the cluster that contains all Austrian locations. Given that our model cannot detect stop words or place names in regional varieties (unlike their standard German equivalents), this is an artifact of data preprocessing, but one that holds for any regional community with regional language use. Indeed, other regions are partly defined by the use of regional words as well (Bavaria, parts of Western Middle and Upper Germany), but mesh there with other linguistic resources to structure the data.
– Community-specific regional items: This group of items constitutes the digital equivalent of traditional regional lexis, as they are thematically motivated and arise out of the interaction with other users in the Jodel community. In some cases (e.g., lörres or möppes) they originate from regional varieties, and get recontextualized (lörres) or re-semanticized (möppes) in the wider Jodel community. For example, we find several examples of word formation and word play with lörres (and also möppes) in our data like @lörres ‘reference to someone using lörres in a previous post’, singlelörres ‘a single male person’, lörres22 ‘male user of 22 years’, justmöppesthings, or einsames möppes ‘lonely female user’. Other items arise as discourse labels, such as hashtags for entire conversations, e.g., dummwiekarlsruhe ‘stupid like Karlsruhe’, dermitdemsonnenbrand ‘the one with the sun burn’, flirtenaufnordhessisch ‘flirting in Northern Hessian’, or aufdemwegzurarbeit ‘on my way to work’. These words also reflect the thematic scope of many Jodel conversations. They highlight how people creatively use their linguistic resources to innovate community practice by dint of regionally-bound, thematically-motivated, and socially-binding words for specific regional communication purposes.
– Items of online communication: As with every other social medium, we find online-specific linguistic resources such as abbreviations (jmd ‘jemand’, ‘somebody’), acronyms (uds ‘Universität des Saarlandes’), rebus writing (3st ‘dreist’ ‘shameless’), simple and complex emoji constructions (
 , , ) or logograms (= ‘equals’). None of these items are specific to the Jodel community, but might be used, combined, or recontextualized in community-specific ways, especially emoji or abbreviations (e.g., license plate codes), thus contributing to regional writing styles of Jodel communities.
– Foreign-language and borrowed items: Within the German-based user communities we find hardly any prototypes representing lexical borrowing or loanwords apart from sparse evidence like the use of lelek ‘nightjar’ in the Rhine-Main-area: In the list of 100 prototypical words for this cluster (see Section 4.2) we find two more examples for this resource, i.e., akhis ‘brother’ and sharmut ‘bitch’, both of which are common ethnolectal variants in German that originate from Arabic.
– Standard German items: For many clusters, standard German forms (including colloquial variants like gucken ‘look’) contribute considerably to the style profile of a community, especially those with many locations or those spread across larger regions of the GSA. Use of standard German generally constitutes the absence of other linguistic resources in the formation of community-specific style profiles. However, the contribution of standard German lexical items defines an important characteristic, at least in some regional communities where regiolects have already replaced the old local base dialects (see Section 2.1).
 ,
 ,
 ) or logograms (= ‘equals’). None of these items are specific to the Jodel community, but might be used, combined, or recontextualized in community-specific ways, especially emoji or abbreviations (e.g., license plate codes), thus contributing to regional writing styles of Jodel communities.
Word maps for vvj (left), @1 (middle) and @3 (right).
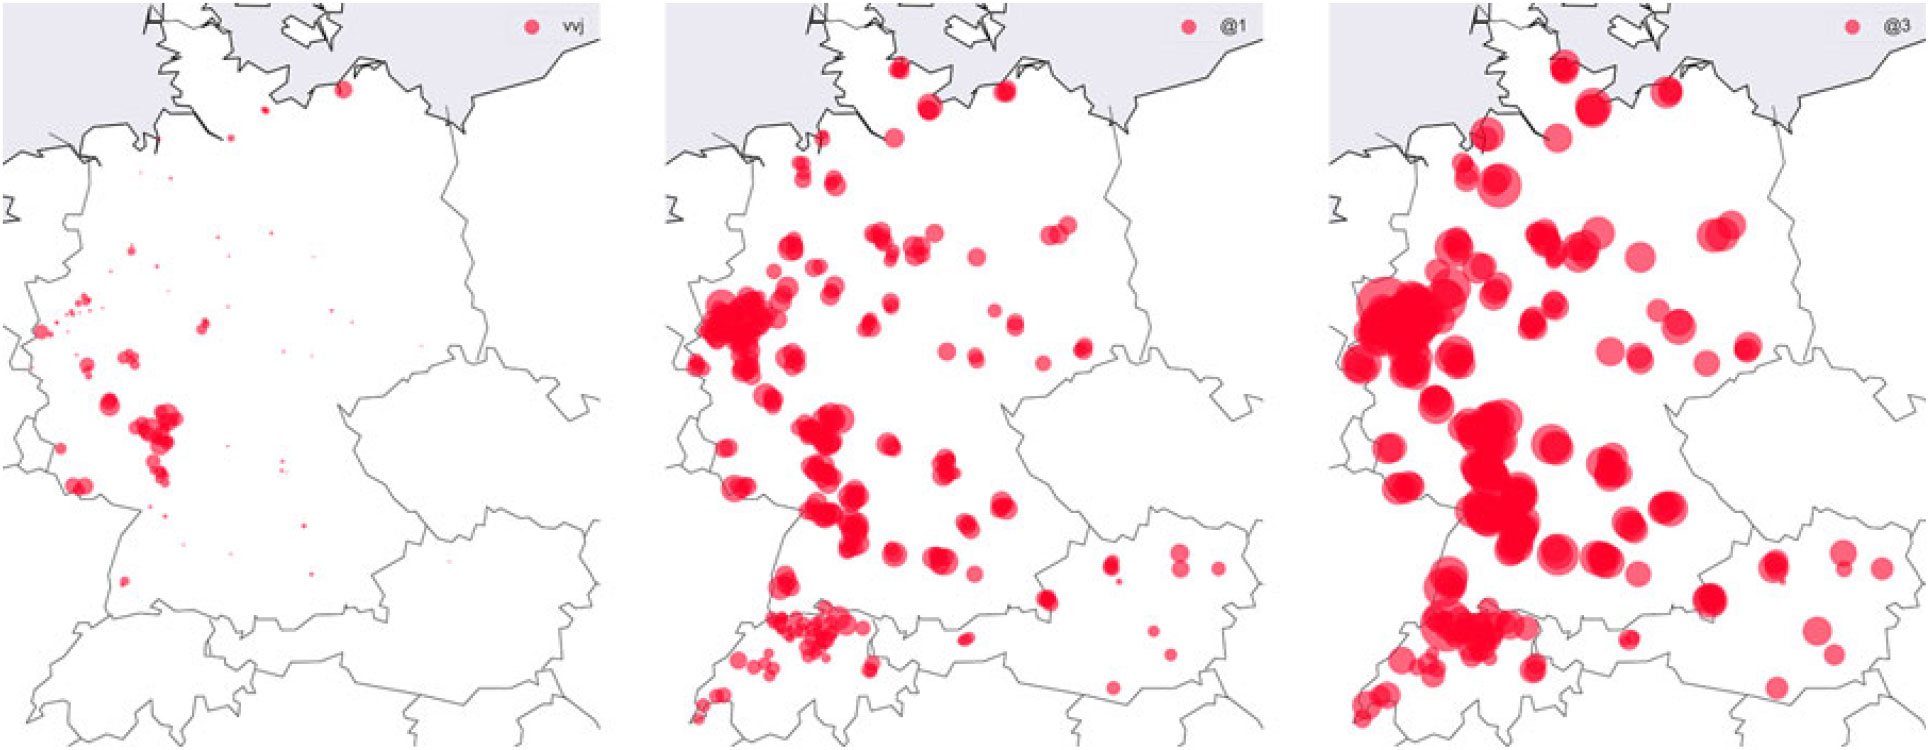
Together, these resources reflect the sociolinguistic structure of language practice in the Jodel community. Regional clusters can therefore be characterized by their use, combination, and mesh-up of these different linguistic resources.
4.2 Linguistic Resources and Style Profiles
Based on the idea of community-specific style profiles, we re-examine the prototypes of the 15-cluster solution. For each cluster, we classify the top 100 prototypical words into one of the seven linguistic resources identified in the last section. This results in style profiles for each regional user community as shown in Figure 3.
Style profiles for the 15 regional clusters (see Map 13 above).
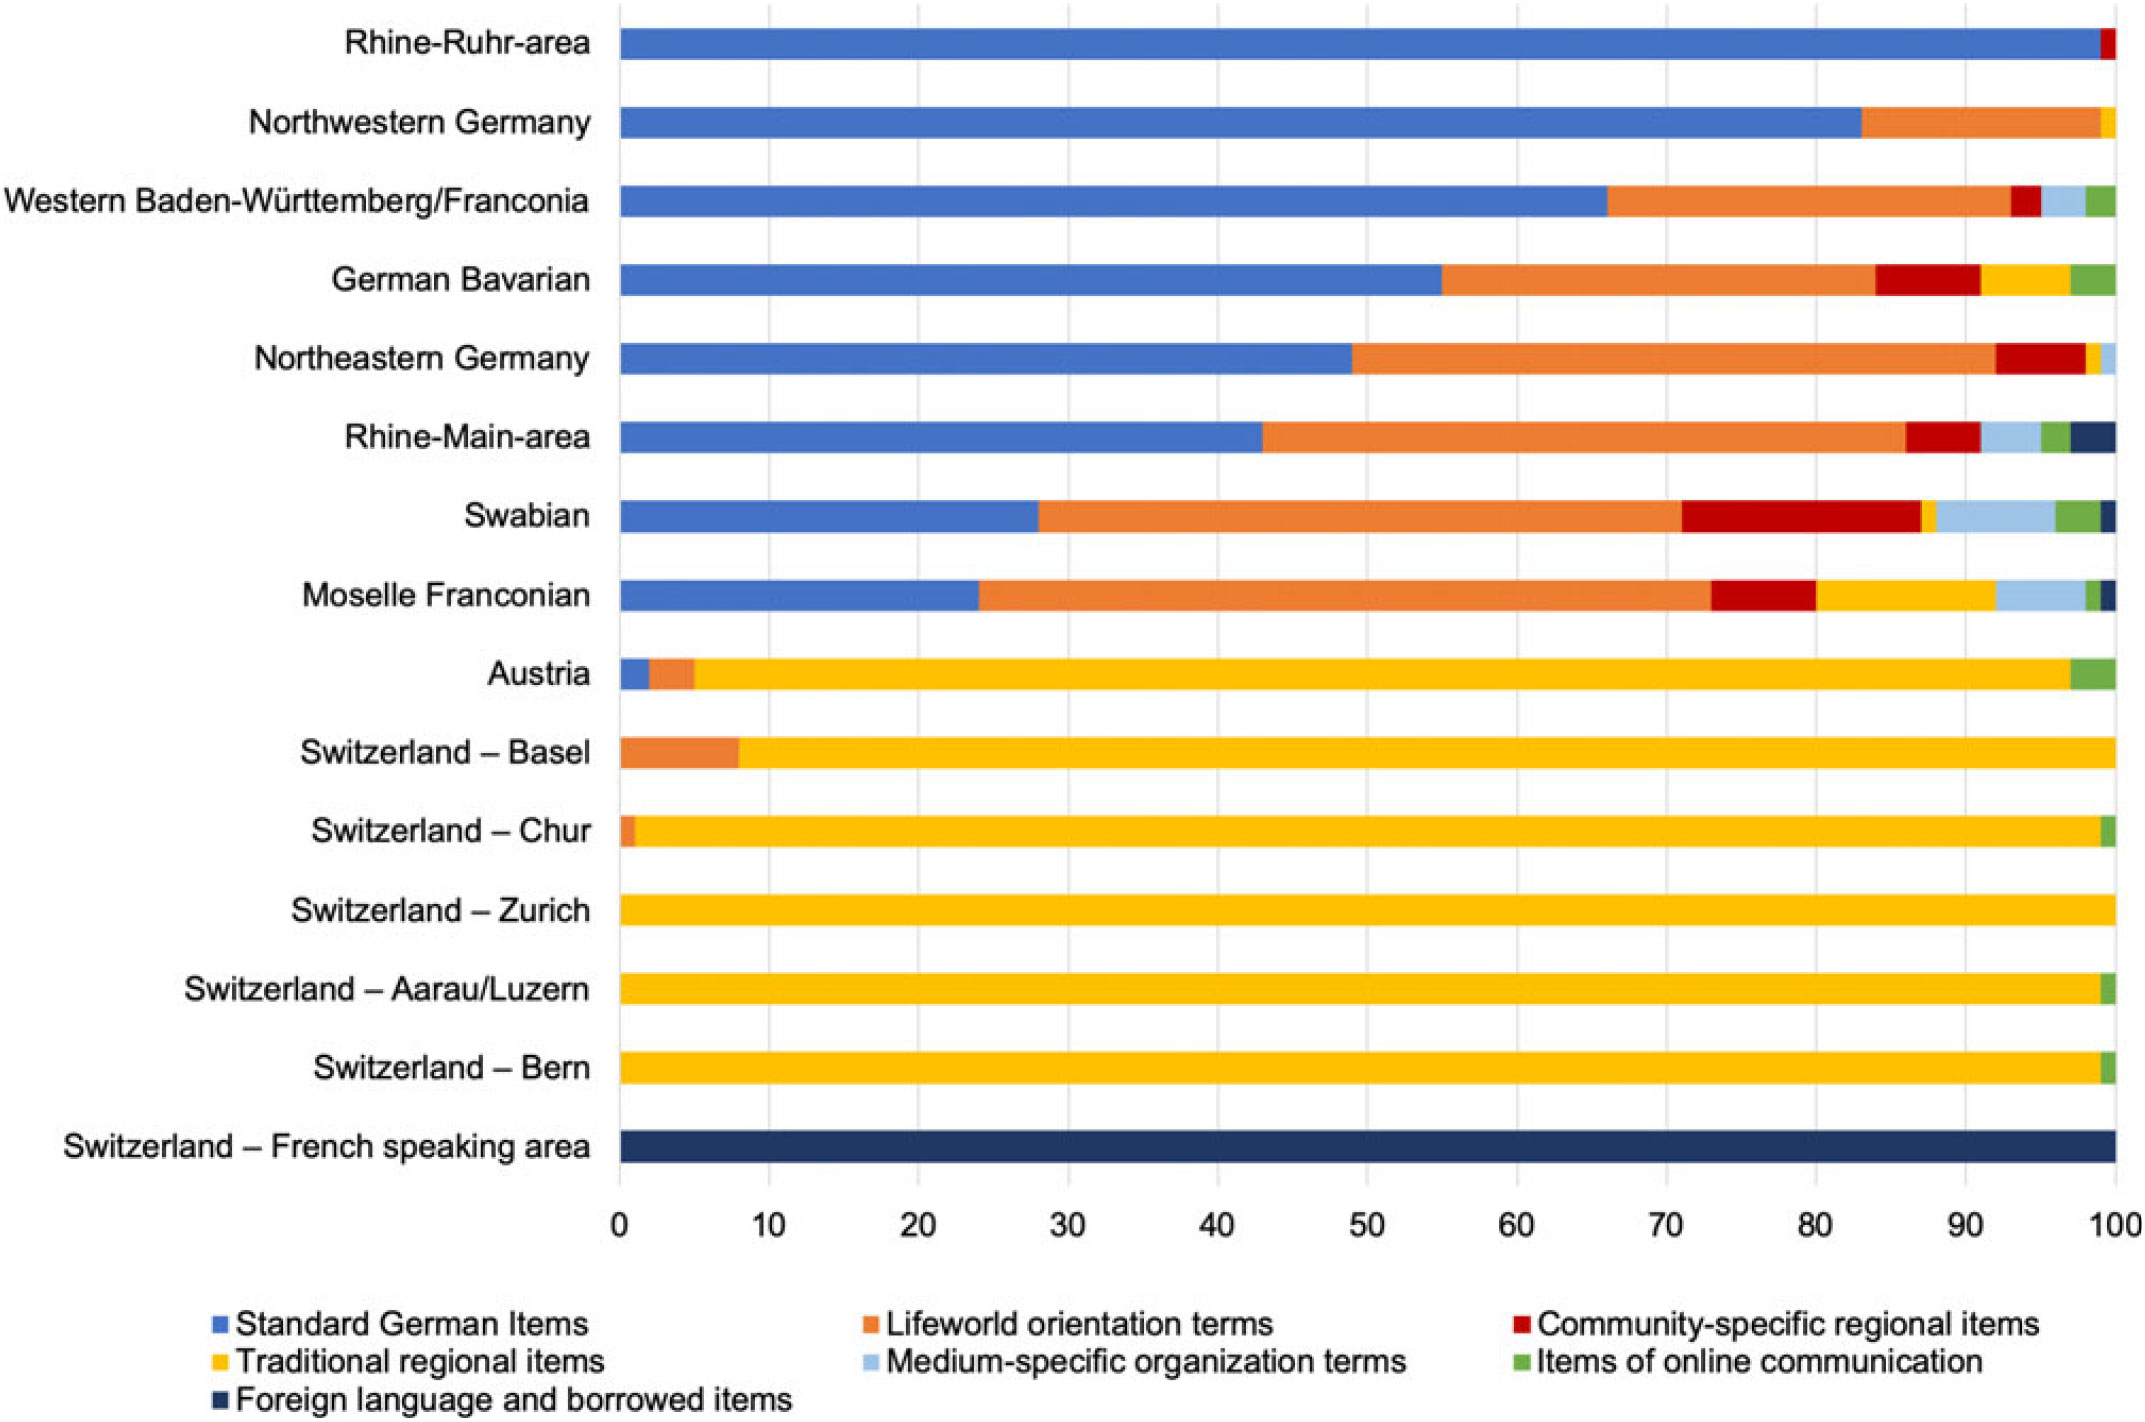
Three linguistic resources drive most of the internal structure of the style profiles: standard German items, lifeworld orientation terms, and traditional regional items. Regional language distinguishes Austrian and Swiss communities from their German equivalents: regional forms are the main (and sometimes only) resource characterizing community prototypes. For the German communities, we see an anti-correlation between the use of Standard German items and lifeworld orientation terms: the more Standard German prototypes we find in a regional community, the fewer lifeworld orientation terms contribute to the community style profile. Apart from these three resources, the use of community-specific regional items is characteristic for some communities.
Especially the western middle- and southern-German communities are characterized by their typical use of medium-specific organization terms. The Rhine-Main-area is the only regional community with at least some influence of foreign language and borrowed items (apart from French-speaking Switzerland of course). Even though the analyzed prototypes are just a fraction of the total vocabulary, we find distinct style profiles that characterize regional communities in relation to our data model. Note again that the profiles are influenced by the number of threads and density of locations/interactions (e.g., northwestern Germany vs. Rhine-Ruhr-area), the default-variety choice (e.g., French-speaking Switzerland vs. Switzerland/Austria vs. Germany), the regional prototypicality of the vocabularies (e.g., @3 vs. @vj), and the size, scale, and lifeworld anchoring of the different stylistic resources. For example, compare standard German, a highly institutionalized resource with extensive vocabulary usable for all lifeworld purposes, to the community-specific organization terms, a newly established resource restricted to few items and purposes usable only in a specific communicative context. And so, while the size difference of the associated communities makes them directly incomparable, the style profiles can still be used as an overall diagnostic tool. They provide evidence for (dis)similarities between regional user groups, especially for the smaller and less institutionalized resources. For example, the use of medium-specific organization terms is a shared characteristic between the communities in the south west of Germany. As we have seen in Map 4, terms like @vj, möppes, and lörres seem to be characteristic for these communities, from where they may spread to other regional communities in the entire GSA. Such communities foster the establishment and spread of community- and medium-specific vocabulary, and, therefore, may substantially influence the structuring of linguistic practice in the entire Jodel community.
4.3 Methodology
While neural networks have become dominant in engineering disciplines in recent years due to their superior performance, they have also been criticized for their need of large data sets, their sensitivity to parameter settings, and the difficulty of interpreting the elements of the final models. Within the class of neural networks, however, representation learning is a comparatively safe and simple approach. In our case, the amount of available data, the small number of parameters, and the possibility to learn linguistically-based representations of cities justify the choice of model. In addition to being relatively simple and well-understood, there exists literature on optimal parameter settings. However, in any quantitative approach, the methodological decision we make influences the results we get. Therefore, we discuss some methodological choices relating to data collection, processing, and visualization.
A main influencing factor of our methodology is its dependence on large data sets: we see diverging results for cities and regions with insufficient coverage. The most prominent cases are Lugano, in the predominantly Italian-speaking southernmost part of Switzerland, and the French-speaking area in Switzerland. Both should theoretically be dissimilar enough to the other (German-speaking) cities to merit its own cluster. However, given the relative uniformity in most of the rest of the GSA, the differences between those two areas and German-speaking Switzerland is still smaller than between all of Switzerland and the rest. To some extent, these distinctions are established during preprocessing: the tools we use are set up for standard German, so we are not able to achieve the same accuracy for dialects or foreign languages. However, since the same holds for regional items in the German user communities, this effect does not reduce the meaningfulness of the distinctions.
A second methodological aspect relates to the geographic raster and data collection. While location activity and sequential access through the API are good reasons to limit data collection to bigger cities, this choice affects the coverage: we do not collect any data for less populated areas, while data from higher population-density regions dominate. The resulting imbalance affects the clustering and style profiles of the regional user communities, for example by changing the ratio of standard German to lifeworld orientation terms within a cluster.
Similar effects hold for several other choices: the removal of named entities and stop words during preprocessing, which affect vocabulary size and the learned representations; the down-sampling of frequent words during representation learning, which impacts prototypes; the assumption that geographically close places are also linguistically more similar, which favors local coherence; and the limitation to cities with more than 200 threads during clustering, which affects cluster solutions (including more locations leads to fuzzier clusters). For all of these decisions, a grounding in linguistic theory is just as important as an understanding of the algorithmic effects. Luckily, we found that many of these choices are fairly robust: the final result does not depend on a narrow range of optimal parameter settings, but do emerge under several conditions. Still, awareness of these potential confounding factors helps address them head-on.
Regarding our combination of data-driven and interpretation-driven methods, we conclude that it confers crucial advantages for our type of study, because both methods contribute complementary types of resources. The learned representations can be used to visualize the continuum, find the cluster solutions, and the prototypes, while the qualitative approach allow us to interpret the model output and estimate its quality. The quantitative clustering approach allows us to leverage large data sets and forego linguistic presuppositions, while the qualitative analysis of regional user communities and style profiles relies on well-established knowledge about the sociolinguistic and sociocultural structure of language use in practice. The results demonstrate that a judicious application of both approaches can provide unique insights that would be impossible when using either approach in isolation.
By judicious, we mean that we need to pay attention to both technical details (such as the parametrization of the clustering algorithm, or the representation of geographic proximity) and sociocultural factors, such as regional mobility or sociocultural orientations (see the example of the composition of student populations in Würzburg vs. Augsburg above).
5. Conclusion
In this paper, we have investigated the automatic detection of regional patterns in large amounts of young adults’ online communications in the German speaking area. We collected a corpus of 2.3 million threads from the anonymous chat app Jodel and fit a representation learning model on the data. The resulting vector representations of words and cities allow us to visualize dimensions of variation, and to use Ward clustering to detect regional patterns.
Our analysis reveals that the regional clusters represent distinct community-specific language practices in Jodel that are regionally bound and fed by different stylistic resources, including community- and medium-specific vocabulary, lifeworld orientation terms, traditional regional items, and standard German. These elements can be used to describe characteristic style profiles of regional user communities. Most notably, we find a difference between user communities that employ regiolects or dialects online (German-speaking Switzerland, Austria, and—to some extent—Bavaria) and communities that are mainly characterized by standard German lexis and the use of region-specific lifeworld orientation terms. The establishment and spread of Jodel-specific linguistic elements can be explained as the result of processes of sociocultural structuration in practice (Purschke, Reference Purschke, Evans, Benson and Stanford2018).
In sum, the distinct regional structures mirror region-specific language practice (and style profiles) of the Jodel community. Remarkably, our quantitative model is able to detect and cluster such regional user groups based solely on their written communications in Jodel, without any knowledge or assumptions about regional language differences in the GSA. Both the clear regional clustering and the close linkage with the German regional languages indicate the viability of our approach, and its applicability to similar problems (cf. Hovy et al. Reference Hovy, Rahimi, Brooke and Baldwin2019). The overall structure of the clusters closely matches the traditional division of German dialects. Diverging cases (Kassel, Augsburg, Würzburg, Switzerland) can be explained through external structures, e.g., national borders, areas of socioeconomic exchange, regional mobility, sociocultural orientation, and location/conversation density. Our study demonstrates that the combination of quantitative and qualitative analysis methods can uncover effects in large-scale data, provide the basis for in-depth analyses, hypothesis-generation, and corroboration of existing hypotheses. Our work advances the idea of a complementary use of computational linguistics and sociolinguistics to their mutual benefit. However, we also discuss the need for both disciplines to make informed decisions regarding the processing, analysis, and visualization of the data.
Our results offer a promising starting point for future research in this vein, especially the linguistic dynamics of communities (spread and vanishing of community- and medium-specific items), aspects of discourse organization, the spectrum of topics covered in the threads, and community conventions for regiolectal writing. Future studies should also consider a revalidation of the clustering with a second data set and denser location raster. Another aspect relates to the notion of ‘regional’ as used in the analysis of language variation. As our study reveals, not only dialect vocabulary is bound to regional user communities: other linguistic resources, like lifeworld orientation terms or community-specific terms, are constitutive for regional user groups and style profiles as well. Our results therefore not only invite us to reevaluate established concepts like ‘regiolect’ in the digital era, but also to rethink the concept of regionality as a whole. As we have seen, the structure and specificity of language use in a user community depends on different types of stylistic resources reflecting different aspects of a specific ‘regional’ sociocultural orientation: Regional user communities on Jodel are constituted not only by how they write, but also by what they talk about, i.e., their entire sociocultural orientation.
Acknowledgements
We would like to thank Jannis Androutsopoulos, Alfred Lameli, and Dong Nguyen for reading and commenting on a draft version of this paper. We also would like to thank two anonymous reviewers for their helpful remarks. Christoph Purschke is a member of the Institute for Luxembourgish Language and Literatures at the Faculty of Humanities, Education and Social Sciences (FHES). Dirk Hovy is a member of the Bocconi Institute for Data Science and Analytics (BIDSA) and scientific director of the Data and Marketing Insights (DMI) unit.



