Introduction
An important question in bilingualism is whether the formation of phonetic categories is affected by exposure to two languages that treat them differently. Studies of cross-language speech perception have found that non-native listeners often show poor discrimination and identification of speech sounds that are non-contrastive in the native language (e.g., Werker & Tees, Reference Werker and Tees1984). The performance on non-native contrasts is determined, in part, by the relationship of the speech contrasts to the listener's native phonology (e.g., Best, Reference Best and Strange1995) and to the task (Strange & Shafer, Reference Strange, Shafer, Hansen Edwards and Zampini2008). For example, American English speakers have difficulty perceiving French front rounded vowel [u/y], [y/ø] and [ø/œ] contrasts (Gottfried, Reference Gottfried1984) and Japanese speakers have difficulty perceiving the English [r/l] phonemic contrast (Strange & Dittmann, Reference Strange and Dittman1984) because these speech contrasts are perceived as members of one category by the target non-native groups.
In addition to the studies on speech perception by naïve listeners, the effect on speech sound categorization has also been extensively studied in populations who are exposed to a second language (L2). A question arising from this research is how bilingual exposure affects the development of speech perception when the two languages differ in their phonological inventories. There are at least three alternative models for how bilinguals perceive speech sounds in their two language: (i) bilinguals will favor one system over the other (e.g., Cutler, Norris & Williams, Reference Cutler, Norris and Williams1987); (ii) bilinguals may make compromises between the two systems (e.g., Williams, Reference Williams1977); and (iii) bilinguals adjust their phonemic categories to the appropriate ones based on language context (Elman, Diel & Buchwald, Reference Elman, Diehl and Buchwald1977; Gonzales & Lotto, Reference Gonzales and Lotto2013). The best-fit model, however, is likely to be influenced by additional variables. Age of acquisition (AoA) and amount of use of the second language are highly influential in determining the relationship between L1 and L2 phonetic inventories in the adult bilingual (Birdsong, Reference Birdsong2006; Flege, Reference Flege and Strange1995).
Most studies of L2 acquisition have dealt with individuals who start learning their L2 as adults (Flege, Bohn & Jang, Reference Flege, Bohn and Jang1997; Flege, Munro & Fox, Reference Flege, Munro and Fox1994; Munro & Derwing, Reference Munro and Derwing1995). Considerable evidence suggests that if individuals do not receive early input from a language they are likely to develop a non-native accent in the production of the second language (Cook, Reference Cook1995; Krashen, Long & Scarcella, Reference Krashen, Long and Scarcella1979; Lenneberg, Reference Lenneberg1967). Similarly, there are a number of studies showing that later exposure to a second (or third) language leads to a speech perception system different from that of native monolingual users of the same language. For example, a study using behavior and ERPs to test speech discrimination in native monolingual Finnish-speaking adults, native monolingual English-speaking adults and Finnish–English advanced bilingual adults (English majors at university level, who presumably learned Finish as the L1) found that the Finnish–English-speaking group showed smaller MMNs in English compared to those of the native English control participants (Peltola, Kujala, Tuomainen, Ek, Altonen & Näätänen, Reference Peltola, Kujala, Tuomainen, Ek, Altonen and Näätänen2003). The findings from these studies, taken together, are consistent with claims of an L1-entrenched phonological system in L2 learners who are exposed to the L2 after approximately 10 years of age (Baker, Trofimovich, Mack & Flege, Reference Baker, Trofimovich, Mack, Flege, Skarabela, Fish and Do2002; Flege et al., Reference Flege, Bohn and Jang1997, Reference Flege, Munro and Fox1994; Flege & MacKay, Reference Flege and MacKay2004; Gottfried, Reference Gottfried1984; Hisagi & Strange, Reference Hisagi and Strange2011; Mack, Reference Mack1989; Levy & Strange, Reference Levy and Strange2008; Munro & Derwing, Reference Munro and Derwing1995; Nishi, Strange, Akahane-Yamada, Kubo & Trent-Brown, Reference Nishi, Strange, Akahane-Yamada, Kubo and Trent-Brown2008; Pallier, Bosch & Sebastián-Gallés, Reference Pallier, Bosch and Sebastián-Gallés1997; Schmidt & Flege, Reference Schmidt and Flege1996).
Studies examining speech perception of adults exposed to two languages as infants or toddlers indicate that learning the L2 before five years of age results in L2 speech production that is largely indistinguishable in accent from monolingual controls (e.g., Flege, Birdsong, Bialystok, Mack, Sung & Tsukada, Reference Flege, Birdsong, Bialystok, Mack, Sung and Tsukada2006; Yeni-Komshian, Flege & Liu, Reference Yeni-Komshian, Flege and Liu2000). With regard to speech perception, some studies suggest that early bilinguals can shift perception to be optimal for the target language (Elman et al., Reference Elman, Diehl and Buchwald1977; Gonzales & Lotto, Reference Gonzales and Lotto2013; Sundara & Polka, Reference Sundara and Polka2008). Gonzales and Lotto (Reference Gonzales and Lotto2013) showed that perception of a phoneme by Spanish–English simultaneous bilinguals (i.e., both languages learned from birth) would shift to be native-like for the target language. However, other studies that have examined speech perception in early bilinguals suggest that there are subtle differences from monolingual controls. Bosch and Sebastián-Gallés (Reference Bosch and Sebastián-Gallés2003) found that highly fluent Spanish–Catalan bilinguals who learned Spanish first and Catalan second (between three and five years of age) showed poorer perception for a contrast exclusive to Catalan compared to the bilinguals whose first language was Catalan (Bosch & Sebastián-Gallés, Reference Bosch and Sebastián-Gallés2003; see also García-Sierra, Diehl & Champlin, Reference García-Sierra, Diehl and Champlin2009; Guion, Clark, Harada & Wayland, Reference Guion, Clark, Harada and Wayland2003).
These studies of late and early learners of second language suggest that the speech perception systems of younger individuals are more malleable than for older individuals, allowing them to accommodate new sound patterns. A number of models of the development of speech perception, for both first and second language, suggest that as infants, native listeners learn to automatically attend to or weight the relevant cues for perceiving the phonologically significant information of the native language (Jusczyk, Reference Jusczyk1997; Kuhl, Conboy, Coffey-Corina, Padden, Rivera-Gaxiola & Nelson, Reference Kuhl, Conboy, Coffey-Corina, Padden, Rivera-Gaxiola and Nelson2008; Strange & Shafer, Reference Strange, Shafer, Hansen Edwards and Zampini2008; Werker & Curtin, Reference Werker and Curtin2005). However, this system continues to develop into grade school. Nittrouer and her colleagues found that the amount of attention (weight) assigned to various acoustic cues in the speech signal changes as a child gains experience with a native language (Nittrouer, Reference Nittrouer1996; Nittrouer & Crowther, Reference Nittrouer and Crowther1998; Nittrouer, Crowther & Miller, Reference Nittrouer, Crowther and Miller1998; Nittrouer & Miller, Reference Nittrouer and Miller1997). Learning L2 speech patterns in the early years may be superior to learning these patterns in later years because the system is still developing. Processing of speech sounds changes considerably after four–five years of age (see Flege et al., Reference Flege, Birdsong, Bialystok, Mack, Sung and Tsukada2006; Weber-Fox & Neville Reference Weber-Fox and Neville1996). However, it remains unclear whether early bilinguals (learning L2 before five years of age) are different in L2 speech perception from monolinguals and from simultaneous bilinguals.
The task used to measure speech perception in previous studies may also account for different findings with regard to early bilinguals (Garcia-Sierra et al., Reference García-Sierra, Diehl and Champlin2009; Guion et al., Reference Guion, Clark, Harada and Wayland2003; Strange & Shafer, Reference Strange, Shafer, Hansen Edwards and Zampini2008). Discrimination tasks generally produce better performance than categorical or identification tasks, even in non-native participants (e.g., Eimas, Reference Eimas1963; Healy & Repp, Reference Healy and Repp1982; Pisoni, Reference Pisoni1973). It is possible that bilinguals may make adjustments to phonological categories based on the target language, but not under all task conditions (e.g., Hisagi & Strange, Reference Hisagi and Strange2011). In other words, bilinguals may never perform as well as monolinguals as measured by behavioral language tasks. A more precise characterization of bilingual L2 speech perception can be obtained by examining perception and processing of speech using both behavioral and neurophysiological methods, such as event-related potentials (ERPs).
Neurophysiological measurements in speech processing
ERPs are portions of the electroencephalogram (EEG) that are time-locked to a stimulus or event of interest. The EEG is recorded via electrodes placed on the scalp during the delivery of multiple (often repeated) events. The EEG consists of the summation of excitatory and inhibitory post-synaptic potentials generated by the firing of assemblies of neurons in the brain. The portions of the EEG that are time-locked to the events of interest (called epochs) are averaged to obtain averaged ERPs. This averaging improves the signal to noise ratio. The timecourse of information processing can be inferred from changes in the ERP waveforms, usually by measuring amplitudes and latencies of landmark peaks (called components) in relation to the onset of the event of interest.
The ERP component of interest for this study is the Mismatch Negativity (MMN). MMN indexes detection of a change in a stream of sounds, without the requirement of attention, and typically peaks between 160 ms and 220 ms (Luck, Reference Luck2005), although this peak will be later for more subtle changes (Näätänen, Paavilainen, Rinne & Alho, Reference Näätänen, Paavilainen, Rinne and Alho2007). Considerable research suggests that the major generators of MMN are in auditory cortex, with some contribution from right frontal cortex, leading to the frontocentral topography with inversion in polarity (i.e., positivity) at the mastoid sites (Näätänen et al., Reference Näätänen, Paavilainen, Rinne and Alho2007). Researchers have previously demonstrated that the amplitude and latency of the MMN become smaller and later, respectively, as the acoustic difference between two stimuli decreases (e.g., Näätänen, Reference Näätänen1990), and has been observed for speech and non-speech stimuli (Maiste, Wiens, Hunt, Scherg & Picton, Reference Maiste, Wiens, Hunt, Scherg and Picton1995; for review, Näätänen et al., Reference Näätänen, Paavilainen, Rinne and Alho2007). The amplitude of the MMN also reflects the phonemic status of a pair of speech sounds. Specifically, the peak amplitude of MMN was found to be larger or the onset latency earlier for listeners who have had experience with and can categorize a particular pair of speech sounds as members of two different phonemic categories (e.g., García-Sierra, Ramírez-Esparza, Silva-Pereyra, Siard & Champlin, Reference García-Sierra, Ramírez-Esparza, Silva-Pereyra, Siard and Champlin2012; Näätänen, Lehtokoski, Lennes, Cheour, Huotilainen, Iivonen, Vainio, Alku, Ilmoniemi, Luuk, Allik, Sinkkonen & Alho, Reference Näätänen, Lehtokoski, Lennes, Cheour, Huotilainen, Iivonen, Vainio, Alku, Ilmoniemi, Luuk, Allik, Sinkkonen and Alho1997; Shafer, Schwartz & Kurtzberg, Reference Shafer, Schwartz and Kurtzberg2004; Winkler, Kujaha, Alku & Näätänen, Reference Winkler, Kujaha, Alku and Näätänen2003; Winkler, Kujala, Tiitinen, Sivonen, Alku, Lehtokoski, Czigler, Csépe, Ilmoniemi & Näätänen, Reference Winkler, Kujala, Tiitinen, Sivonen, Alku, Lehtokoski, Czigler, Csépe, Ilmoniemi and Näätänen1999a; Winkler, Lehtokoski, Alku, Vainio, Czigler, Csépe, Aaltonen, Raimo, Alho, Lang, Iivonen & Näätänen, Reference Winkler, Lehtokoski, Alku, Vainio, Czigler, Csépe, Aaltonen, Raimo, Alho, Lang, Iivonen and Näätänen1999b). Several studies also suggest that the amplitude and latency of MMN reflects difficulty of speech processing (e.g., Datta, Shafer, Morr, Kurtzberg & Schwartz, Reference Datta, Shafer, Morr, Kurtzberg and Schwartz2010; Kraus, McGee, Carell, Zecker, Nicol & Koch, Reference Kraus, McGee, Carell, Zecker, Nicol and Koch1996; Kraus, Micco, Koch, McGee, Carrell, Sharma, Wiet & Weingarten, Reference Kraus, Micco, Koch, McGee, Carrell, Sharma, Wiet and Weingarten1993; Shafer, Morr, Datta, Kurtzberg & Schwartz, Reference Shafer, Morr, Datta, Kurtzberg and Schwartz2005b; Tamminen, Peltola, Toivonen, Kujala & Näätänen, Reference Tamminen, Peltola, Toivonen, Kujala and Näätänen2013; Zevin, Datta, Maurer, Rosania & McCandliss, Reference Zevin, Datta, Maurer, Rosania and McCandliss2010).
A few studies have used ERPs to examine speech processing in bilingual participants (e.g., Peltola, Tamminen, Salonen, Toivonen, Kujala & Näätänen, Reference Peltola, Tamminen, Salonen, Toivonen, Kujala and Näätänen2010) and have reported findings ranging from no effect of language context (Winkler et al., Reference Winkler, Kujaha, Alku and Näätänen2003), alterations of phonological systems (Molner, Baum, Polka, Menard & Steinhauer, Reference Molner, Baum, Polka, Menard and Steinhauer2009; Peltola, Tamminen, Lehtola & Aaltonen, Reference Peltola, Tamminen, Lehtola and Aaltonen2007; Tamminen et al. Reference Tamminen, Peltola, Toivonen, Kujala and Näätänen2013) or a mixed pattern based on language dominance (Sebastián-Gallés, Rodríguez-Fornells, Diego-Balaguer & Díaz, Reference Sebastián-Gallés, Rodríguez-Fornells, Diego-Balaguer and Díaz2006). In the study by Winkler et al. (Reference Winkler, Kujala, Tiitinen, Sivonen, Alku, Lehtokoski, Czigler, Csépe, Ilmoniemi and Näätänen1999a), bilingual Finnish–Hungarian participants listened to two words differing by a vowel contrast ӕ/e found in Finnish but not Hungarian. In one condition participants detected Finnish-word targets (to put them in “Finnish-language mode”) and in a second condition they detected Hungarian targets (to put them in “Hungarian-language mode”). No difference was found in the MMN amplitude between conditions, and the authors suggested that the MMN negativity was not influenced by semantic information. Another interpretation is that bilingual participants do not flexibly alter their perceptual categories based on context. However, these interpretations are undermined because the AoA of the second language (Finnish) ranged from seven to 35 years of age, and these participants would be less likely to show native-like perception in Finnish.
The studies showing an effect of bilingualism generally used early bilinguals. For example, Tamminen et al. (Reference Tamminen, Peltola, Toivonen, Kujala and Näätänen2013) compared monolingual Finnish and early balanced Swedish–Finnish bilinguals, and examined how these groups processed synthetic Swedish and Finnish vowel contrasts using the MMN measure. The researchers reported that MMNs elicited to the Finnish vowel contrasts were smaller in amplitude and longer in latencies for the early bilingual groups compared to the monolingual group. Peltola and colleagues have suggested that balanced Swedish–Finnish bilinguals, who were exposed to both languages from birth, intertwine or merge the phonological systems of their two languages (Peltola et al., Reference Peltola, Tamminen, Lehtola and Aaltonen2007; Tamminen et al. Reference Tamminen, Peltola, Toivonen, Kujala and Näätänen2013). The study by Molner et al. (Reference Molner, Baum, Polka, Menard and Steinhauer2009) also showed an effect of early bilingualism, but they argued that bilinguals have a more flexible processing mechanism than monolingual listeners. They based this conclusion on the finding that French–English bilinguals showed equally large MMNs to an across-category and within-category phonetic change, whereas monolinguals showed robust MMN only to the across-category change. Presumably, experience with different phonetic realization of the vowel phoneme /u/ for the two languages allowed for better discrimination of these two variants.
Sebastián-Gallés et al. (Reference Sebastián-Gallés, Rodríguez-Fornells, Diego-Balaguer and Díaz2006) revealed the third pattern. They demonstrated that highly fluent Catalan–Spanish bilinguals have different speech perception abilities based on which language was learned first. Specifically, bilinguals with Catalan as the first language, and Spanish acquired between three and five years of age, showed an ERP response (called the error-related negativity) indicating sensitivity to the Catalan contrast e/ɛ, despite showing behavioral judgments in which they judged non-words with /e/ as real words. Specifically, they accepted the /e/ in place of the correct /ɛ/ phoneme. In contrast, bilinguals with Spanish as the first language did not show ERP responses (or behavioral performance) indicating perception of this Catalan contrast, which is not found in Spanish. This pattern of findings indicates that both sets of bilinguals were influenced by Spanish and Catalan phonologies, but in different ways. Most importantly, the Spanish-dominant bilinguals did not show evidence of a clear phonological contrast between the /e/ and /ɛ/ phonemes despite early introduction to the Catalan language.
In sum, a number of factors influence the pattern of results observed in studies of bilingual speech perception. Task factors are of particular interest because they allow the researcher to probe the nature of speech perception at different levels. Behavioral studies of speech perception provide an important endpoint measure of processing, but they do not necessarily reveal whether the underlying processes leading up to the response are similar for monolingual and bilingual participants. In some studies, MMN amplitude and behavioral speech perception were found to be significantly correlated (for review, see Näätänen et al., Reference Näätänen, Paavilainen, Rinne and Alho2007). However, other studies have not found such a relationship (e.g., Shafer et al., Reference Shafer, Schwartz and Kurtzberg2004, Reference Shafer, Morr, Datta, Kurtzberg and Schwartz2005). Shafer et al. (Reference Shafer, Schwartz and Kurtzberg2004) suggested that attention may mediate the relationship, in that very difficult speech contrasts (e.g., brief consonant transitions) may require attention for good perception, even for native listeners. Other types of contrasts may allow for more automatic processing and reflect the listener's experience. For example, Hisagi, Shafer, Strange and Sussman (Reference Hisagi, Shafer, Strange and Sussman2010) showed smaller amplitude MMN in non-native listeners than native listeners to a Japanese vowel-duration contrast when attention was directed away from the stimuli. Most studies using vowel contrasts, however, have shown larger MMNs for native than non-native listeners, if the vowel contrast is not phonemic in the listener's language (e.g., Dehaene-Lambertz, Dupoux & Gout, Reference Dehaene-Lambertz, Dupoux and Gout2000; Menning, Imaizumi, Zwitserlood & Pantev, Reference Menning, Imaizumi, Zwitserlood and Pantev2002; Nenonen, Shestakova, Huotilainen & Näätänen, Reference Nenonen, Shestakova, Huotilainen and Näätänen2003, Reference Nenonen, Shestakova, Huotilainen and Näätänen2005). Thus, a significant relationship between behavioral perception and MMN amplitude for vowel contrasts is expected when comparing native and non-native listeners.
Shafer et al. (Reference Shafer, Schwartz and Kurtzberg2004) found that both English and Hindi participants showed above-chance behavioral discrimination of dental versus retroflexed consonants, but did not show clear MMNs. In another study, some children with specific language impairment (SLI) showed good behavioral discrimination of an ɪ/ɛ contrast, but no MMN (Shafer et al., Reference Shafer, Morr, Datta, Kurtzberg and Schwartz2005). However, many of these children with SLI also showed poor identification of the stimuli. This study suggests that categorization of the stimuli, is more related to MMN than discrimination, at least in the most commonly used task where attention is directed away from the stimulus of interest by asking the participant to watch a silent video or read a book. Directing attention to a difficult contrast (e.g., by asking the participant to count deviant stimuli) can enhance the MMN, whereas directing attention away from the stimulus contrast can result in absence of a clear MMN (e.g., Gomes, Molholm, Ritter, Kurtzberg, Cowan & Vaughan, Reference Gomes, Molholm, Ritter, Kurtzberg, Cowan and Vaughan2000; Hisagi et al., Reference Hisagi, Shafer, Strange and Sussman2010). In sum, examining the pattern of neural and behavioral processing of speech in the same participants can reveal a more complete picture of bilingual speech perception.
The present study
The goal of this study was to determine whether early Spanish–English bilinguals showed evidence of robust, automatic discrimination of re-synthesized English vowels /ɪ–ɛ/, similar to that pattern found for English monolinguals (Shafer et al., Reference Shafer, Morr, Datta, Kurtzberg and Schwartz2005), or whether discrimination was more similar to proficient, late L2 learners of English. An additional question was whether behavioral discrimination and categorization of the vowel stimuli would reveal the same pattern of findings as observed for neurophysiological responses. In English, the vowels [ɪ] vs. [ɛ] are phonemic and contrast meaning (e.g., bid versus bed). However, Spanish has only five vowels: /i/, /e/, /u/, /o/ and /a/. In Spanish, /ɪ/ generally does not occur and /ɛ/ is a variant (allophone) of /e/ (Hammond, Reference Hammond2001). Spanish listeners often report perceiving the English vowel /ɪ/ as Spanish /i/ (Flege, Reference Flege1991) but the acoustic parameters (F1 and F2) of American English /ɪ/ are at the periphery of Spanish /i/. Thus, the misperception of [ɪ] as /i/ may in part be related to orthography (American English /ɪ/ is spelled using “i”).
ERPs were recorded to the vowel contrasts in a modified oddball paradigm and participants performed an identification task of vowel stimuli from the synthesized continuum both before and after the ERP task. In another study, which examined speech perception in monolingual English versus Hindi participants, English listeners could unexpectedly categorize a non-native speech contrast, presumably because they had had extensive experience with the stimuli in between three and four hours of testing preceding the categorization task (Shafer et al., Reference Shafer, Schwartz and Kurtzberg2004). For this reason, we decided to examine categorization abilities (with an identification task) both before and after listeners participated in the ERP experiment and discrimination task. Participants also were asked to discriminate the vowels in a task using the same paradigm as for the ERP condition.
We predicted that late L2 learners of English with Spanish as their first language would show poorer discrimination, seen as smaller MMNs and poor behavioral discrimination, and poorer categorization of the vowels than monolingual speakers of English. We hypothesized that the age of acquisition (AoA)/length of Residence (LoR) would have a clear effect on speech processing. Specifically, we expected early Spanish–English bilinguals, who had acquired English before age five years, to perform similarly to the English monolingual group on behavioral discrimination and identification and to have robust MMNs to the English vowels. In contrast, we expected late learners of English (after age 18) to show poor identification of the stimuli and a small or absent MMN. We predicted that the late learners behavioral discrimination would be above chance, but not as good as found for the other two groups. We also expected monolingual and early bilingual groups to show good identification of the vowels both before and after the MMN experiment. In contrast, we expected the late bilinguals to show particularly poor identification, although they might show some improvement on categorization in the second task due to experience with the specific vowels. Finally, we predicted that the behavioral responses and the MMN would be correlated, but only weakly, because they tap into different stages of processing and because the behavioral tasks required focused attention whereas the passive oddball task used to elicit MMN did not.
Method
Subjects
Participants were recruited using an internet posting site (Craigslist in New York City) or by advertisement on The Graduate Center, CUNY campus. A total of 51 participants were tested. Three monolingual participants failed to respond to at least 80% of the trials in the identification task (two of these also showed noisy ERP data). Ten additional participants showed noisy ERP data (one monolingual, four early bilinguals and five late bilinguals) as determined from absence of clear obligatory peaks, P1, N1 and P2, to the standard stimulus at frontocentral sites.
The final data set included 13 (five male) monolingual English participants (M group: mean age 30 years, SD = 5.9, range 22–38 years), 12 (three male) early Spanish–English bilinguals (EB group: mean age 27 years, SD = 6.0, range 22–40 years) who learned English before the age of five years, and 13 (seven male) late Spanish–English bilinguals (LB group: mean age 30 years, SD = 6.3, range 21–38 years) who learned English after 18 years of age. There were no significant differences in age between groups (t-test: p > .1). Monolingual participants were native New Yorkers and bilinguals were born in the US or came from a variety of Spanish-speaking countries.
Participants were screened for language proficiency level through a scripted oral phone interview by fluent, bilingual Spanish–English-speaking researchers in both languages prior to the study to evaluate fluency in both Spanish and English. The language proficiency judgments were based on a five-point scale, which included fluency, conversational and comprehension skills (see Appendix for proficiency questionnaire). Early bilinguals were judged to be highly fluent in both English and Spanish. Seven of the 12 early bilinguals received median ratings of 5 for English, and one received a rating of 4 (missing forms for four EB, but all had received ratings of at least 4). Ratings of 4 were associated with highly fluent English (or Spanish), but allowed for a slight accent. Late bilinguals needed to be rated 5 for all categories on the Spanish questionnaire and demonstrate sufficient English to comprehend instructions during the study. Four of the late bilinguals received median ratings ranging from 4 to 4.5, and six received ratings ranging from 2 to 2.5 on the English questionnaire (missing forms for three LB). The early and late bilinguals differed significantly on ratings for English (ratings of 4 or above; Fisher Exact Test, p < .003, calculated on 12 EB and 10 LB).
At testing, participants filled out a language background questionnaire reporting the length of residence in the United States, the age of first introduction to American English, as well as experience with coursework in English in another country. The early bilingual (EB) group showed a mean Age of Acquisition (AoA) of 1.5 years (median 1.25 years, SD = 1.6 years), and length of residence of 26.4 years (median 24 years, SD = 5.3 years). Seven of the EB participants were bilingually exposed to English and Spanish in the home and for five EB participants, Spanish was used in the home and first exposure to English began between two and five years of age, outside of the home. The late bilingual (LB) group showed a mean AoA of 24 years (median = 24 years, SD = 3.8 years) and length of residence of 6.5 years (median = 6 years, SD = 4.4 years). Note that there was no overlap in length of residence for the two bilingual groups, with the longest residence for the late bilingual group of 16 years and the shortest for the early group of 19 years. The final set of participants all had normal hearing (at 500, 1000, 2000, 4000 Hz at 25 dB HL). Participants signed informed consent and were paid $10 per hour for their participation.
Stimuli
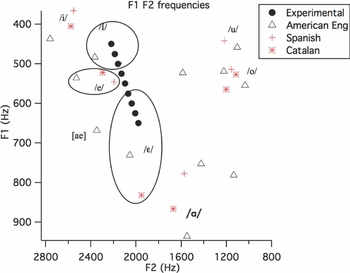
The stimuli were created by resynthesizing and editing a naturally-produced exemplar (produced by one of the authors, VLS) using ASL/CSL software to produce a series of nine vowels perceived as either [ɪ] in bit or [ɛ] in bet. F1 rose in steps of 25 Hz (starting at 450 Hz), and F2 fell in steps of 30 Hz (starting at 2200 Hz) across the nine stimuli. Formants F3 and F4, and the fundamental frequency (f0), were identical for all stimuli, peaking at approximately 2714 Hz, 3175 Hz, and 190 Hz, respectively. Table 1 shows the formant frequencies of F1 and F2 for each stimulus. Figure 1 shows F1 and F2 of the experimental stimuli plotted in relation to values derived from studies of American English (Hillenbrand, Getty, Clark & Wheeler, Reference Hillenbrand, Getty, Clark and Wheeler1995), Spanish (Bradlow, Reference Bradlow1995) and Catalan (Recasens & Espinosa, Reference Recasens and Espinosa2006). F1 and F2 values of the experimental vowels match well with the American English values. The experimental stimuli are slightly lower in F1 and F2 frequency because the f0 was also lower than found for the vowels produced by women in Hillenbrand et al. (Reference Hillenbrand, Getty, Clark and Wheeler1995). The stimuli were edited to 50 ms in duration and had a rise and fall times of 5 ms. Two stimuli were selected from the nine-step continuum (stimuli 3 and 9) for use in the ERP and discrimination tasks because pilot studies showed that they received the most consistent categorization as [ɪ] and [ɛ], respectively. All nine stimuli were presented in the identification task. Stimuli 1–5 were most frequently identified as the vowel [ɪ] and stimuli 7–9 as the vowel [ɛ] by a group of nine adults, and by seventeen children with typical language development (Shafer et al., Reference Shafer, Morr, Datta, Kurtzberg and Schwartz2005). Note that stimuli 3, 5, 7 and 9 were re-labeled as stimuli 1, 2, 3 and 4 in Shafer et al. (Reference Shafer, Morr, Datta, Kurtzberg and Schwartz2005), but are the same stimuli. The intensity of stimulus presentation was set at 75 dB SPL.
The formant frequencies of F1 and F2 for each stimulus (stim).

F1 and F2 mean formant frequencies for the experimental vowels used in the current study compared to those from female voices in Hillenbrand et al. (Reference Hillenbrand, Getty, Clark and Wheeler1995) and female values interpolated from Spanish male voice measures (by using the male/female ratios in Hillenbrand et al., Reference Hillenbrand, Getty, Clark and Wheeler1995) in Bradlow (Reference Bradlow1995) and interpolated from Catalan male voice measures in Recasens & Espinosa (Reference Recasens and Espinosa2006). The f0 for the female vowels was a little lower (around 190 Hz) than the mean value for the Hillenbrand et al. (Reference Hillenbrand, Getty, Clark and Wheeler1995) vowels (around 215 Hz), so this is why the F1 and F2 values are a little lower for our experimental vowels.

The ERP experiment used a modified “oddball” paradigm similar to Dehaene-Lambertz et al. (Reference Dehaene-Lambertz, Dupoux and Gout2000). Speech sounds were presented in sequences of four stimuli with a Stimulus Onset Asynchrony (SOA) of 650 ms and an intertrain interval (ITI) of 1500 ms. Listeners heard three train types: one consisting of a sequence of four /ɛ/ stimuli (standard, frequent); a second train type of four stimuli with standards in the first, second and fourth positions and the deviant /ɪ/ in the third position; and a third train type with standards in the first, second and third positions and the deviant /ɪ/ in the fourth position. The inclusion of deviants in two different train positions was designed to decrease the predictability of occurrence of the deviant. The overall proportion of standard /ɛ/ was 89% and deviant /ɪ/ was 11%.
Electrophysiological and behavioral apparatus
Stimuli were delivered via e-prime and responses (reaction time and accuracy) recorded using a response box on a PC computer for later offline processing. The EEG was obtained using a Geodesic system from 64 sites (0.1–30 Hz bandpass; 250 Hz sampling rate). The Vertex served as the reference during the recording. Vertical and horizontal eye movements were monitored from frontal electrodes Fp1 (left) and Fp2 (right) and electrodes placed below each eye. Impedance was maintained below 40 kΩ, which is acceptable for the high-impedance Geodesic amplifiers (200 MΩ; Picton, Alain, Otten, Ritter & Achim, Reference Picton, Alain, Otten, Ritter and Achim2000; Ferree, Luu, Russell & Tucker, Reference Ferree, Luu, Russell and Tucker2001).
Procedure
Each session lasted between two and two-and-a-half hours with frequent breaks. Tasks were conducted in the following order: consent form, language background questionnaire and net preparation (30 minutes), task familiarization and practice test for identification task (five minutes), impedance check (10 minutes), identification task (ID1) (10 minutes), ERP session (40 minutes), discrimination task (15 minutes), identification task (ID2) (10 minutes).
Behavioral discrimination
The discrimination task was performed after the electrophysiological procedure to ensure that the participant was not “aware” of the sound distinctions during the passive ERP task. The paradigm used for the discrimination task was identical to that of the modified oddball used in the ERP task. The participants were asked to press a button when a stimulus within a train differed from the preceding stimuli.
Behavioral identification
The identification task was performed before (ID1) and after (ID2) the ERP and discrimination tasks. Participants pressed one button labeled /ɪ/ or a second button labeled /ɛ/ to each of the sounds on the nine-step vowel continuum. Each stimulus was presented 10 times. Stimuli were presented at the rate of one stimulus per two seconds in two blocks. Participants received 20 practice trials at the onset of the task to ensure that they understood that they needed to classify each stimulus.
Electrophysiological procedures
Participant's heads were measured and the electrode net selected and soaked in a saline solution. The electrode net was applied and impedances adjusted to be below 40 kOhms. Each participant selected a movie to watch that would maintain interest. The participants were asked to ignore the stimuli while watching the muted movie (close captioned). During data acquisition, all channels were observed by an experimenter to monitor subject's state (awake), and artifacts from muscle movement and external noise.
Data analysis
For the behavioral discrimination data, accuracy scores (in terms of percentages correct and missed responses) were transformed to a-prime (a′) values (e.g., Green & Swets, Reference Green and Swets1966; Pastore, Crawley, Berens & Skelly, Reference Pastore, Crawley, Berens and Skelly2003; Pollack & Norman, Reference Pollack and Norman1964). Similar to d-prime (d′), but for small sample sizes, the non-parametric a′ takes into account response bias by using both correct responses and false alarms. Fisher Exact tests (similar to Chi Square, but more appropriate for small groups) (see Fisher, Reference Fisher1922, Reference Fisher1945) were used to see whether the number of participants in each group showing near ceiling discrimination of the deviant (a′ > .9) differed for any of the three groups (i.e., M vs. EB and LB). For the identification task, categorization percentages for stimulus 3 and stimulus 9 (used in the ERP study) were transformed into a′ using the following responses: Categorizing stimulus 9 as [ɛ] was considered a correct response and categorizing stimulus 3 as [ɛ] was considered a false alarm. Thus, an a′ value of 1 indicated that the two stimuli were always categorized differently, whereas an a′ value of .5 indicated that the stimuli were not distinguished and are labeled equally as [ɪ] or [ɛ]. We used an a′ value of .9 or more as a reflection of good categorization of the stimuli. All p-values reported for Fisher's Exact are two-tailed. In addition a paired t-test was used to compare the two identification tasks (ID1 vs. ID2).
The voltage responses were low-pass filtered at 20 Hz and segmented into 1000 ms epochs (from –200 ms to 800 ms). Voltages greater than 70 μV for 15% of the channels resulted in rejection of an epoch. If a channel showed voltages greater than 70 μV for more than 15% of the trials, that channel was replaced via spline interpolation with data from the surrounding channels using Netstation analyses software 4.0. Finally, the epochs time-locked to the standard and to the deviant stimulus were averaged to create a standard and deviant ERP, respectively. Standards in 4th position that followed a deviant in third position were excluded from the standard ERP. MMN responses were calculated by subtracting the averaged ERP to the standard stimuli from that of the deviant stimuli.
The MMN is largest at frontocentral sites and inverts at the mastoids (Näätänen Reference Näätänen1990; Sussman, Winkler, Kreuzer, Saher, Näätänen & Ritter, Reference Sussman, Winkler, Kreuzer, Saher, Näätänen and Ritter2002). Electrode sites representing left (near F3 and C3: sites 9, 13, 16, 17), mid-line (near Fz and Cz: sites 4, 5, 55) and right (near sites F4 and C4: 58, 62, 54, 57) frontocentral regions and the left (26) and right (51) mastoids were selected for further analysis. The left mastoid was subtracted from the average of the left frontocentral sites to create a left model, and the right mastoid was subtracted from the right frontocentral to create a right model. To create a mid-line model, the average of both mastoids was subtracted from the average of the midline sites (see Shafer, Yu & Datta, Reference Shafer, Yu and Datta2010, for a similar analysis). As a first step, t-tests were computed for the midline model subtraction waveform to determine whether MMN was significantly present for each group between 140 ms and 300 ms (e.g., Ritter, Sussman, Deacon, Cowan & Vaughan, Reference Ritter, Sussman, Deacon, Cowan and Vaughan1999). To examine group differences, repeated measures ANOVA with hemisphere (left, midline and right models) and time were undertaken using the amplitudes from the subtraction (deviant – standard) waveforms. Hemisphere was included as a factor because some studies have shown larger differences in MMN related to speech at left than right sites (Näätänen et al., Reference Näätänen, Paavilainen, Rinne and Alho2007; Shafer et al., Reference Shafer, Schwartz and Kurtzberg2004). Time was included as a factor because it was possible that the MMN could peak in a later time interval for a bilingual group (e.g., Shafer, Schwartz & Kurtzberg, Reference Shafer, Schwartz and Kurtzberg2004).
Results
Behavioral
Discrimination task
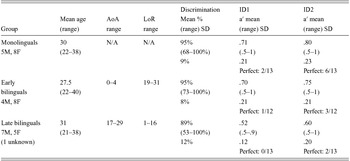
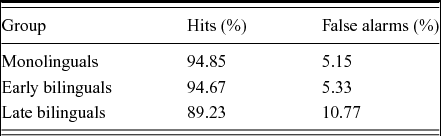
All three groups were able to discriminate the /ɛ/–/ɪ/ contrasts well above chance. The late bilinguals showed slightly worse detection of the vowel change than the other two groups (LB, a′ = .82; EB, a′ = .90; M, a′ = .91) (see Table 2 and Table 3). Eight of 13 monolinguals (M), eight of 12 early bilinguals (EB) and three of 13 late bilinguals (LB) showed a′ scores greater than 0.9. The Fisher Exact test showed no difference between the M and EB groups (Fisher Exact test, p = 1) or the M and LB groups (p = .10). However, there was a significant difference in discrimination scores using this cutoff between the EB and the LB groups (p = .05).
Descriptive statistics for each of the three groups, including mean age and range, range of AoA and LoR, and means (range) and SD for behavioral a-prime measures. The early bilinguals and late bilinguals groups showed significantly different behavior.

Hits and false alarm rates for the discrimination task for all three groups.

Identification task
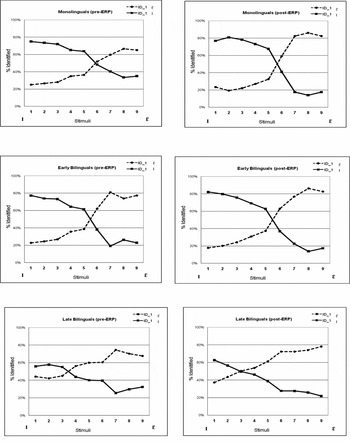
The monolingual group categorized the endpoint stimuli from the vowel continuum into two different categories at above chance levels on ID1 (before the ERP experiment), although categorization did not show ceiling performance on endpoints with an abrupt category change between two stimuli. In ID2 (following the ERP experiment) they showed responses that were more categorical in nature, with a more abrupt boundary between stimulus 5 and 6 (see Figure 2). The EB group identified endpoint stimuli as different vowels above chance and showed an abrupt crossover boundary between stimulus 5 and 6 for both ID1 and ID2 (Figure 2). In contrast, the LB group showed poor categorization of the stimuli on the /ɪ/ end of the continuum, equally labeling five of the stimuli as /ɛ/ or as /ɪ/. Categorization was better on the /ɛ/ end of the continuum for the LB Spanish group, with participants more often labeling the stimuli as [ɛ] than [ɪ]. The LB group showed a slight improvement in categorizing vowels on the [ɛ] end of the continuum for ID2 (Figure 2). It is likely that the LB group showed chance categorization on the [ɪ] end of the continuum because these tokens (stimuli 1–5) were at the periphery of both the Spanish /i/ and Spanish /e/ categories (see Figure 1). Specifically, the F2 formant frequency of the [ɪ] tokens in the current study were too low for the Spanish /i/ and too high for the Spanish /e/ phonemes. In contrast, the F2 formant frequency of the [ɛ] tokens (stimuli 6–9) fell within the range of the Spanish /e/, and thus showed more consistent labeling by the LB group.
Categorization functions for ID1 (pre-ERP) and ID2 (post-ERP) for each of the three groups. Both the monolingual and early bilingual groups demonstrate categorical perception with an abrupt change in perception between stimulus tokens 4 and 7 and little difference between tokens 1–4 for /ɪ/ and 7–9 for /ɛ/.

Since the identification scores from one end of the sound continuum was reflected in the other end, statistical analyses were carried out on a′ values derived from distinct categorization of stimuli 3 and 9, as described above. Results indicated that the M group differed from the LB, but not the EB group in identification of stimulus 3 as /ɪ/ and stimulus 9 as “not /ɪ/” for the ID2 task (M vs. LB: Fisher's Exact p = .04), (M vs. EB: Fisher's exact p = .43). In addition the EB and the LB group did not differ (Fisher's exact p = .20). No significant differences were observed between any of the groups for the ID1 task (M vs. EB group, p = .64; EB vs. LB group, p = .59 and M vs. LB group, p = .32). Eight of the 13 monolinguals, five of the 12 early bilinguals and two of the 13 late bilinguals showed differential categorization (a′ > .9) of stimuli 3 and 9 on the ID2 task. The slight improvement in categorization from ID1 to ID2 was not significant for any of the groups using the Fisher–Exact test (M group ID1 mean a′ = .71, ID2 mean a′ = .80, Fisher Exact test, p = .24; EB group, ID1 a′ mean = .70; ID2 a′ mean = .75, Fisher Exact test, p = .37; LB group ID1 a′ mean = 0.56; ID2 a′ mean = 0.65, Fisher Exact test, p = 1).
We also conducted separate t-tests between pairs of groups for ID1 and ID2 tasks separately. Results indicated that the M group was not significantly different from EB group, but the EB group (t(23) = 2.21, p = .04) as well as the M group (t(23) = 2.30, p = .03) were significantly different from the LB group for the ID1 task. No differences were found between groups for the ID2 task. Both the M group (t(12) = 2.76, p = .02) and the LB group (t(12) = 2.38, p = .04) performed better in the ID2 task than in the ID1 task. Thus, both analysis approaches (the Fisher Exact tests and the t-tests) indicate that the M group was different from the LB group but not the EB group.
We also examined the ID scores for the LB group in relation to their proficiency. Of the four LB participants who performed best (a′ > .79), two showed English proficiency median ratings of 4 and 4.5, and two showed ratings under 3. The EB participants showed little variance in English proficiency and thus, their ID performance could not be related to these ratings.
Electrophysiology
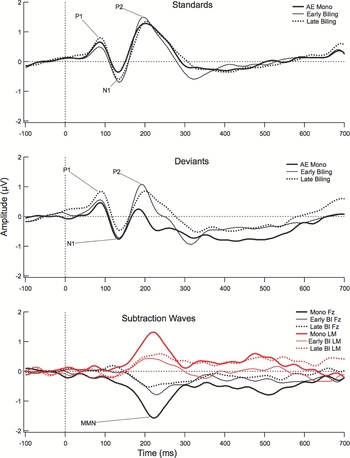
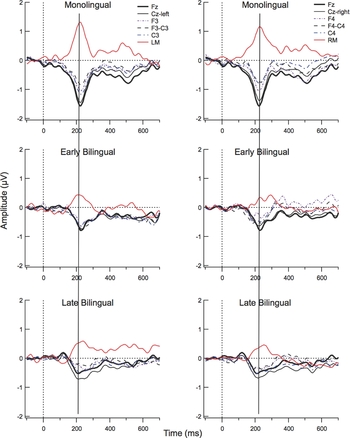
Figure 3 displays the ERPs to the standard and deviant at Fz (top and middle graphs) and the subtraction waveforms at Fz and LM overlaid for the three groups. Little difference among the three groups is observed for the ERP to the standard, but for the deviant ERPs, a large difference among groups is clearly apparent between 100 ms and 300 ms, with the monolingual group showing a more negative response at Fz than the other groups. All three groups, however, clearly show increased negativity of the deviant ERP compared to the standard in this time range, which inverts in polarity at mastoid sites. This pattern is consistent with the MMN. Figure 4 reveals that the MMN peaks between 200 ms and 240 ms for monolinguals and is largest at Fz, but also quite prominent at left and right frontocentral sites. The MMN peaks later (between 240 ms and 280 ms) in the late bilingual group. Two-tailed t-tests were carried out at Fz on ten, 20 ms intervals from 100 ms to 300 ms for each group to determine the time intervals for which MMN was significant. Results indicated that all three groups show significant negativities from 180 ms to 240 ms (p < .05). For the M group, significant negativity was observed from 160 ms to 300 ms while for the EB and LB groups the MMN began at 180 ms ending at 240 ms and 260 ms, respectively.
The grand mean waveforms at Fz (top and middle graphs) and Fz and LM (bottom graph) for the three language groups. Positive is plotted up. Little difference is apparent among the groups for the ERPs to the standard stimuli waveform (top graph). In contrast, the ERPs to the deviant stimuli waveform and for the subtraction waveform (deviant minus standard waveforms) show greater negativity at Fz (and inversion at LM) for the monolingual compared to bilingual groups.

Subtraction waveforms (deviant minus standard waveforms). Left (left graphs) and right (right graphs) sites compared to midline Fz for the three groups. The sites nearest to the midline (sites 4, 5, 55) show the largest negativity for all groups. The vertical line intersects the MMN peak for the monolingual group (approximately 220 ms) and reveals that MMN peaks slightly later for the late, but not early bilingual group. The MMN is larger at all sites for the monolingual than bilingual groups.

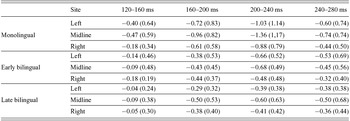
A mixed ANOVA with group (M, EB, LB), site (left, midline, right) and time (120–160 ms, 160–200 ms, 200–240 ms, 240–280 ms) as factors was undertaken in order to examine influence of language experience on amplitude and topography. The ANOVA revealed a main effect of Group (F(2,37) = 8.40, p < .01, η = .324). Post-hoc Tukey HSD tests revealed a significantly larger MMN for the Monolingual compared to the EB group (p = .003) and the Monolingual compared to the LB group (p = .004) but no difference between the two bilingual groups. No interactions of group with site and/or time were significant indicating that this was the general pattern across sites and time intervals. Table 4 presents the means and standard deviations for these sites and times (also see Figure 5).
Means and standard deviations (SDs, in parentheses) of amplitude of the subtractions (deviant minus standard) for language groups and time intervals for the three site measures (Left, Midline, Right) used in the ANOVA.

Left = mean (SD) of left frontal electrodes near F3 and C3 (sites 9, 13, 16, 17); Midline = mean (SD) of midline frontal electrodes near Fz and Cz (sites 4, 5, 55); Right = mean (SD) right frontal electrodes near C4 and F4 (sites 54, 57, 58, 62)
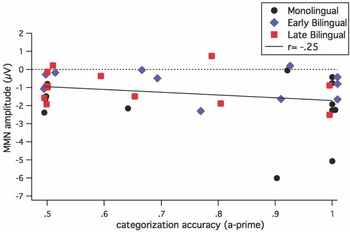
Correlation between identification scores and the MMN amplitude in the peak interval.

Pearson's r was used to determine whether the MMN amplitudes for the peak interval (200–240 ms) at the midline sites correlated with a′ measures from the behavioral tasks. MMN amplitude in the peak interval (200–240 ms) at the midline sites did not correlate with a′ measures for either the behavioral discrimination (r = –.15) or the first behavioral identification task (r = –.04). MMN was weakly correlated with the second identification task [df = 37, coefficients = y = –0.19 + –1.5x], r = –.25, confidence intervals for slope ±1.0). Specifically for a tenth of an increase in the a′ value, the MMN was more negative by –0.15 μV. Figure 5 displays the relationship between MMN amplitude and the a′ value for the individuals in the three groups. Note that the correlations with the following interval (240–280 ms) or with MMN amplitudes calculated by averaging across left midline and right sites (and subtracting the mastoids) in these two intervals led to an identical relationship, and thus, we are only showing the results for the midline sites from 200 ms to 240 ms.
We also examined the relationship between proficiency ratings in English for the LB group and MMN amplitude but did not observe any clear pattern. Examining the median split (six largest MMNs), two of these had proficiency ratings from 4 to 4.5 and four had ratings of 2–3. We could not do this for the EB participants because they showed little variability in English ratings.
Discussion
Speech processing in monolingual and bilingual individuals
The focus of this study was to shed light on processing of English vowels in Spanish–English bilinguals who learned English early in life to determine whether their speech processing across multiple levels resembles that of English-speaking monolinguals, or whether they show patterns more similar to Spanish late learners of English.
Our data from three different tasks suggest early bilinguals process speech differently than both monolinguals and late bilinguals. Researchers have suggested three possible patterns of performance for bilinguals, one in which they favor one language (e.g., Cutler et al.1987), a second, in which they compromise in both languages (e.g., Williams, Reference Williams1977), or a third in which they resemble monolinguals of each language, by adjusting their phonemic categories to the appropriate ones based on language context (Elman et al., Reference Elman, Diehl and Buchwald1977; Gonzales & Lotto, Reference Gonzales and Lotto2013). With regard to behavior, the early bilinguals closely resembled the monolinguals in showing excellent behavioral discrimination and most showing good to excellent categorical perception of the vowel continuum. This pattern was consistent with the suggestion that they favor English, or that they are able to adjust to English phonemic categories. However, with regard to the attention-independent neural measure, early bilinguals more closely resembled the late bilinguals, in that both groups showed significantly smaller MMNs than found for the monolinguals. This latter finding suggests that the third possibility, in which bilinguals can fully adjust processing to the target language, is not the case, at least for these participants and these vowels. This finding, however, may be limited to contrasts that are phonetically similar. Larger phonetic differences are less likely to need attention. The phonemic contrasts tested here were subtle and probably require targeted attention unlike sounds with a larger spectral difference such as that between /ɪ/ and /a/. However, phonetically similar vowels from an L2 are more likely to fall within the same L1 category than two vowels that show greater phonetic difference. The amount of learning in a natural situation that the bilinguals in this study experienced was apparently not sufficient for robust, pre-attentive perception (at least for some of them); it is possible that targeted training on such small differences could result in improved preattentive processing (Chobert, François, Velay & Besson, Reference Chobert, François, Velay and Besson2014). An additional finding was that the behavioral and neural measures were only weakly correlated for the identification task. Below we offer explanations for this pattern of findings.
Automaticity of speech perception
A number of factors distinguish the three different tasks we used to understand speech processing skills in our monolingual and two bilingual groups. In the behavioral tasks the participants were required to directly focus attention on the vowels. In contrast, during the electrophysiological task, the participants were instructed to ignore the speech sounds and focus on a silent movie playing on a computer monitor in front of them. This passive oddball design allows testing of largely attention-independent processing of auditory information. According to Strange (Reference Strange2011), automaticity of speech processing is essential for efficient and robust recovery of word identify. Thus, the MMN measure obtained in a task where attention is not focused on the speech stimuli is likely to serve as a better measure of how listeners will perform in situations with increased task or stimulus difficulty. Comprehension of language is likely to be compromised if attention needs to be selectively focused on speech perception, for example in a noisy situation, in addition to higher levels of processing (e.g., semantics and discourse). The different pattern of results for discrimination as measured in terms of behavior versus neural responses obtained in a passive task indicate that these tasks tap into different aspects of speech processing in the participants, as we had hypothesized. An interesting follow-up study would be to examine whether discrimination of speech in a more difficult task or under noisy conditions would be more strongly correlated with MMN amplitude in bilinguals.
The similar amplitude of MMN for the early and late bilingual groups was not predicted. The pattern was consistent with the findings of Tamminen et al. (Reference Tamminen, Peltola, Toivonen, Kujala and Näätänen2013), who found smaller and later MMN to Finnish vowel contrasts in early bilinguals compared to monolingual Finnish listeners. In our study, many of the individual bilingual participants did show an MMN, which was significant at the group level. Thus, smaller amplitude of the MMN in the bilingual groups was not the result of absence of MMN in many of the participants, but rather to smaller amplitudes and/or later peak latencies for a number of these bilinguals than found for the monolinguals. The presence of MMN suggests that bilinguals were discriminating the vowels at least at an acoustic level during the passive electrophysiological paradigm. If discrimination of the vowels at the pre-attentive level had been based entirely on the Spanish phoneme system, no MMN would be observed. Thus, the different pattern of results across the electrophysiological, discrimination and identification tasks suggests that many of the late bilinguals could resolve the acoustic differences, but could not select for the relevant phonetic detail that would allow for categorization. The pattern of results from the early bilingual group requires a different explanation. The good categorization performance by over half of this group indicates appropriate phonological categories for these two English vowels. However, the smaller MMNs suggest less automatic and/or slower processing.
Speech perception in bilinguals
Monolinguals were expected to show the highest accuracy in discrimination and identification and the largest MMNs. Compared to late bilinguals, this pattern was observed. However, similar behavioral performance was found for early bilinguals and monolinguals, despite the monolinguals showing a more robust MMN. The behavioral identification measure and the MMN were only weakly related, as found for several previous studies using speech (e.g., Datta et al., Reference Datta, Shafer, Morr, Kurtzberg and Schwartz2010; Shafer et al., Reference Shafer, Schwartz and Kurtzberg2004, Reference Shafer, Morr, Datta, Kurtzberg and Schwartz2005). We had decided to test behavioral discrimination and identification at the beginning and end of the study because in a previous study we had found that the non-native group performed better than expected and we reasoned that experience with the speech sounds during the study allowed for this. In the current study, we saw some improvement for the monolingual and late bilingual groups from the first to second identification task. The early bilinguals showed no difference, possibly because they had performed slightly (but not significantly) better than the monolinguals during the first task. Even though the late bilinguals show some improvement, many of them continued to be poor at categorizing the vowels, particularly on the /ɪ/ end of the continuum. The absence of a strong relationship between MMM and behavior suggests that a factor, such as attention influenced the pattern of results (Gomes et al., Reference Gomes, Molholm, Ritter, Kurtzberg, Cowan and Vaughan2000; Hisagi et al., Reference Hisagi, Shafer, Strange and Sussman2010). The good categorization skills found for many of the early bilinguals, in light of the less robust neural index of discrimination could be related to the finding that bilinguals often show enhanced performance on tasks requiring executive functions, such as selective attention, inhibition and set shifting (Bialystok & Craik, Reference Bialystok, Craik and Overton2010; Bialystok & Feng, Reference Bialystok and Feng2009; Costa, Hernandez, Costa-Faidella & Sebastián-Gallés, Reference Costa, Hernandez, Costa-Faidella and Sebastián-Gallés2009). Good attention skills may have allowed for better performance than predicted from the MMN.
The pattern of findings in this study was similar to previous studies in a very general sense in showing that speech processing by early bilinguals differs from that of their monolingual counterparts (e.g., Molner et al., Reference Molner, Baum, Polka, Menard and Steinhauer2009; Peltola et al., Reference Peltola, Tamminen, Lehtola and Aaltonen2007; Sebastián-Gallés et al., Reference Sebastián-Gallés, Rodríguez-Fornells, Diego-Balaguer and Díaz2006; Tamminen et al., Reference Tamminen, Peltola, Toivonen, Kujala and Näätänen2013). The pattern of neural responses in the current study was most similar to that found by Tamminen et al. (Reference Tamminen, Peltola, Toivonen, Kujala and Näätänen2013) and are consistent with the neural measures obtained for early Spanish–Catalan (SC) bilinguals with Catalan as the second language (Sabastian-Galles et al., Reference Sebastián-Gallés, Rodríguez-Fornells, Diego-Balaguer and Díaz2006). However, our findings for the behavioral responses differ from those observed for the SC participants in that the Spanish-dominant SC listeners did not show as good behavior in discriminating the Catalan vowel contrast as those who were Catalan dominant. In our study, the early bilinguals were Spanish dominant (having learned Spanish first and English second) or simultaneous, but showed similar behavioral perception to the monolinguals. Socio-linguistic factors that influence when and how second-language experience is introduced may account for differences across these studies. The participants in the Sebastián-Gallés et al. (Reference Sebastián-Gallés, Rodríguez-Fornells, Diego-Balaguer and Díaz2006) study were typically introduced to the second language around three years of age and both the Spanish and Catalan language have high status. In our study, the seven participants in the early bilingual group who were exposed to English before two year of age showed better categorization on the identification task than the five who were exposed to English between two and five years of age. The group who received early exposure to English generally indicated that one or both caretakers were bilingual or one parent was dominant in English. Those who received later exposure generally had dominant Spanish-speaking caretakers and were introduced to English in preschool. These early “simultaneous bilinguals”, however, were not exclusively the ones showing the larger MMNs. Our findings were not entirely consistent with the recent study by Gonzales & Lotto (Reference Gonzales and Lotto2013). They reported no difference in MMN between simultaneous bilinguals and their monolingual counterparts. It is possible that the nature of the simultaneous input (i.e., parent 1whose L1 is language A and parent 1 whose L1 is language B) will determine whether processing by a bilingual in a target language differs from that of a monolingual. Clearly, more studies need to be carried out examining L2 perception of vowel contrasts in other language pairs that show similarities to English and Spanish in the relationship between their vowel inventories (e.g., German versus Spanish or Italian).
With regard to the late bilinguals, the majority showed poor categorization, consistent with previous findings (e.g., Buchwald, Guthrie, Schwafel, Erwin & Van Lancker, Reference Buchwald, Guthrie, Schwafel, Erwin and Van Lancker1994; Guion, Harada & Clark, Reference Guion, Harada and Clark2004). The four participants from the late bilingual group who were able to categorize the stimuli did not stand out as having the youngest age of acquisition or the longest residency, two coming from below and two from above the median of AoA and LoR. Two of the four showed good English proficiency ratings, and two showed poor ratings. This pattern of finding a few late learners showing good behavioral categorization has been observed in other studies (e.g., MacKain, Best & Strange, Reference MacKain, Best and Strange1981).
In summary, despite the better behavioral performance, particularly for the very early bilinguals, the MMN amplitudes were not larger than those found for late bilinguals. Having dealt with two different languages since before five years of age, one in which these sounds are contrastive, and another in which they are not, early bilinguals have had to navigate a more complex task than their monolingual peers. It is, perhaps, because of this complexity that the behavioral performance is equal for the bilinguals and monolinguals, but neural responses are inefficient (at least for some early bilinguals). It will be important in future studies to examine the nature of the input in the early bilinguals. In particular, highly fluent English of Spanish–English bilinguals in New York City has a characteristic accent, and it is possible that the acoustic–phonetic correlates of English vowel categories for these early bilinguals are different from those of the monolingual NYC varieties. In the case that early input was primarily of the Spanish–English variety, an infant may set-up different category boundaries.
Limitations
One drawback of studies that examine speech processing in these classic, preattentive oddball paradigms is that isolated speech contrasts are repeated multiple times, and, thus, constitute an unnatural context. A different pattern might be found for more natural speech, although we have demonstrated that these vowel stimuli can be categorized by native listeners and are sensitive to language status (typical or impaired) in earlier studies (Datta et al., Reference Datta, Shafer, Morr, Kurtzberg and Schwartz2010; Shafer et al., Reference Shafer, Morr, Datta, Kurtzberg and Schwartz2005, 2007). The resynthesized nature of the vowel stimuli could also have led to listeners processing them as non-speech sounds. However, the finding of more robust MMNs in the monolingual than the bilingual groups suggests the processing is modulated by phonological status, at least for the monolinguals. In fact, it is possible that using more natural speech would diminish differences between groups and not reveal subtle group differences, particularly at a pre-attentive, automatic level. It will be necessary in a future study to examine how various factors influence processing in monolingual compared to bilingual participants to further understand the consequences of differences in speech processing on the important end process: language comprehension.
Another limitation was that we did not have quantitative proficiency measures for the Spanish speakers or measures using a Spanish speech contrast. It is possible that the amplitude of the MMNs to the English vowels may have been modulated by proficiency level in Spanish and not just English. More specifically, greater use of Spanish (and higher proficiency in Spanish) in early bilinguals may have affected automaticity of processing English vowels. Our proficiency rating questionnaire, although useful for ascertaining that a participant showed bilingual skills (i.e., could converse in Spanish and English with little or no noticeable accent), did not quantify language skills in terms of measures such as lexical or syntactic knowledge.
With regard to the use of a Spanish contrast, the five vowels used in Spanish are acoustically well-separated in the vowel space, and thus, MMN would likely be robust for both English and Spanish participants. A consonant contrast, such as voice onset time (VOT; e.g., /ta/ vs. /da/), however, could be used in a future study to examine how language proficiency and use in early bilinguals affects MMN, because this contrast has different phonetic realization in English and Spanish (e.g., Thornburgh & Ryalls, Reference Thornburgh and Ryalls1998).
Conclusions
Early input to American English in bilingual listeners resulted in clear evidence of knowledge of the phonemic contrast between /ɪ/ and /ɛ/. However, early input of American English to bilinguals did not necessarily lead to robust, automatic processing of this phoneme contrast, as measured at a more attention-independent level. Late bilinguals showed expected patterns of poorer phoneme categorization and less robust, automatic processing, but with a few participants exhibiting good performance. We suggest that early bilingual experience with two languages can result in differences in processing compared to monolinguals, but these differences may be related to automaticity of processing, and not clearly observed in behavior. This study corroborates previous research indicating that earlier experience with a second language results in more native-like speech perception.
Appendix. Language proficiency questionnaire
Name:
11.522.533.544.55
Oral intelligibility
1. Precision of production of syllables
2. Precision in connected speech
Linguistic Evaluation
1. Fluency
2. Automatic sequences
Pragmatic/Social language
1. Conversational skills
a. Auditory comprehension
(discourse level)
b. Verbal expression
(discourse level)
3. Organization of narrative
Prosody
1. Natural sounding rhythm
2. Natural sounding intonation
1 = poor; 3 = not so good; 5 = excellent