Introduction
Major depressive disorder (MDD) co-occurs frequently with personality disorders (PDs) in clinical (Skodol et al. Reference Skodol, Stout, McGlashan, Grilo, Gunderson, Shea, Morey, Zanarini, Dyck and Oldham1999; Melartin et al. Reference Melartin, Rytsala, Leskela, Lestela-Mielonen, Sokero and Isometsa2002) and community samples (Hasin et al. Reference Hasin, Goodwin, Stinson and Grant2005; Lenzenweger et al. Reference Lenzenweger, Lane, Loranger and Kessler2007). Several mechanisms have been proposed to explain the relationship, including direct causation (unidirectional or reciprocal), associated liability or overlapping etiological factors, heterogeneity in the expression of liability, and spurious association (Klein et al. Reference Klein, Wonderlich, Shea, Klein, Kupfer and Shea1993; Krueger & Markon, Reference Krueger and Markon2006). Although the evidence does not support any single model uniformly, it seems most consistent with the hypothesis of overlapping etiological factors (Siever & Davis, Reference Siever and Davis1991; Koenigsberg et al. Reference Koenigsberg, Anwunah, Mitropoulou, Schopick and Siever1999; Gunderson et al. Reference Gunderson, Morey, Stout, Skodol, Shea, McGlashan, Zanarini, Grilo, Sanislow, Yen, Daversa and Bender2004; Shea et al. Reference Shea, Stout, Yen, Pagano, Skodol, Morey, Gunderson, McGlashan, Grilo, Sanislow, Bender and Zanarini2004), which is in accordance with a general model of co-morbidity proposed by Krueger & Markon (Reference Krueger and Markon2006).
Multivariate twin studies can determine the extent to which disorders share genetic and environmental etiological factors. In a recent longitudinal population-based twin study, the association between major depression and the personality trait neuroticism could be explained largely by shared genetic risk factors (Kendler et al. Reference Kendler, Gatz, Gardner and Pedersen2006b). We have previously reported on the etiological relationship between MDD and depressive PD (Ørstavik et al. Reference Ørstavik, Kendler, Czajkowski, Tambs and Reichborn-Kjennerud2007), but are unaware of any prior twin study investigating the sources of co-occurrence between MDD and the full set of DSM Axis II disorders.
The Norwegian Institute of Public Health has recently assessed both DSM-IV Axis I and Axis II psychiatric disorders in a population-based sample of twins. The current study used data from this project to address two issues. First, given that PDs are highly inter-correlated (Lenzenweger et al. Reference Lenzenweger, Lane, Loranger and Kessler2007) and a range of PDs have been associated with MDD in both clinical and epidemiological samples (Skodol et al. Reference Skodol, Stout, McGlashan, Grilo, Gunderson, Shea, Morey, Zanarini, Dyck and Oldham1999; Melartin et al. Reference Melartin, Rytsala, Leskela, Lestela-Mielonen, Sokero and Isometsa2002; Hasin et al. Reference Hasin, Goodwin, Stinson and Grant2005; Lenzenweger et al. Reference Lenzenweger, Lane, Loranger and Kessler2007), we aimed to evaluate which of the 10 DSM-IV PDs are independently and significantly associated with lifetime MDD. Second, using the PDs selected, we applied multivariate twin modeling to estimate the degree to which the co-occurrence of these PDs and MDD results from shared genetic versus environmental risk factors.
Method
Sample
Data for the present report came from the Norwegian Institute of Public Health Twin Panel (Harris et al. Reference Harris, Magnus and Tambs2002). Between 1999 and 2004, Axis I and Axis II psychiatric disorders were assessed at interview in 2801 twins (44% of those eligible) born between 1967 and 1979. The mean age of the participants was 28.2 (range 19–36) years. Zygosity was determined by a combination of questionnaire items and genotyping. The misclassification rate was estimated to be <1.0%, which is unlikely to substantially bias results (Neale, Reference Neale2003). Several papers describing details of the sample and the measures used in this report have been published (Kendler et al. Reference Kendler, Czajkowski, Tambs, Torgersen, Haggen, Neale and Reichborn-Kjennerud2006a; Ørstavik et al. Reference Ørstavik, Kendler, Czajkowski, Tambs and Reichborn-Kjennerud2007; Reichborn-Kjennerud et al. Reference Reichborn-Kjennerud, Czajkowski, Neale, Orstavik, Torgersen, Tambs, Roysamb, Harris and Kendler2007; Torgersen et al. Reference Torgersen, Czajkowski, Jacobson, Reichborn-Kjennerud, Roysamb, Neale and Kendler2008).
Measures
A Norwegian version of the Structured Interview for DSM-IV Personality (SIDP-IV; Pfohl et al. Reference Pfohl, Blum and Zimmerman1995) was used to assess PDs. The specific DSM-IV criterion associated with each set of questions is rated using the following scoring guidelines: 0=not present, 1=subthreshold, 2=present, 3=strongly present. Behavior, cognitions and feelings predominating for most of the past 5 years are considered to be representative of the individual's long-term personality functioning. The SIDP-IV was conducted after the Axis I interview, which helps the interviewer to distinguish long-standing behavior from temporary states due to an episodic psychiatric disorder.
The proportion of individuals meeting full DSM-IV criteria for the 10 PDs was too low for useful analyses. As in our previous publications, we therefore used dimensional measures of the PDs, constructing ordinal variables based on the number of endorsed criteria (Kendler et al. Reference Kendler, Czajkowski, Tambs, Torgersen, Haggen, Neale and Reichborn-Kjennerud2006a; Ørstavik et al. Reference Ørstavik, Kendler, Czajkowski, Tambs and Reichborn-Kjennerud2007; Reichborn-Kjennerud et al. Reference Reichborn-Kjennerud, Czajkowski, Neale, Orstavik, Torgersen, Tambs, Roysamb, Harris and Kendler2007; Torgersen et al. Reference Torgersen, Czajkowski, Jacobson, Reichborn-Kjennerud, Roysamb, Neale and Kendler2008). Very few subjects endorsed a high proportion of all or most of the criteria for an individual PD. Therefore, to avoid empty cells, we followed the procedure used in the previous papers by collapsing the criteria count into three [borderline (BPD) and paranoid PD (PPD)] and four categories [avoidant PD (AVPD)] for the twin analyses. Multiple threshold tests supported the assumption that threshold and subthreshold criteria represent different degrees of severity on a single continuum, and that the number of endorsed criteria (⩾1) represent degrees of severity on a single dimension (all p values >0.05).
Inter-rater reliability was assessed based on two raters scoring 70 audiotaped interviews. Intra-class and polychoric correlations for the scaled PDs, using the number of endorsed criteria at the subthreshold level (see below), were very high (0.81–0.96 and 0.80–0.99 respectively).
The lifetime history of Axis I disorders were assessed by the Composite International Diagnostic Interview (CIDI), developed by the World Health Organization (WHO) and used worldwide in most major psychiatric surveys in recent years. The CIDI has been shown to have good test–retest and inter-rater reliability (Wittchen et al. Reference Wittchen, Lachner, Wunderlich and Pfister1998). We used a Norwegian version of the computerized M-CIDI (Wittchen & Pfister, Reference Wittchen and Pfister1997). MDD was used as a dichotomous variable in all analyses. The CIDI includes questions about age of onset, which is not assessed in SIDP-IV.
Interviewers were mostly psychology students in their final part of training or experienced psychiatric nurses. For the SIDP, they were trained by professionals with extensive previous experience with the instrument, and for the CIDI they received a standardized training program by teachers certified by the WHO. The interviewers were supervised closely during the whole data collection period. Interviews were largely conducted face-to-face. For practical reasons, 231 interviews (8.3%) were obtained by telephone. Each twin in a pair was interviewed by different interviewers.
Approval was received from the Norwegian Data Inspectorate and the Regional Ethical Committee, and written informed consent was obtained from all participants after a complete description of the study.
Statistical analyses
The associations between MDD and the 10 PDs were explored using logistic regression, controlling for the correlational structure of the twin data using independent estimating equations (SAS Institute, 2005). To compare the adjusted odds ratios, ‘standardized’ dimensional representations of the PDs based on the number of endorsed criteria (ordinal variables with values ranging from 0 to 6) were used as independent variables. We first tested 10 separate models with each of the PDs, and then used forward stepwise logistic regression with all 10 PDs in the model. The co-morbidity between MDD and the selected PDs was also assessed using polychoric correlations.
In the classical twin model, individual differences in liability are assumed to arise from three latent factors: additive genetic (A), that is genetic effects that combine additively; common or shared environmental (C) factors, which include all environmental exposures that are shared by the twins and contribute to their similarity; and individual-specific or unique environmental (E) factors, which include all environmental factors not shared by the twins plus measurement error. Because monozygotic (MZ) twins share all their genes and dizygotic (DZ) twins share on average 50% of their segregating genes, A contributes twice as much to the resemblance in MZ compared to DZ twins for a particular trait or disorder. By definition, MZ and DZ twins share all their C factors and none of their E factors. As the genetic or environmental factors in this approach are latent (i.e. postulated to exist), we do not have measures of specific genes or environmental risk factors.
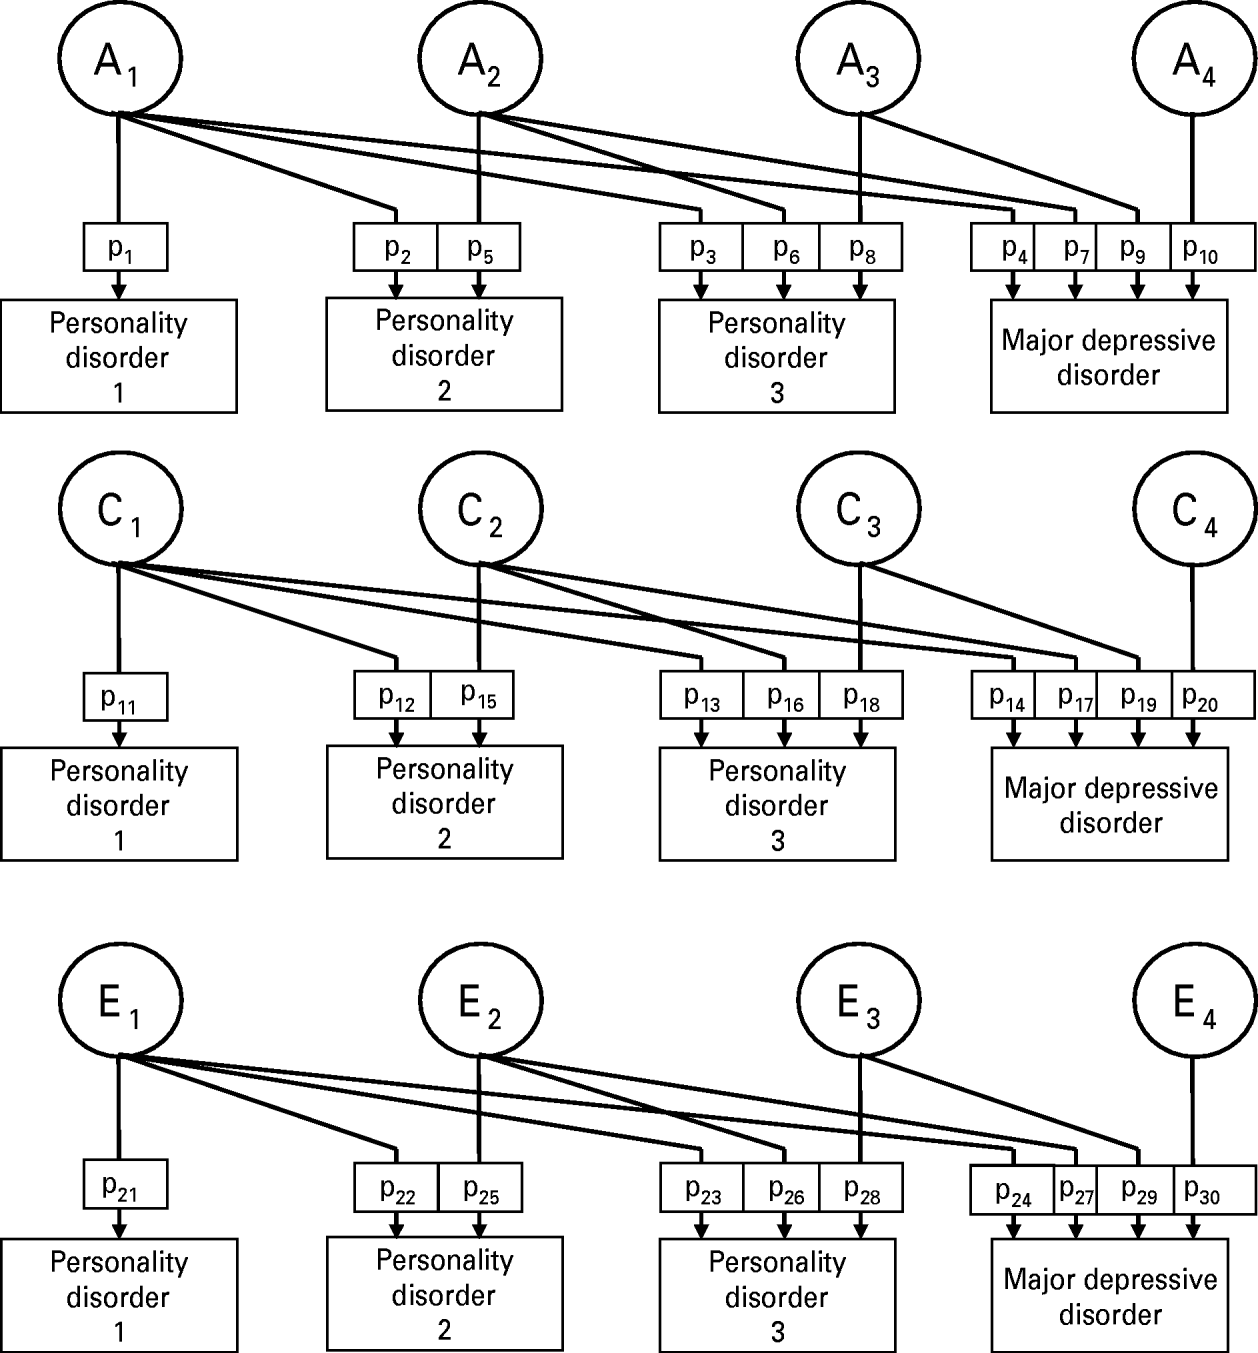
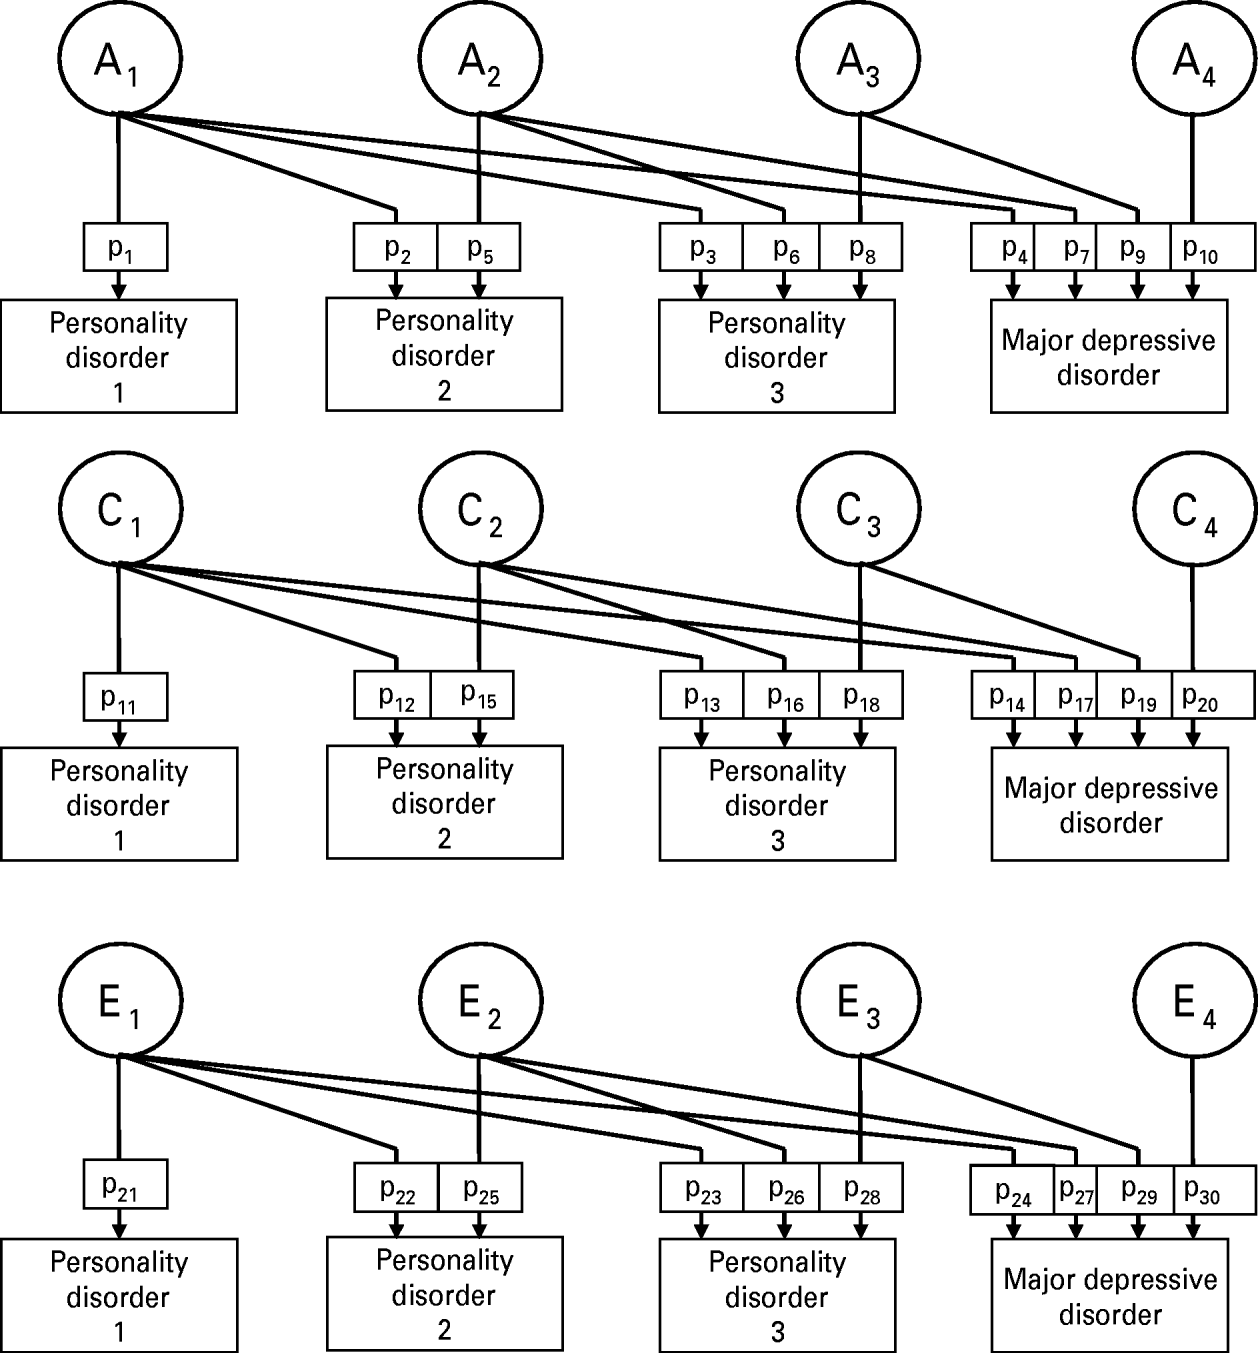
The underlying hypothesis for our multivariate model was that genetic and environmental risk factors for PDs also impact on MDD. We therefore used a Choleskey decomposition (Neale & Cardon, Reference Neale and Cardon1992) with the dimensional representations of the PDs identified by the logistic regression analyses ordered first in the model, beginning with the PD showing the strongest association with MDD. Three latent liability factors are specified for each phenotype. Fig. 1 depicts such a model with three PDs and MDD. The first set of factors (A1, C1 and E1) influences all the PDs and also MDD, and the fourth set (A4, C4 and E4) accounts for residual influences specific to MDD and not shared with the PDs. Based on this model, the correlation between the genetic factors (r a), shared environmental factors (r c) and individual environmental factors (r e) influencing the different phenotypes can be estimated.
Cholesky decomposition for three personality disorders and major depressive disorder. A indicates additive genetic factors; C, shared (or common) environmental factors; and E, individual-specific environmental factors; subscripts 1, 2, 3 and 4 refer to factors that are respectively shared by all disorders, three disorders, two disorders and specific to major depressive disorder; p indicates path.
Very large samples are required to have sufficient statistical power to detect sex-specific effects in twin studies (Neale et al. Reference Neale, Eaves and Kendler1994). Given that previous analyses in our sample of all phenotypes used in this study showed no sex differences in genetic and environmental effects (Kendler et al. Reference Kendler, Czajkowski, Tambs, Torgersen, Haggen, Neale and Reichborn-Kjennerud2006a; Ørstavik et al. Reference Ørstavik, Kendler, Czajkowski, Tambs and Reichborn-Kjennerud2007; Reichborn-Kjennerud et al. Reference Reichborn-Kjennerud, Czajkowski, Neale, Orstavik, Torgersen, Tambs, Roysamb, Harris and Kendler2007; Torgersen et al. Reference Torgersen, Czajkowski, Jacobson, Reichborn-Kjennerud, Roysamb, Neale and Kendler2008), the multivariate models used here were fitted with equal parameters for males and females. However, because of significant prevalence differences for some of the phenotypes, different thresholds were used for the two sexes.
A full model, including all latent variables (Fig. 1), was tested against nested submodels using the raw data option in the software package Mx (Neale et al. Reference Neale, Boker, Xie and Maes1999). The fit of the alternative models was compared using the difference in twice the log likelihood (2lnL), which, under certain regularity conditions, is asymptomatically distributed as χ2 with degrees of freedom (df) equal to the difference in number of parameters (Δχ2 test). According to the principle of parsimony, models with fewer parameters are preferable if they do not result in a significant deterioration of fit. A useful index of parsimony is Akaike's Information Criterion (AIC; Akaike, Reference Akaike1987), which is calculated as Δχ2−2 Δdf. A lower AIC value indicates a superior fit.
Results
Sample
Of the 2801 participants in the study, 2786 (1017 males and 1769 females) had valid data on all phenotypes. The final sample consisted of 219 monozygotic male (MZM) pairs, 116 dizygotic male (DZM) pairs, 446 monozygotic female (MZF) pairs, 261 dizygotic female (DZF) pairs, 338 dizygotic opposite sex (DZO) pairs and 26 single responders.
The lifetime prevalence of MDD in the sample was 14.1% (n=394) and was significantly higher in females (15.8%) than in males (11.1%) (χ2=12.06, df=1, p<0.0001). The mean age of onset was 22.3 years. The prevalence of categorical diagnoses was 0.4% for BPD, 2.1% for AVPD and 0.5% for PPD. The percentage of individuals who endorsed one or more criteria was 48.0% for BPD, 45.0% for AVPD and 42.8% for PPD. The most frequently endorsed criterion for BPD was ‘affective instability due to a marked reactivity of mood’, and for AVPD and PPD respectively: ‘is inhibited in new interpersonal situations because of feelings of inadequacy’ and ‘reads hidden demeaning or threatening meanings into benign remarks or events’.
Association between PDs and MDD
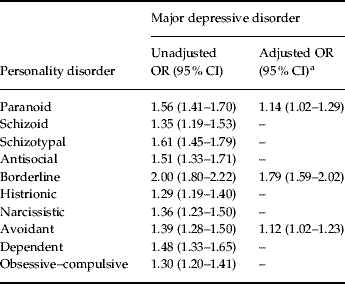
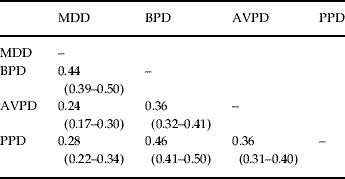
MDD was significantly correlated with dimensional representations of all the 10 PDs with polychoric correlations ranging from 0.17 to 0.44. However, all the PDs were significantly inter-correlated (polychoric correlations 0.12–0.58). Table 1 shows that separate logistic regression models with dimensional representations of the individual PDs as independent variables showed significant associations between MDD and all 10 PDs (all p values <0.0001). Using stepwise logistic regression with MDD as the dependent variable and all 10 PDs as predictor variables, only three PDs were uniquely associated with MDD: BPD was selected in step 1, AVPD in step 2, and PPD in step 3 (respective p values: <0.0001, 0.02 and 0.03). The phenotypic correlations between MDD, BPD, AVPD and PPD are shown in Table 2. The associations between categorical diagnoses of BPD, AVPD and PPD and lifetime MDD as measured by odds ratio (OR) were respectively: 5.1 [95% confidence interval (CI) 1.6–16.9], 4.9 (2.9–8.3) and 4.6 (1.6–13.4). The mean (s.d.) number of criteria (⩾1) met for the PDs were: BPD 1.01 (1.47), AVPD 0.95 (1.40) and PPD 0.79 (1.19). The percentage of individuals who endorsed 0, 1 and 2 or more criteria were: BPD, 51.9, 23.2 and 24.9; AVPD 55.0, 20.6 and 24.4; and PPD, 57.2, 23.1 and 19.7. Females endorsed a significantly higher number of criteria for BPD (χ2=25.99, df=9, p=0.002), but there were no significant gender differences for AVPD and PPD.
Association between lifetime major depressive disorder and dimensional representations of DSM-IV personality disorders
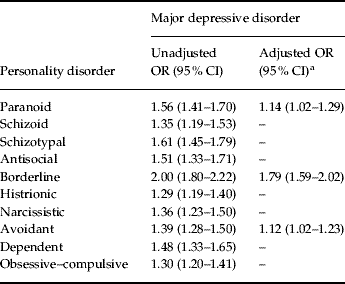
OR, Odds ratio; CI, confidence interval.
a Forward stepwise logistic regression, all 10 PDs included in the model.
Phenotypic correlations (95% confidence interval) between lifetime major depressive disorder and dimensional representations of borderline, avoidant and paranoid personality disorder
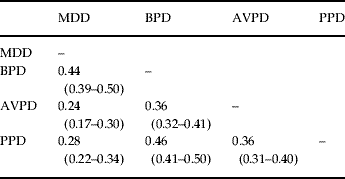
MDD, Major depressive disorder; BPD, borderline personality disorder; AVPD, avoidant personality disorder; PPD, paranoid personality disorder.
Model fitting
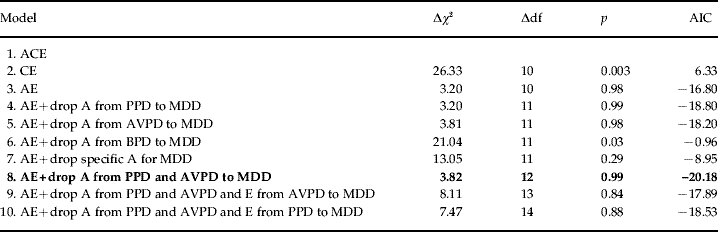
The model fitting results are shown in Table 3. Model 1 is the full model shown in Fig. 1, against which the reduced models were compared. BPD was ordered first, followed by AVPD, PPD and finally MDD.
Multivariate model fitting results
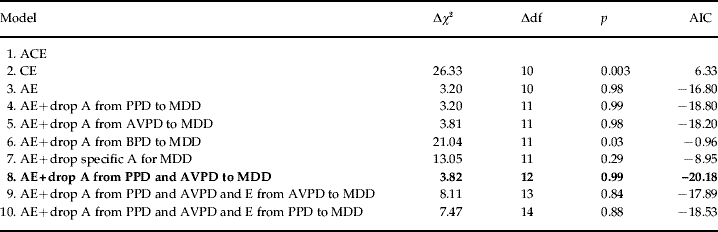
A, Additive genetic effects; C, shared environmental effects; E, individual-specific environmental effects; MDD, major depressive disorder; BPD, borderline personality disorder; AVPD, avoidant personality disorder; PPD, paranoid personality disorder; df, degrees of freedom; AIC, Akaike's Information Criterion.
Best fitting model in bold.
In model 2, all pathways from the latent genetic variables (p1–p10) were set to zero (CE model). This resulted in a substantial deterioration in fit measured by AIC, and indicated a significant contribution from genetic factors. In model 3, all the shared environmental pathways (p11–p20) were constrained to zero (AE model). This model fitted the data well as indicated by a substantial improvement in AIC (−16.80). The subsequent models shown in the table are all reduced versions of this AE model. In models 4–6 we set to zero the paths from the respective specific latent genetic variables to MDD (p9, p7, p4). Both models 4 and 5 yielded improved fit measured by the AIC value compared to the AE model, whereas constraining to zero the pathway (p4) from the latent genetic factor for BPD (A1) to MDD resulted in a substantial deterioration in fit, and indicated that genetic factors influencing BPD, AVPD and PPD significantly influence MDD. Constraining the path from the specific genetic factor for MDD (A4, p9) to zero (model 7) also resulted in a substantial decrease in fit compared to the AE model, indicating that MDD is significantly influenced by genetic factors not shared with the PDs. Corresponding models dropping the respective paths from the E factors were also tested and yielded a worse fit (not shown in the table). Dropping the paths from the specific latent genetic variables for AVPD and PPD (p7, p9) further improved the AIC value (model 8). However, setting to zero the paths to MDD from the latent environmental factors for AVPD and PDD (p27, p29) led to a decrease in fit compared to model 8, which thus provided the best fit to the data.
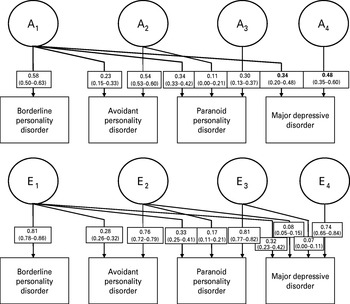
Figure 2 depicts this model with parameter estimates. The genetic covariance between MDD and the PDs is accounted for entirely by a single genetic factor (A1) with loadings on all three PDs. The second genetic factor (A2) influences AVPD and PPD only and the third factor (A3) PPD only. The fourth genetic factor (A4) is specific to MDD. The covariance between MDD and AVPD and PPD not accounted for by A1 is thus explained by the environmental factors E2 and E3 respectively. The structure of the environmental risk factors for MDD and the PDs were very similar to that found for the genetic factors, with almost all the loadings on MDD coming from one environmental factor shared in common with all three PDs (E1).
Parameter estimates (95% confidence intervals) for the most parsimonious model for borderline, avoidant and paranoid personality disorders and major depressive disorder. A indicates additive genetic factors; E, individual-specific environmental factors; subscripts 1, 2, 3 and 4 refer to factors that are respectively shared by all disorders, three disorders, two disorders and specific to major depressive disorder.

The heritability of MDD was estimated at 36%. Heritability estimates for the PDs were: BPD 35%, AVPD 35% and PPD 24%. In this model, 41% of the total genetic influence on MDD was accounted for by the genetic factor influencing BPD and the other PDs (A1). The remaining 59% results from genetic factors specific to MDD (A4). Individual environmental risk factors shared with the three PDs accounted for only 14% of the total environmental variance for MDD.
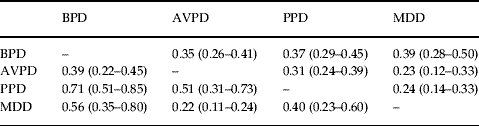
The genetic and environmental correlations between the phenotypes are shown in Table 4. All the genetic correlations were higher than the corresponding environmental correlations. The genetic correlation was strongest between BPD and MDD (r a=0.56), indicating that the phenotypes share a substantial proportion of their genetic risk factors.
Genetic and environmental correlations (95% confidence interval) between dimensional representations of borderline, avoidant and paranoid personality disorder and lifetime major depressive disorderFootnote a
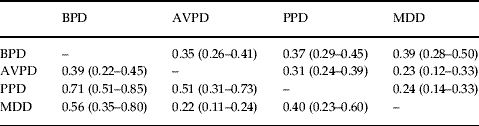
MDD, Major depressive disorder; BPD, borderline personality disorder; AVPD, avoidant personality disorder; PPD, paranoid personality disorder.
a Environmental correlations above the diagonal, genetic correlations below the diagonal.
Discussion
In this study we examined factors underlying the co-morbidity between MDD and the 10 DSM-IV PDs in a population-based sample, using twin data to explore the genetic and environmental risk factors shared by the disorders.
Our heritability estimate for MDD was almost identical to the results from a previous meta-analysis of twin studies on MDD (Sullivan et al. Reference Sullivan, Neale and Kendler2000), and the heritability of BPD in this study (35%) is similar to that found in community-based samples from three countries (42%) (Distel et al. Reference Distel, Trull, Derom, Thiery, Grimmer, Martin, Willemsen and Boomsma2008). To our knowledge we are the only group to have studied the genetic influence on DSM-IV PPD and AVPD in a population-based sample (Kendler et al. Reference Kendler, Czajkowski, Tambs, Torgersen, Haggen, Neale and Reichborn-Kjennerud2006a; Reichborn-Kjennerud et al. Reference Reichborn-Kjennerud, Czajkowski, Neale, Orstavik, Torgersen, Tambs, Roysamb, Harris and Kendler2007), but the estimates for the two PDs are similar to those found previously in a clinical sample from Norway (Torgersen et al. Reference Torgersen, Lygren, Oien, Skre, Onstad, Edvardsen, Tambs and Kringlen2000).
Associations between PDs and MDD
MDD was significantly associated with all 10 PDs when examined one at a time, but only with BPD, AVPD and PPD when all the PDs were examined together. MDD was most strongly related to BPD followed by PPD and AVPD. We are unaware of any prior study assessing the co-occurrence of MDD with all Axis II disorders controlling for the co-morbidity of the PDs. Our results are, however, in accordance with prior clinical (Skodol et al. Reference Skodol, Stout, McGlashan, Grilo, Gunderson, Shea, Morey, Zanarini, Dyck and Oldham1999; Melartin et al. Reference Melartin, Rytsala, Leskela, Lestela-Mielonen, Sokero and Isometsa2002; Gunderson et al. Reference Gunderson, Morey, Stout, Skodol, Shea, McGlashan, Zanarini, Grilo, Sanislow, Yen, Daversa and Bender2004; Shea et al. Reference Shea, Stout, Yen, Pagano, Skodol, Morey, Gunderson, McGlashan, Grilo, Sanislow, Bender and Zanarini2004) and population-based (Hasin et al. Reference Hasin, Goodwin, Stinson and Grant2005; Lenzenweger et al. Reference Lenzenweger, Lane, Loranger and Kessler2007) studies documenting substantial associations between MDD and PDs in general, and BPD, AVPD and PPD in particular. The strength of the association between MDD and the three PDs was similar across studies.
Shared genetic and environmental risk factors
To our knowledge, this is the first study to examine the factors underlying the relationship between the DSM-IV PDs and MDD. Our results are consistent with hypotheses that MDD and BPD have overlapping liability factors (Akiskal et al. Reference Akiskal, Yerevanian, Davis, King and Lemmi1985; Siever & Davis, Reference Siever and Davis1991; Koenigsberg et al. Reference Koenigsberg, Anwunah, Mitropoulou, Schopick and Siever1999; Gunderson et al. Reference Gunderson, Morey, Stout, Skodol, Shea, McGlashan, Zanarini, Grilo, Sanislow, Yen, Daversa and Bender2004; Shea et al. Reference Shea, Stout, Yen, Pagano, Skodol, Morey, Gunderson, McGlashan, Grilo, Sanislow, Bender and Zanarini2004). However, these etiological factors do not seem to be specific to MDD/BPD but are shared with PDs from all clusters.
We found a substantial overlap in genetic risk factors for MDD and the PDs. The genetic correlations was highest for BPD, which is in accordance with the results from a family study by Riso et al. (Reference Riso, Klein, Anderson and Ouimette2000), where elevated rates of MDD were found in relatives of probands with BPD without a history of mood disorder, suggesting correlated familial etiological factors. Other family studies of BPD and MDD have, however, yielded ambiguous results (White et al. Reference White, Gunderson, Zanarini and Hudson2003).
Of particular interest is that the shared genetic influence was transmitted through one single common latent genetic factor (A1) with loadings on all the PDs. Genetic effects for AVPD and PPD not shared with BPD had no effect on MDD. All the PDs not included in the model were highly co-morbid with those that were included, and significantly associated with MDD, suggesting that they also share liability factors in common with MDD. This is supported by a prior family study indicating that familial liability to PD is non-specific (Johnson et al. Reference Johnson, Brent, Connolly, Bridge, Matta, Constantine, Rather and White1995). Further evidence for lack of specificity of the genetic liability for the DSM PDs comes from two twin studies conducted by our group. Torgersen et al. (Reference Torgersen, Czajkowski, Jacobson, Reichborn-Kjennerud, Roysamb, Neale and Kendler2008) found that BPD shares almost all of its genetic liability factors with the other cluster B PDs. Examining the structure of genetic risk factors for all the 10 DSM-IV PDs, Kendler et al. (Reference Kendler, Aggen, Czajkowski, Roysamb, Tambs, Torgersen, Neale and Reichborn-Kjennerud2008) identified a common broad latent genetic factor with substantial loadings on six PDs, including BPD and PPD, in addition to narcissistic, histrionic, dependent and obsessive–compulsive PDs. This might reflect a general vulnerability to personality pathology and/or negative emotionality. It also resembles a genetic factor identified by Livesley et al. (Reference Livesley, Jang and Vernon1998) influencing the higher-order PD trait ‘emotional dysregulation’, which is similar to BPD but also includes paranoid and avoidant traits. The phenotype also resembles the normal personality dimension of neuroticism, which in a meta-analytic study by Saulsman & Page (Reference Saulsman and Page2004) was found to be closely related to BPD, AVPD and PPD. The common genetic factor identified in the current study (A1) thus seems to be closely related to genetic factors influencing liability to broad PD pathology/negative emotionality and neuroticism. As mentioned earlier, neuroticism has been shown to share genetic liability with lifetime MDD (Kendler et al. Reference Kendler, Gatz, Gardner and Pedersen2006b). The genetic correlation found in that study was very similar to that found between MDD and BPD in the present report, and between MDD and the DSM-IV Appendix disorder Depressive PD in a previous study (Ørstavik et al. Reference Ørstavik, Kendler, Czajkowski, Tambs and Reichborn-Kjennerud2007).
Environmental risk factors for MDD were significantly correlated with environmental risk factors for all the three PDs. The correlation was highest between BPD and MDD. This is similar to the result found for the correlations between the genetic risk factors. The structure of the environmental risk factors resembles that found for the genetic factors, with almost all common liability transmitted by one factor (E1). Environmental factors that reflect unique individual experiences, such as adverse life events, seem to be etiologically related to the development of MDD and also PDs. This is in accordance with prior findings indicating that stressful life events have non-specific effects across disorders, increasing liability to a wide range of psychopathology (Kessler et al. Reference Kessler, Davis and Kendler1997; Kendler et al. Reference Kendler, Bulik, Silberg, Hettema, Myers and Prescott2000). From this study we are not able to tell which environmental factors might be involved. Of interest, all the unique covariance between MDD and AVPD and PPD identified in the logistic regression was accounted for solely by environmental factors (E2 and E3 respectively).
Taken together, these results indicate that MDD shares liability factors with BPD (from cluster B) and also with PDs from clusters A and C, suggesting that the risk factors for many of the aspects of PD pathology also increase risk for MDD. This is consistent with the so-called ‘liability-spectrum model’, which postulates that the extensive co-morbidity found among mental disorders can usefully be interpreted as reflecting a smaller number of liability factors that underlie multiple disorders (Krueger & Markon, Reference Krueger and Markon2006). Previous multivariate twin studies have shown that genetic risk factors for MDD also influence other internalizing Axis I disorders (Kendler et al. Reference Kendler, Prescott, Myers and Neale2003; Hettema et al. Reference Hettema, Neale, Myers, Prescott and Kendler2006). Future multivariate studies that include a large number of Axis I disorders and the PDs are needed to further explore the structure of disorders sharing etiological factors. This is particularly relevant for the efforts to revise the DSM system based on spectrums or clusters of disorders as an alternative to the Axis I–Axis II division (Krueger, Reference Krueger2005; Krueger & Markon, Reference Krueger and Markon2006), and also for molecular genetic studies seeking to identify susceptibility genes. To increase our understanding of shared vulnerability to several disorders is also important in clinical settings, both for the design of prevention strategies and for pharmacological and psychotherapeutic treatment.
Limitations
These results should be interpreted in the context of five potentially significant methodological limitations. First, because of low prevalences, we were unable to analyze categorical PD diagnoses and instead examined dimensional representations of the DSM-IV diagnoses. We supported the assumption that the two approaches reflect the same underlying liability using multiple threshold tests (Kendler et al. Reference Kendler, Czajkowski, Tambs, Torgersen, Haggen, Neale and Reichborn-Kjennerud2006a; Ørstavik et al. Reference Ørstavik, Kendler, Czajkowski, Tambs and Reichborn-Kjennerud2007; Reichborn-Kjennerud et al. Reference Reichborn-Kjennerud, Czajkowski, Neale, Orstavik, Torgersen, Tambs, Roysamb, Harris and Kendler2007; Torgersen et al. Reference Torgersen, Czajkowski, Jacobson, Reichborn-Kjennerud, Roysamb, Neale and Kendler2008). As twin analyses are based on the liability threshold model, this indicates that the results would be the same with both methods of measurement. Furthermore, there is increasing evidence suggesting that PDs may be best conceptualized as dimensional rather than categorical constructs (Krueger et al. Reference Krueger, Skodol, Livesley, Shrout and Huang2007; Morey et al. Reference Morey, Hopwood, Gunderson, Skodol, Shea, Yen, Stout, Zanarini, Grilo, Sanislow and McGlashan2007).
Second, although we found no sex differences or common environmental effects for any of the phenotypes investigated in our sample (Kendler et al. Reference Kendler, Czajkowski, Tambs, Torgersen, Haggen, Neale and Reichborn-Kjennerud2006a; Ørstavik et al. Reference Ørstavik, Kendler, Czajkowski, Tambs and Reichborn-Kjennerud2007; Reichborn-Kjennerud et al. Reference Reichborn-Kjennerud, Czajkowski, Neale, Orstavik, Torgersen, Tambs, Roysamb, Harris and Kendler2007; Torgersen et al. Reference Torgersen, Czajkowski, Jacobson, Reichborn-Kjennerud, Roysamb, Neale and Kendler2008), our statistical power to detect such effects is limited (Sullivan & Eaves, Reference Sullivan and Eaves2002). Studies using very large samples have identified sex effects for both MDD and neuroticism, but the sex differences in genetic correlation between neuroticism and MDD seem to be small (Kendler et al. Reference Kendler, Gatz, Gardner and Pedersen2006b).
Third, a current depressive episode might influence the report on personality traits. The interviewers in this study were trained to be aware of this in particular and to emphasize that response should be based on how one usually regards oneself over the past 5 years. Furthermore, only 37 (9.4%) of subjects with MDD reported having their last depressive episode within the previous 2 weeks, and 222 (56.3%) reported that it was more than 1 year since their last episode of major depression.
Fourth, these results were obtained from a particular population, young adult Norwegian twins, and may not extrapolate to other cultural, ethnic and age groups. The prevalence of PDs varies across studies. Our results for the three PDs included here were similar to estimates from the UK (Coid et al. Reference Coid, Yang, Tyrer, Roberts and Ullrich2006), but lower than in a recent US study (Lenzenweger et al. Reference Lenzenweger, Lane, Loranger and Kessler2007). However, although the prevalence of, for example, BPD in the latter study was higher than in our sample, the association between measures of BPD and MDD, which is the focus of this investigation, was almost identical.
Fifth, substantial attrition was observed in this sample from the birth registry through three waves of contact. We report detailed analyses of the predictors of non-response across waves elsewhere (Tambs et al. Reference Tambs, Rønning, Prescott, Kendler, Reichborn-Kjennerud, Torgersen and Harris2009). In brief, cooperation was strongly predicted by female sex, monozygosity and higher educational status but not for symptoms of psychiatric disorders. A series of analyses did not show any evidence of changes in the genetic and environmental covariance structure due to recruitment bias for a broad range of mental health indicators in the second questionnaire. Although we cannot be certain that our sample was representative with respect to psychopathology, these findings suggest that a substantial bias is unlikely.
Acknowledgements
This work was supported by grants MH-068643 (PI Kendler) and MH-65322 (PI Neale) from the National Institutes of Health. The twin program of research at the Norwegian Institute of Public Health is supported by grants from the Norwegian Research Council, the Norwegian Foundation for Health and Rehabilitation, the Borderline Personality Disorder Research Foundation and by the European Commission under the program ‘Quality of Life and Management of the Living Resources’ of the 5th Framework Program (no. QLG2-CT-2002-01254). Genotyping on the twins was performed at the Starr Genotyping Resource Centre at the Rockefeller University. We are very grateful to the twins for their participation.
Declaration of Interest
None.