

INTRODUCTION
One of the main projects linked to the installation of the AixMICADAS facility in Aix-en-Provence, France (Bard et al. Reference Bard, Tuna, Fagault, Bonvalot, Wacker, Fahrni and Synal2015) is to contribute to radiocarbon (14C) calibration by means of various archives (Reimer et al. Reference Reimer, Bard, Bayliss, Beck, Blackwell, Bronk Ramsey, Buck, Cheng, Edwards, Friedrich, Grootes, Guilderson, Haflidason, Hajdas, Hatté, Heaton, Hoffmann, Hogg, Hughen, Kaiser, Kromer, Manning, Niu, Reimer, Richards, Scott, Southon, Staff, Turney and van der Plicht2013). The most accurate and precise information comes from the dating of tree-ring sequences from subfossil wood. A necessary first step is to select and set up a suitable chemical pretreatment method for wood samples enabling their 14C dating by the accelerator mass spectrometry (AMS) facility of Aix-en-Provence.
Wood is mainly composed of cellulose (α-cellulose and hemicelluloses), lignin, and to a lesser extent, ash and extractives. The relative proportions of these different components depend on the wood species (Fengel and Wegener Reference Fengel and Wegener1989). Ash represents inorganic material, while extractives are a mobile source of organic C translocated among rings (Tans et al. Reference Tans, De Jong and Mook1978; Harlow et al. Reference Harlow, Marshall and Robinson2006; Szymczak et al. Reference Szymczak, Joachimski, Bräuning, Hetzer and Kuhlemann2011). There is consensus in the radiocarbon community that extractives need to be removed prior to 14C dating of tree rings. By contrast, the choice of which different wood structural fractions to isolate (bulk wood, holocellulose, or α-cellulose) is still under discussion (Southon and Magana Reference Southon and Magana2010).
After reviewing a large body of literature on wood pretreatments, we carried out different techniques in order to optimize a protocol adapted to the main types of wood samples (i.e. modern and subfossil wood from coniferous and broadleaf trees). For this purpose, we performed numerous tests on known-age woods. Our criterion for the best pretreatment is the effectiveness of exogenous carbon removal—associated with short and simple procedures—which limits secondary contamination during sample pretreatment. The 14C results are complemented with δ13C, C percentage and mass yield obtained from the different procedures.
We then used our selected method to date the wood samples of the Sixth International Radiocarbon Intercomparison (SIRI), in order to confirm the chosen method by comparing the results of our measurements with the consensus values obtained in the framework of the SIRI intercomparison. As a further validation and first scientific contribution, we analyzed important tree-ring sequences from subfossil pines collected in the southern French Alps. The new results at high resolution were then compared first with previous measurements obtained by high precision measurements on CO2 from large samples (Kaiser et al. Reference Kaiser, Friedrich, Miramont, Kromer, Sgier, Schaub, Boeren, Remmele, Talamo, Guibal and Sivan2012) and then with 14C results on Kauri trees from New Zealand (Hogg et al. Reference Hogg, Southon, Turney, Palmer, Bronk Ramsey, Fenwick, Boswijk, Friedrich, Helle, Hughen, Jones, Kromer, Noronha, Reynard, Staff and Wacker2016a, Reference Hogg, Southon, Turney, Palmer, Bronk Ramsey, Fenwick, Boswijk, Büntgen, Friedrich, Helle, Hughen, Jones, Kromer, Noronha, Reinig, Reynard, Staff and Wacker2016b), enabling us to study the 14C interhemispheric gradient during an interval of the Younger Dryas climatic event.
Previous Works on Wood Pretreatments
Several types of chemical pretreatment have been developed previously with differences aimed at targeting different wood ages (e.g. pre- or post-bomb; Stuiver and Quay Reference Stuiver and Quay1981), different wood species (Hoper et al. Reference Hoper, McCormac, Hogg, Higham and Head1998; Borella et al. Reference Borella, Leuenberger, Saurer and Siegwolf1998; Cullen and McFarlane Reference Cullen and MacFarlane2005; Rinne et al. Reference Rinne, Boettger, Loader, Robertson, Switsur and Waterhouse2005) or particular contaminants (Bruhn et al. Reference Bruhn, Duhr, Grootes, Mintrop and Nadeau2001; Dee et al. Reference Dee, Brock, Bowles and Bronk Ramsey2011; Capano et al. Reference Capano, Marzaioli, Passariello, Pignatelli, Martinelli, Gigli, Gennarelli, De Cesare and Terrasi2012; Fedi et al. Reference Fedi, Caforio, Liccioli, Mandò, Salvini and Taccetti2014).
The classical ABA (acid-base-acid) method described by de Vries and Barendsen (Reference de Vries and Barendsen1954) is routinely used in many laboratories for the pretreatment of various organic samples, including wood. Largely modified in the different 14C laboratories (Santos and Ormsby Reference Santos and Ormsby2013), this method isolates the wood cellulose and lignin and removes exogenous inorganic and organic carbon. Nevertheless, the ABA treatment can leave behind a residual contamination in very old samples (i.e. blank 14C samples; Santos et al. Reference Santos, Bird, Fifield, Alloway, Chappell, Hausladen and Arneth2001; Southon and Magana Reference Southon and Magana2010). For this reason, the isolation of the cellulose, the most stable wood component, could prove useful. Moreover, for studying post-bomb tree rings at annual resolution, it is extremely important to isolate the carbon assimilated in the corresponding growth year, as non-cellulosic compounds can be synthesized the year after the ring formation or can be translocated between several rings (Cain and Suess Reference Cain and Suess1976; Gray and Thompson Reference Gray and Thompson1977; Leavitt and Danzer Reference Leavitt and Danzer1993; Anchukaitis et al. Reference Anchukaitis, Evans, Lange, Smith, Leavitt and Schrag2008).
An open question remains as to whether a particular cellulosic fraction (α-cellulose) should be extracted or if the isolation of the holocellulose (composed of α-cellulose and hemicelluloses) is sufficient. With the aim of isolating one of the most stable wood components, α-cellulose has been preferred, particularly in stable isotope analysis. Following the method proposed by Green (Reference Green1963), several modifications have been developed to improve the protocol (Loader et al. Reference Loader, Robertson, Barker, Switsur and Waterhouse1997; MacFarlane et al. Reference MacFarlane, Warren, White and Adams1999; Rinne et al. Reference Rinne, Boettger, Loader, Robertson, Switsur and Waterhouse2005; Cullen and MacFarlane Reference Cullen and MacFarlane2005; Gaudinski et al. Reference Gaudinski, Dawson, Quideau, Schuur, Roden, Trumbore, Sandquist, Oh and Wasylishen2005; Anchukaitis et al. Reference Anchukaitis, Evans, Lange, Smith, Leavitt and Schrag2008; Southon and Magana Reference Southon and Magana2010; Staff et al. Reference Staff, Reynard, Brock and Bronk Ramsey2014).
Nevertheless, these α-cellulose extraction methods remain tedious and time consuming, and several studies have explored other procedures used in the chemical industry to obtain a residue similar to α-cellulose (Wallis et al. Reference Wallis, Wearne and Wright1997; Macfarlane et al. Reference MacFarlane, Warren, White and Adams1999; Brendel et al. Reference Brendel, Iannetta and Stewart2000; Cullen and MacFarlane Reference Cullen and MacFarlane2005; Gaudinski et al. Reference Gaudinski, Dawson, Quideau, Schuur, Roden, Trumbore, Sandquist, Oh and Wasylishen2005; Anchukaitis et al. Reference Anchukaitis, Evans, Lange, Smith, Leavitt and Schrag2008; Němec et al. Reference Němec, Wacker, Hajdas and Gäggeler2010; Li and Liu Reference Li and Liu2013; Liu et al. Reference Liu, Sun, Hao, Huang, Xue and Mu2015). Unfortunately, these industrial pretreatments may not be suitable for 14C analyses (Gaudinski et al. Reference Gaudinski, Dawson, Quideau, Schuur, Roden, Trumbore, Sandquist, Oh and Wasylishen2005; Anchukaitis et al. Reference Anchukaitis, Evans, Lange, Smith, Leavitt and Schrag2008).
In addition, chemical analyses performed on isolated α-cellulose clearly show that some hemicellulose residues remain after the extraction (Green Reference Green1963; Loader et al. Reference Loader, Robertson, Barker, Switsur and Waterhouse1997; Wallis et al. Reference Wallis, Wearne and Wright1997; Gaudinski et al. Reference Gaudinski, Dawson, Quideau, Schuur, Roden, Trumbore, Sandquist, Oh and Wasylishen2005). Fortunately, there does not seem to be a systematic difference between the 14C results of α-cellulose and holocellulose residues (Southon and Magana Reference Southon and Magana2010). The isolation of the holocellulose may thus be sufficient for 14C analyses, above all because its separation is quicker than the full α-cellulose extraction.
-
I. TESTING WOOD PRETREATMENTS
MATERIAL AND METHODS
In order to choose the best treatment adapted to different conditions, several chemical protocols were performed on six samples of known age:
-
a) IAEA-C3 is the cellulose standard, in which the certified F14C is 1.2941±0.0006 and the δ13C is –24.9‰ (Rozanski et al. Reference Rozanski, Stichler, Gonfiantini, Scott, Beukens, Kromer and van der Plicht1992).
-
b) Quercus-1980 is the wood of an oak tree (Quercus pubescens Willd.) from Aix-en-Provence (France), which was cut in winter 2014–2015. Only the latewood of the ring corresponding to the year 1980 was sampled, in order to isolate the C assimilated in the corresponding growth year.
-
c) Larix-1980 is the wood of a larch tree (Larix decidua Mill.) from the Alps of Haute Provence (France). The last ring before the bark is dated to 1994, and only the latewood of the ring corresponding to the year 1980 was isolated.
-
d) COUT203 is the wood of a subfossil pine tree (Pinus sylvestris L.) from the Alps of Haute Provence (France). It has a sequence of 170 yr included in a floating chronology (Sivan et al. Reference Sivan, Miramont and Édouard2006; Miramont and Sivan Reference Miramont and Sivan2008). The group of rings 150–160 from COUT203 tree, previously dated at the Poznan AMS laboratory to 7260±40 BP after the ABA pretreatment, was analyzed.
-
e) Plio is the wood of a fossil tree found in a canyon in Nice (France), corresponding to the Messinian period of the Pliocene (personal communication with Jean Claude Hippolyte). This sample is thus expected to be devoid of 14C.
-
f) VIRI-K is the wood of a Miocene tree, distributed as a blank in the framework of the Fifth International Radiocarbon Intercomparison (Scott et al. Reference Scott, Cook and Naysmith2010).
The two modern wood samples (b, c) were chosen for the high precision dating comparison associated with the atmospheric 14C bomb spike, assuming that the latewood grew between July and October 1980 (Hua et al. Reference Hua, Barbetti and Rakowski2013). In addition, the chosen samples enable testing different species of trees, both broadleaf and coniferous, with greater difficulty expected for the delignification of the coniferous wood (Cullen and MacFarlane Reference Cullen and MacFarlane2005). The two wood blanks were selected to quantify the modern carbon contamination. The state of preservation of Plio is not optimal as it shows charcoal consistency, probably due to advanced mineralization process, and it will thus be useful for selecting procedures able to pretreat fragile samples. Finally, COUT203 was chosen because it belongs to the same species and it comes from the same region as the subfossil wood used for our 14C calibration project (Section II below).
Samples were sliced in small pieces (ca. 2 mm3) and ca. 100 mg were isolated for most of them, with the exception of Plio, whose deteriorated wood required ca. 500 mg of material.
Based on previous experience (Capano et al. Reference Capano, Marzaioli, Sirignano, Altieri, Lubritto, D’Onofrio and Terrasi2010, Reference Capano, Marzaioli, Passariello, Pignatelli, Martinelli, Gigli, Gennarelli, De Cesare and Terrasi2012, Reference Capano, Altieri, Marzaioli, Sirignano, Pignatelli, Martinelli, Passariello, Sabbarese, Ricci, Gigli and Terrasi2013) and review of the literature, we have used the following chemical protocols to process these samples. Figure 1 provides a visual summary of these procedures:
-
a) ABA (acid-base-acid) method (de Vries and Barendsen Reference de Vries and Barendsen1954), with a modified procedure using HCl, NaOH, HCl at 3% concentration for 1 hr each (Passariello et al. Reference Passariello, Marzaioli, Lubritto, Rubino, D’Onofrio, De Cesare, Borriello, Casa, Palmieri, Rogalla, Sabbarese and Terrasi2007).
-
b) BABA (base-acid-base-acid), an ABA method with 4% reagent solutions, preceded by an overnight bath in base solution (Kromer et al. Reference Kromer, Manning, Friedrich, Talamo and Trano2010). It was performed for comparison with the standard ABA method, because high pH (i.e. first long alkaline bath) helps to dissociate the main wood components (Němec et al. Reference Němec, Wacker, Hajdas and Gäggeler2010).
-
c) BABAB (base-acid-base-acid-bleaching) method with solutions at 4% (Němec et al. Reference Němec, Wacker, Hajdas and Gäggeler2010). This method entails an overnight alkaline bath for disrupting wood structure before the following treatment (Němec et al. Reference Němec, Wacker, Hajdas and Gäggeler2010) and a bleaching step for holocellulose isolation.
-
d) BABAB-mod is a BABAB modified method from Němec et al (Reference Němec, Wacker, Hajdas and Gäggeler2010). The difference with respect to the original pretreatment is the reduced duration for the initial bath in base solution to 2 hr, in order to reduce the overall duration of the process.
-
e) Holo-cell is a more classical holocellulose extraction procedure modified from Capano et al. (Reference Capano, Marzaioli, Sirignano, Altieri, Lubritto, D’Onofrio and Terrasi2010). The treatment consists of the following: I) an HCl bath at 4% for 1 hr; II) bleaching (60 g of NaClO2 in 1 L ultrapure H2O in acid solution (HCl) at pH 3, repeated twice for 1.5 hr each); III) a NaOH bath at 4% for 1 hr, used to remove lignin residue and a portion of the hemicellulose residues (a step which is missing in the BABAB method); and IV) a final HCl bath at 4% concentration.
-
f) α-cellulose extraction procedure modified from Cullen and MacFarlane (Reference Cullen and MacFarlane2005). In order to reduce procedural time, the soxhlet was substituted with several cycles of ultrasonic baths in organic solvents: five 20-min baths in ethanol-toluene (1:2), five 20-min baths in ethanol, and five 20-min baths in ultrapure water. The following day, the cellulose extraction was performed as in the procedure described above [procedure e)], but with NaOH at 17%, which is the minimum concentration for the isolation of α-cellulose, according to Cross and Bevan (Reference Cross and Bevan1912). This α-cellulose pretreatment lasts for two days and it is performed to test whether a better blank could be achieved.
-
g) BABBA1 (base-acid-bleaching-base-acid) is the combining of the two holocellulose extraction methods (procedures d/ e/): the holo-cell treatment is preceded by a bath in NaOH, reduced to 1 hr. Bleaching is performed in two baths of 1 hr each; while the last NaOH and HCl baths are reduced to 30 min. The reaction time is reduced because the first alkaline bath should already disrupt wood structures and facilitate the cellulose extraction (Němec et al. Reference Němec, Wacker, Hajdas and Gäggeler2010).
-
h) BABBA2 (base-acid-bleaching-base-acid) is the same as BABBA1 (described above), but with 1-hr durations for the last NaOH and HCl baths.
-
i) ABA-B is a classical ABA treatment followed by bleaching. Each bath in HCl, NaOH and HCl 4% solutions lasts for 1 hr. Bleaching was performed with 60 g of NaClO2 in 1 L of ultrapure water in acid solution (HCl) at pH 3. The bleaching step was performed once for 2 hr and was repeated twice for 1 hr, in cases of difficult samples. This treatment omits the post-bleaching bath in base solution and, for this reason, it leads to a less purified holocellulose fraction than do previously tested methods [procedures e), g), h)].
Schematic description of chemical pretreatments for dating wood; rep=repeatable step.

All chemical treatments were performed in glass tubes on a heated block at 70°C, equipped with an agitation system. Solutions of at least 10 mL were changed using plastic pipettes and neutralized with ultrapure water. Finally, samples were oven dried overnight at 70°C.
Several studies extract the resins with a soxhlet apparatus also in holocellulose extraction procedures. However, some other studies omit this soxhlet step (e.g. Němec et al. Reference Němec, Wacker, Hajdas and Gäggeler2010; Southon and Magana Reference Southon and Magana2010) and Rinne et al. (Reference Rinne, Boettger, Loader, Robertson, Switsur and Waterhouse2005) demonstrated that NaOH is sufficient to remove resins from Pinus sylvestris. Consequently, we also omitted the soxhlet step for the holocellulose extraction because our purpose is to select a simple and time-effective procedure.
Each chemical procedure was repeated at least three times on blank samples (Plio and VIRI-K), in order to quantify the reproducibility of blanks. Indeed, this is the parameter that matters most in the propagation of errors for unknown samples. In order to evaluate the 14C contamination level before any pretreatments, all samples were additionally analyzed without pretreatment.
We measured the mass yield by weighing the initial dried sample and residue after pretreatment, as well as the C percentage by means of the elemental analyzer (EA, VarioMicroCube Elementar). The BABAB method was performed only to compare its mass yield with that of its modified version (BABAB-mod).
After chemical pretreatment, the dried residual samples were weighed in a tin capsule, combusted by using the EA, and the CO2 was finally transformed into graphite with the AGE III system. The graphite target was then analyzed for its 14C/12C and 13C/12C ratios by means of AixMICADAS (Bard et al. Reference Bard, Tuna, Fagault, Bonvalot, Wacker, Fahrni and Synal2015).
Standards (OxA2 NIST SRM4990C) and blanks (phthalic acid) were processed together with samples and used for normalization and blank correction. Blank samples (Plio and VIRI-K) were not corrected for background. Two measurements for each chemical pretreatment were performed for all samples (three replicates for blanks).
An additional uncertainty of 1.6‰ was propagated in the 14C analytical errors. This additional error is based on the long-term laboratory statistics of measurements of the IAEA-C3 standard, processed with the chosen chemical pretreatment (ABA-B). The 14C data are reported in terms of conventional 14C age BP and in terms of F14C, which is the 14C/12C isotope ratio after normalization and blank correction (Stuiver and Polach Reference Stuiver and Polach1977; Reimer et al. Reference Reimer, Brown and Reimer2004; van der Plicht and Hogg Reference van der Plicht and Hogg2006). The 13C/12C ratios are reported using the conventional δ notation by using OxA2 NIST standard. All reported values for C% and 13C/12C ratios are the average of at least two replicates and listed errors are the standard deviations (SD) among replicates.
Results on Mass Yield, C%, and 13C/12C Ratio
The mass yield after the different pretreatments varies extensively because it depends on the efficiency of the isolation of the wood fraction and the loss of unwanted material (Table 1). The wood mass yield probably also depends on the type of tree, its age and state of preservation. Additional sources of variability are found in the incidental physical loss of the sample at each liquid-solid separation performed by manual pipetting during the pretreatments. As suggested by three replications of blank samples this variability could be on the order of several percent (from 1 to 7%; Table 1).
The yield mass (%) of all samples is given after each pretreatment method. Plio and VIRI_K values are followed by the standard deviation of replications of the same pretreatment.

As expected, the least aggressive procedure (ABA) leads to the highest mass recovery for the wood residue, whereas BABA leads to a more thorough extraction and, hence, to lower residual mass. For most samples, the α-cellulose extraction is the most aggressive pretreatment, leading to a smaller wood residue after extraction. In the case of the Plio blank wood, the sample disappeared completely in two α-cellulose extractions, while a very small residue amenable to 14C dating was recovered in the third replicate. Because of this extremely poor incidence of recovery leading to sub-optimal 14C results (see below), the α-cellulose treatment is clearly not optimal for our purposes.
An initial bath in base solution may already destroy part of the cellulose, as suggested by the results obtained on the C3 standard made of pure cellulose. Indeed, the mass yield for C3 is lower for the pretreatment procedures, which incorporate this initial step (BABAB-mod and BABBA1), than for those which omit it (Holo-cell and ABA-B).
In general, the ABA-B procedure is among the most thorough protocols leading to rather small residues for the various samples (Table 1). At the same time, this relatively simple method allows preservation of a significant mass of the old and damaged Plio blank wood, enabling its subsequent 14C dating (see below).
When the BABAB method is compared with its modified version (BABAB-mod), two samples (COUT203 and Plio) show the same % yield, while Larix-1980 and VIRI-K exhibit higher yields after the BABAB-mod. Although still compatible with random scatter, this may indicate that for well-preserved wood, the length of the initial bath in base solution results in the removal of more material as reaction time increases. By contrast, the BABBA1 and BABBA2 procedures lead to similar mass yields (Table 3), indicating that lengthening the final baths in basic and acidic solutions does not improve the extraction.
The molecular percentage of carbon in cellulose is 44.4% (Vertregt and de Vries Reference Vertregt and de Vries1987), but it frequently ranges from 43 to 45% (Cullen and MacFarlane Reference Cullen and MacFarlane2005). This is compatible with the value measured on C3 samples with or without pretreatments (43 to 44 %). All untreated woods show high values (ranging between 47 and 53%), indicating the presence of other compounds such as extractives and lignin that have higher C %. However, wood treated with ABA and BABA procedures show higher C concentration, which is probably linked to removal of the ash that is devoid of C (Table 2). It is noteworthy that the %C results after all pretreatments incorporating a bleaching step are compatible with the cellulose range (43–45%).
Percentages of C of all samples are given for each pretreatment method. All values are followed by standard deviation of same sample/treatment replications.

Several authors have shown that different wood fractions are characterized by different δ13C ‰, and that the cellulose fraction shows less negative δ13C values with respect to bulk wood (Borella et al. Reference Borella, Leuenberger, Saurer and Siegwolf1998; Hoper et al. Reference Hoper, McCormac, Hogg, Higham and Head1998; Cullen and MacFarlane Reference Cullen and MacFarlane2005; Cullen and Grierson Reference Cullen and Grierson2006; Harlow et al. Reference Harlow, Marshall and Robinson2006). Even if the δ13C measurements by AMS have a rather low precision (on the order of 1 ‰ for AixMICADAS; Bard et al. Reference Bard, Tuna, Fagault, Bonvalot, Wacker, Fahrni and Synal2015) the results obtained on untreated and pretreated wood clearly confirm this trend (Table 3). Indeed, all procedures incorporating a bleaching step for cellulose isolation, lead to a systematic δ13C increase by up to several ‰ (the only exception is for the Quercus-1980 which, after α-cellulose extraction, remains compatible within the large δ13C errors, with the untreated wood).
The δ13C ‰ of all samples is given for each pretreatment method. All values are followed by standard deviation of same sample/treatment replications.

14C results on Standards and Known-Age Woods
Figures 2–4 illustrate the results of standard C3, Quercus-1980, and Larix-1980 modern samples. Because of the expected difficulty of cellulose extraction in coniferous wood as opposed to broadleaf wood (Cullen and MacFarlane Reference Cullen and MacFarlane2005), pretreatments were tested extensively on Larix-1980 with all variants of our chemical procedures (Figure 4).
F14C analyses of the IAEA-C3 standard pretreated with different methods (error bars are ±1σ, including counting statistics and sample preparation uncertainties), compared with certified standard value (between dashed lines). Five 14C measurements, from five samples that underwent different combustions/graphitizations, were performed for each pretreatment, with the exception of ABA-B, measured 22 times (22 different samples) from five replications of the same chemical pretreatment. For each treatment, the average value followed by the SD is indicated. For the ABA-B pretreatment, the weighted mean with its ±1σ weighted error is reported in the small dot close to the series of individual F14C values.

F14C content of the latewood of Quercus-1980 (error bars are ±1σ, including counting statistics and sample preparation uncertainties), compared with clean air F14C values (1σ) of the corresponding period (between solid black lines; Hua et al. Reference Hua, Barbetti and Rakowski2013). Two 14C measurements, from two samples that underwent different combustions/graphitizations, were performed for each pretreatment. The weighted average of all values obtained from pretreatments is the red solid line, while the corresponding ±1σ weighted error is shown by dashed red lines. (Color refers to online version.)

F14C content of the latewood of Larix-1980 (error bars are ±1σ, including counting statistics and sample preparation uncertainties), compared with clean air F14C values (±1σ) of the corresponding period (between solid black lines; Hua et al. Reference Hua, Barbetti and Rakowski2013). Two 14C measurements, from two samples that underwent different combustions/graphitizations, were performed for each pretreatment. The weighted average of all values obtained from pretreatments is the red solid line, while the corresponding ±1σ weighted error is shown by dashed red lines. (Color refers to online version.)

The results of C3 and Larix-1980 show no difference between samples of the same material analyzed with or without chemical treatment, indicating the absence of contamination in the original materials (Figures 2 and 4). By contrast, the Quercus-1980, measured without chemical pretreatment, exhibits F14C results clearly lower than those of all pretreated samples, indicating a younger contamination. This could be due either to an unusual carbon translocation between rings or to artifacts acquired during tree sampling, storage or laboratory manipulation.
Overall, the results of these three modern samples show that there is no significant difference among the pretreatments, which all lead to accurate values: the IAEA certified value for C3 and clean air atmospheric values for Quercus-1980 and Larix-1980 (Figures 2–4).
Similarly, the results for the subfossil pine COUT203 measurements show no 14C age difference among pretreatments, nor even for the absence of pretreatment (Figure 5). This indicates the lack of contamination in the original wood. Furthermore, our results are compatible with a single 14C measurement performed at the Poznan AMS laboratory (Figure 5).
14C ages of the COUT203 sample, pretreated with different methods (error bars are 1σ, including counting statistics and sample preparation uncertainties), compared with previous 14C measurements performed in the Poznan laboratory (±1σ value between solid black lines; ±2σ between dashed black lines). Two 14C measurements, from 2 samples that underwent different combustions/graphitizations, were performed for each pretreatment. The weighted average of all values obtained from pretreatments is the red solid line, while the corresponding ±1σ weighted error is shown by dotted red lines. (Color refers to online version.)

In summary, the replication for each pretreatment gives highly reproducible results for most samples (Figures 2–5). The only significant differences are observed for the wood blanks (Figure 6). For the Plio wood, samples measured without pretreatment and with the simplest ABA pretreatment, exhibit the largest scatter, in contrast with the results obtained with other pretreatments. The BABA and cellulose extraction procedures (with the exception of α-cellulose and ABA-B procedure) give similar results with average values ranging from 0.0025 to 0.0020 F14C (48,300 to 50,000 BP; Figure 6A).
F14C content of blank samples (A: Plio; B: VIRI-K) pretreated with different methods (error bars are 1σ). Different pretreatments (pretr.) were performed for each method (i.e. 1 pretr., 2 pretr., etc. indicate the specific—first, second, etc.—replication of each pretreatment: ABA, BABA, etc.) and two AMS measurements were performed for each pretreatment, when enough material was available. The only exception is VIRI-K treated with ABA-B, which was measured more than twice for each pretreatment. The total numbers of measurements (# meas.) are given for each method at the beginning of each line of the Figure, as well as the 14C age average with SD. No background correction has been subtracted.

As anticipated, the α-cellulose extraction is probably too aggressive for this very old and poorly preserved sample. Indeed, this procedure destroyed most of the material in two of the three extractions (see also the discussion of extraction yields, above). Moreover, our single measurement on this small-sized residual cellulose sample show a F14C of 0.0037, corresponding to an age of 45,000 BP. This is probably linked to an increase of the relative impact of the contamination compared to the small amount of residual carbon for this sample.
The first ABA-B pretreatment of the Plio wood was performed with one final bleaching 2-hr step, during which intense effervescence occurred. The results of three replications of this pretreatment (6 measurements) show an average value of 0.0022 F14C with an SD of 0.0006 (49,300 with an SD of 2500 yr BP). Three additional pretreatments were performed with two 1-hr bleaching steps instead of one bleaching step lasting 2 hr. The six new results give an average F14C value of 0.0015, corresponding to an age of 52,300 yr BP with an SD of 150 yr, which is better than the first ABA-B procedure (Figure 6A).
Concerning the VIRI-K blank wood (Figure 6B), untreated samples exhibit ages ranging between 0.0040 and 0.0021 F14C (corresponding to an age between 44,400 and 49,700 yr BP), which is older than those observed for the Plio untreated samples that range between 0.0066 and 0.0028 F14C (between 40,400 and 47,100 yr BP). This may be due to heterogeneities in the younger material contaminating these blank samples or may reflect a random scatter. The age results for the samples pretreated with the ABA procedure show high variability, similar to that observed for the Plio wood. The BABA pretreatment applied to VIRI-K leads to higher blank values than for Plio, while the BABAB-mod, Holo-cell and α-cellulose procedures show comparable results of about 0.0020 F14C (50,000 yr BP) on average. The higher scatter of α-cellulose values might be explained by increased contamination during this long pretreatment, which include many steps.
Results with the BABBA1 procedure gave an average value of 0.0030 F14C with an SD of 0.0009 (47,000 yr BP with an SD of 2700), a higher and more scattered blank value than for previous cellulose extraction procedures. These results were somewhat surprising, considering that BABBA1 combines the strengths of the BABAB-mod and Holo-cell methods, which both provided better blanks. The procedure was thus strengthened (BABBA2) with longer NaOH and HCl steps. The BABBA2 results exhibit a smaller scatter, but the average blank value is still rather high: 0.0029 F14C with an SD of 0.0004 (equivalent to 47,100 yr BP with a SD of 1000; Figure 6B) when compared to other results for this wood and to measurements obtained for the Plio wood. An additional source of variability may also be linked to contamination during the rather long and strong BABBA procedures.
Finally, the ABA-B procedure gave excellent results with a low background average value and a rather small scatter (Figure 6B). This confirms a similar observation detected for the Plio wood measured with the same procedure. In order to further test its reproducibility, ABA-B was repeated again 9 times on VIRI-K, leading to a total of 25 measurements which gave an average value of 0.0017 with an SD of 0.0003 (corresponding to an age of 51,300 yr BP and an SD of 1500; Figure 6B).
The ABA-B procedure was thus chosen as the preferred protocol based on its precise and accurate measurements on modern, ancient and blank wood samples. This procedure is also optimal because its overall duration is shorter than most of the other procedures.
Further Validation of the Preferred Wood Pretreatment
After the phase of developments and tests described above, the preferred ABA-B procedure was used to date the wood samples distributed in the frame of the 2013 SIRI Radiocarbon Intercomparison. The chemical extraction was performed twice for each sample and two 14C measurements were generally made for each pretreatment (Table 4). C3 samples and VIRI-K blank wood, pretreated with ABA-B treatment, were used respectively as control standards and for background correction. The 14C measurements performed with AixMICADAS followed the same protocol as described in the previous section, with a new convention for the background correction and error propagation: it was performed by using the average blank value obtained during the measurement session and a conservative variability of F14C=0.0003 (value obtained from the standard deviation of 25 VIRI-K blanks). In rare cases of blank variability larger than F14C=0.0003 during a particular session, the measured variability during the session is used instead for the error calculation.
Results of the Sixth International Radiocarbon Intercomparison (SIRI) 2013: official Intercomparison results (Scott et al Reference Scott, Naysmith and Cook2016) and our results with relative 1σ uncertainty (14C age and F14C). The number of measurements determined in Aix-en-Provence is indicated in the last column.

a 14C finite age after blank subtraction.
b Weighted means of 14C age without blank subtraction.
c Weighted means of 14C age after blank subtraction (the F14C of mean blank is 0.0023±0.0003 and 0.0016±0.0003, respectively, for the two magazines of graphite targets). These conventional age values are calculated following van der Plicht and Hogg (Reference van der Plicht and Hogg2006), who recommend to using F14C=F14C+2 σ when F14C<2 σ.
Table 4 provides the weighted means and errors for the different samples, in comparison with average results from the SIRI intercomparison (Scott et al. Reference Scott, Naysmith and Cook2016). Our results are in very good agreement with the SIRI results, which further validate our choice of the ABA-B pretreatment.
-
II. Dating a Pine Sequence Belonging to the Younger Dryas Event
STUDY AREA AND CONTEXT
In the region of the upper course of the Durance River in the Southern French Alps, many subfossil woods (Pinus sylvestris L.) were discovered in alluvial sediments dated from Late Glacial to the first part of the Holocene (Miramont et al. Reference Miramont, Sivan, Rosique, Edouard and Jorda2000). Since the end of the last glacial period, the rivers of this region have been characterized by alluvial detrital phases, interrupted by periods of river incision. Pines were buried by floods during these sedimentation phases. Marl soils allowed the very good preservation of these subfossil stems, which were sometimes preserved with their bark. These subfossil pines were subsequently revealed by the modern incision of the rivers.
Eighteen subfossil stems were discovered in the Barbiers River alluvium in the region of Sisteron. Because of the geomorphological stress and the harshness of the mountain climate, which is reinforced by the intensity and irregularity of the Mediterranean rainfall regime, tree growth was characterized by many anomalies, which made it difficult to synchronize all sequences with their dendrochronological patterns (Miramont et al. Reference Miramont, Sivan, Guibal, Kromer, Talamo and Kaiser2011). So far, only a few trees have been grouped into two floating chronologies: BARB-A and BARB-B (Miramont et al. Reference Miramont, Sivan, Guibal, Kromer, Talamo and Kaiser2011). Preliminary 14C ages were used to tentatively place these trees on the absolute dendrochronological timescale (Kaiser et al. Reference Kaiser, Friedrich, Miramont, Kromer, Sgier, Schaub, Boeren, Remmele, Talamo, Guibal and Sivan2012).
MATERIALS AND METHODS
The trees selected for this study are Barb12 and Barb17. Barb12 has a sequence of 210 rings that are are narrow at the end of the sequence; while Barb17 has a sequence of 167 rings that are very narrow at the beginning and the end of the sequence. While Barb12 is included into BARB-A chronology, Barb17 is not. A preliminary synchronization of Barb17 with the other trees of BARB-A was proposed by Miramont et al. (Reference Miramont, Sivan, Guibal, Kromer, Talamo and Kaiser2011), but the quality of the dendro-correlation resulted in its exclusion from the BARB-A chronology. For the present work, a new slice was cut from the same stem with a total length of 173 rings. Five additional rings were discovered at the beginning of the new sequence (considered to be the pith). Following the former dendrochronological sequence, the five new rings were counted with negative numbers (from –5 to –1). For the Barb12 tree, only the initial clear sequence of 163 rings has been analyzed.
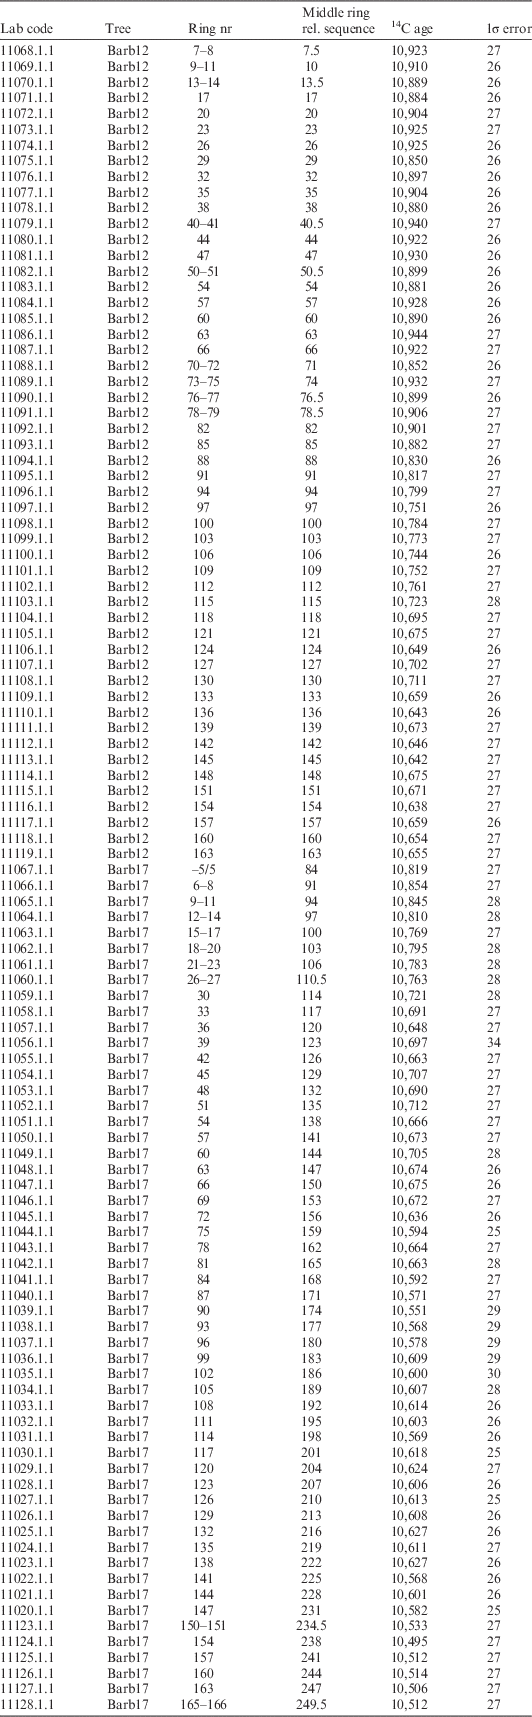
The new sequences were sampled at annual resolution when permitted by the ring width, by using a scalpel and with the help of a binocular microscope (Figure 7, Table 5). As a first step, every third ring was pretreated for 14C analysis. These samples were sliced in small pieces and pretreated by using the ABA-B method (as described and tested in the first part of this work) before being combusted, graphitized with the AGE system and measured with AixMICADAS.
Comparison between 14C measurements on the Barb12 and Barb17 trees performed in Germany (Mannheim and Heidelberg; Miramont et al. Reference Miramont, Sivan, Guibal, Kromer, Talamo and Kaiser2011; Kaiser et al. Reference Kaiser, Friedrich, Miramont, Kromer, Sgier, Schaub, Boeren, Remmele, Talamo, Guibal and Sivan2012) and in Aix-en-Provence. The vertical bars indicate 1σ sample uncertainty (including counting statistics and sample preparation uncertainties), while the horizontal bars indicate the number of rings included in each measured sample. Almost all Aix samples have annual resolution.

14C ages measured on the Barb12-17 sequence.
High precision 14C measurements were performed with long AMS runs to reach at least 800,000 ion counts for each OxA2 standards on the same magazine. In addition, C3 and VIRI-K samples were pretreated and measured in the same batch, serving as control modern standard and blank. As for other wood samples, an additional uncertainty of 1.6‰ was propagated in the 14C analytical errors and background correction followed the convention described above in the section on SIRI samples.
High-Resolution 14C Results on the Barb12-17 Trees
The new 14C data measured on selected annual rings from the Barb12-17 sequence can be compared with previous measurements: for the Barb17, previous measurements were performed on decadal samples (i.e. large samples mixing the wood of specific decades) performed by β-counting on CO2 in Heidelberg; while for the Barb12, the sequence was analyzed on five-year samples until ring 155, then on decadal samples by the AMS facility of Mannheim (Miramont et al. Reference Miramont, Sivan, Guibal, Kromer, Talamo and Kaiser2011; Kaiser et al. Reference Kaiser, Friedrich, Miramont, Kromer, Sgier, Schaub, Boeren, Remmele, Talamo, Guibal and Sivan2012). Figure 7 illustrates the very good agreement between the old and new datasets, generally well within the one sigma error bars. The Barb17 14C record can also be compared with other tree-ring sequences of the Younger Dryas period (Figure 8), as follows:
-
∙ The CELM chronology is a floating 1606-yr chronology composed of Swiss and German pines (Kaiser et al. Reference Kaiser, Friedrich, Miramont, Kromer, Sgier, Schaub, Boeren, Remmele, Talamo, Guibal and Sivan2012). The youngest tree of the sequence, G5, has been dated in several works from ca.12,500 to 12,844±32 cal BP (Hughen et al Reference Hughen, Southon, Lehman and Overpeck2000; Muscheler et al Reference Muscheler, Kromer, Björck, Svensson, Friedrich, Kaiser and Southon2008; Hua et al Reference Hua, Barbetti, Fink, Kaiser, Friedrich, Kromer, Levchenko, Zoppi, Smith and Bertuch2009; Bronk Ramsey et al Reference Bronk Ramsey, Staff, Bryant, Brock, Kitagawa, van der Plicht, Schlolaut, Marshall, Brauer, Lamb, Payne, Tarasov, Haraguchi, Gotanda, Yonenobu, Yokoyama, Tada and Nakagawa2012).
-
∙ The Swiss YDB chronology, which is the oldest part of the absolute dendrochronological chronology. For the IntCal13 14C calibration curve (Reimer et al. Reference Reimer, Bard, Bayliss, Beck, Blackwell, Bronk Ramsey, Buck, Cheng, Edwards, Friedrich, Grootes, Guilderson, Haflidason, Hajdas, Hatté, Heaton, Hoffmann, Hogg, Hughen, Kaiser, Kromer, Manning, Niu, Reimer, Richards, Scott, Southon, Staff, Turney and van der Plicht2013) the YDB started at 12,594 cal BP based on published studies (Schaub et al. Reference Schaub, Kaiser, Frank, Buentgen, Kromer and Talamo2008; Hua et al. Reference Hua, Barbetti, Fink, Kaiser, Friedrich, Kromer, Levchenko, Zoppi, Smith and Bertuch2009; Kaiser et al. Reference Kaiser, Friedrich, Miramont, Kromer, Sgier, Schaub, Boeren, Remmele, Talamo, Guibal and Sivan2012), but more recent work has shown that the YDB sequence remains floating and the absolute dendrochronological series only ends at 12,325 cal BP (M. Friedrich, IntCal dendro-meeting in Zürich, August 2015; Kromer et al. Reference Kromer, Friedrich and Talamo2015).
-
∙ The Kauri (Agathis australis) chronology, which is based on trees from New Zealand, and spans the period between ca. 11,694 and 13,134 cal BP without interruption. Despite the interhemispheric 14C gradient (see discussion below), the overlap with the absolute 14C series over ca. 200 years (ca. 11,694–11,900 cal BP) enabled Hogg et al. (Reference Hogg, Southon, Turney, Palmer, Bronk Ramsey, Fenwick, Boswijk, Friedrich, Helle, Hughen, Jones, Kromer, Noronha, Reynard, Staff and Wacker2016a, Reference Hogg, Southon, Turney, Palmer, Bronk Ramsey, Fenwick, Boswijk, Büntgen, Friedrich, Helle, Hughen, Jones, Kromer, Noronha, Reinig, Reynard, Staff and Wacker2016b) to date the Kauri sequence precisely. In turn, the Kauri chronology has been used to connect the Swiss YDB and German/Swiss CELM sequences, extending the tree-ring record back to 14,174±3 cal BP (Hogg et al. Reference Hogg, Southon, Turney, Palmer, Bronk Ramsey, Fenwick, Boswijk, Friedrich, Helle, Hughen, Jones, Kromer, Noronha, Reynard, Staff and Wacker2016a, Reference Hogg, Southon, Turney, Palmer, Bronk Ramsey, Fenwick, Boswijk, Büntgen, Friedrich, Helle, Hughen, Jones, Kromer, Noronha, Reinig, Reynard, Staff and Wacker2016b).
Comparison between the tree-ring sequences of the Younger Dryas period. The YDB chronology, included in the IntCal13 curve, recently became floating (see text for details). In this figure we report the new position proposed by Hogg et al. (Reference Hogg, Southon, Turney, Palmer, Bronk Ramsey, Fenwick, Boswijk, Büntgen, Friedrich, Helle, Hughen, Jones, Kromer, Noronha, Reinig, Reynard, Staff and Wacker2016b). The Barb12-17 sequence is shown in its entire length (12,836–12,594 cal BP). The CELM chronology ends with tree G5. We decided to exclude tree G3, as other studies have done, because of the absence of published dendrochronological synchronization between this tree and CELM chronology. Overall, this figure illustrates the importance of the tree Barb17 tree in connecting the YDB and CELM chronologies.

In Figure 9, the new Barb17 sequence is matched against the YDB (Kaiser et al. Reference Kaiser, Friedrich, Miramont, Kromer, Sgier, Schaub, Boeren, Remmele, Talamo, Guibal and Sivan2012) and the Kauri chronologies (Hogg et al. Reference Hogg, Southon, Turney, Palmer, Bronk Ramsey, Fenwick, Boswijk, Friedrich, Helle, Hughen, Jones, Kromer, Noronha, Reynard, Staff and Wacker2016a). Assuming that the floating Kauri series is dated accurately, we dated our Barb12-17 14C sequence from about 12,836 to 12,594 cal BP. This preliminary dating was performed by visual tuning, considering especially the peak around 12,670 cal BP, which is present in both Barbiers from the Northern Hemisphere (NH) and the Kauri record from the Southern Hemisphere (SH; Figure 9). This global feature probably represents a solar event. Based on the new 14C dataset, the proposed dating shifts the Barb17 sequence towards an age older than previously thought (Miramont et al. Reference Miramont, Sivan, Guibal, Kromer, Talamo and Kaiser2011). Interestingly, the new 14C series for Barb12 and Barb17 provides support for a previous unpublished dendrochronological overlap, which was not considered sufficiently robust based on its statistical values (GlK=56%; TBP=4.0; TH=6.1 and CDI=25). Overall, this confirms the usefulness of the annual resolution sampling for a more precise synchronization.
Matching between available tree-ring sequences for the Younger Dryas period: for the Northern Hemisphere (NH), the Barb17 tree in pink, the Barb12 in blue and YDB in red (Hua et al. Reference Hua, Barbetti, Fink, Kaiser, Friedrich, Kromer, Levchenko, Zoppi, Smith and Bertuch2009); for the Southern Hemisphere (SH), the Kauri tree in green (Hogg et al. 2016) without interhemispheric gradient correction. Error bars are given at 1σ. (Colors refer to online version.)

The proposed date for Barb12-17 seems to be confirmed by the ca. 24-yr overlap with YDB chronology (Figure 9). Based on the comparison with our new Barb12-17 sequence, the last sample of tree G5 of the CELM chronology can be dated to ca. 12,635 cal BP (Figure 8).
14CO2 Atmospheric Interhemispheric Gradient
It is widely recognized that there is a small, but systematic 14C difference between wood from trees that lived at the exact same time in the northern and southern hemispheres (SH wood being consistently older than NH wood). This interhemispheric gradient (IHG) is maintained principally by the air-sea CO2 exchange with the ocean surface that is typically much older than the atmosphere (from 400 to 1200 yr; Bard Reference Bard1988). Indeed, there is proportionally more ocean surface in the SH than in the NH, and the Southern Ocean is also characterized by generalized upwelling of old water and intense CO2 piston velocity due to extreme winds in the 40° to 60°S latitude belt (Levin et al. Reference Levin, Kromer, Wagenbach and Munnich1987; Braziunas et al. Reference Braziunas, Fung and Stuiver1995). The situation is even more complex for recent trees because the IHG has been perturbed and reversed by the anthropogenic injection of fossil CO2 mainly in the NH (Stuiver and Braziunas Reference Stuiver and Braziunas1998; McCormac et al. Reference McCormac, Hogg, Higham, Baillie, Palmer, Xiong, Pilcher, Brown and Hoper1998).
Precise measuring of the IHG and of its possible variations through time is thus of prime interest to studying the global carbon cycle. Hogg et al. (Reference Hogg, Southon, Turney, Palmer, Bronk Ramsey, Fenwick, Boswijk, Friedrich, Helle, Hughen, Jones, Kromer, Noronha, Reynard, Staff and Wacker2016a, Reference Hogg, Southon, Turney, Palmer, Bronk Ramsey, Fenwick, Boswijk, Büntgen, Friedrich, Helle, Hughen, Jones, Kromer, Noronha, Reinig, Reynard, Staff and Wacker2016b) used 14C data measured in trees from the NH and SH to calculate the IHG during most of the Younger Dryas climatic event. The new Barb12-17 dataset from Southern France compared to the Kauri sequence from New Zealand can be used to estimate new IHG values for a ca. 220-yr interval that occurred during the Younger Dryas event.
A difficulty arises from the different resolution of the two records: the Kauri record is based on 14C replicates of wood homogenized over specific decades, whereas our Barb12-17 record is based on single-year wood dated every 3 yr. This latter record thus contains inter-annual noise linked to various effects on the 14C production and carbon cycle. Indeed, based on 14C analyses at annual resolution over the past 500 yr, Stuiver and Braziunas (Reference Stuiver and Braziunas1993, Reference Stuiver and Braziunas1998) evidenced significant spectral power for frequencies close to or lower than 10 yr, which should be present in the Barb12-17 record, but are inevitably smoothed out in the Kauri record. In order to reduce the inter-annual variability, we thus smoothed the Barb12-17 record with a Gaussian low-pass filter with a sigma of 3 yr. For Barb12-17, the smoothed values corresponding to individual analyzed samples were then grouped and averaged over the same decades as in the Kauri record. In order to fully take into account analytical uncertainties, the original measurement errors were used in the error propagation when calculating for each decade a weighted average and error of Barb12-17 samples. This conservative procedure has been used in Figure 10 to compare the Barb and Kauri records.
Comparison between Kauri and Barb12-17 Δ14C‰ records. The average difference associated with the IHG is given in the black line in the bottom of the graphic (y-axis on the right).

Twenty-three values of the 14C IHG can be calculated by subtracting the Barb12-17 smoothed 14C ages from the corresponding Kauri decadal 14C averages (Figure 9). The mean IHG value is 65 yr with a SD of 20 yr.
As shown in Figure 10, the IHG almost doubles during the drastic rise of Δ14C ‰ (i.e. 12,750–12,720 cal BP). Interestingly this transient IHG maximum occurs during the rapid 25‰ Δ14C rise starting at 12750 cal BP and stabilizing around 12,710 cal BP. More work is needed to understand the cause of this 25‰ Δ14C rise, notably comparing the 14C record with those based on other cosmogenic nuclides (e.g. 10Be in polar ice). Numerical modeling would also help studying the delayed response of the Southern Hemisphere.
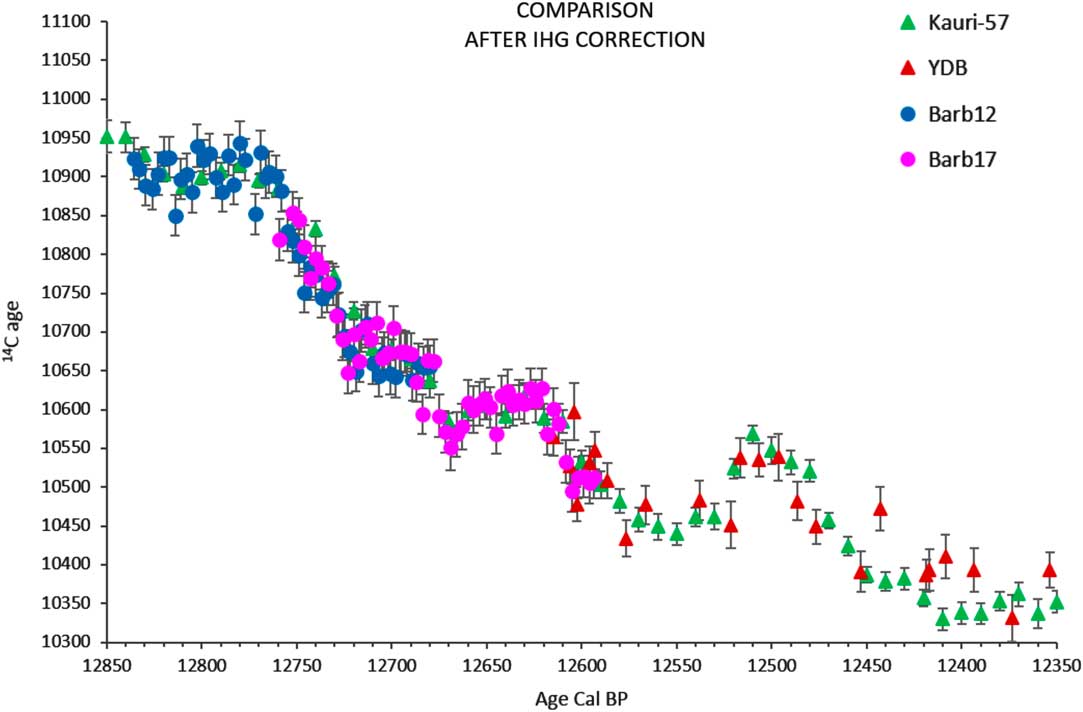
For the general comparison shown in Figure 11, we excluded this transient period in the IHG average calculation. The new mean IHG value is 57 yr with a SD of 11 yr, with an IHG maximum value (100 yr with a SD of 14 yr based on four values) during the drastic Δ14C ‰ rise. In Figure 11, the Kauri record is corrected by subtracting 57 yr in order to illustrate the agreement between the Kauri and Barb12-17 records.
Comparison between Kauri, YDB, Barb12, and Barb17 sequences, after subtracting 57 yr from Kauri 14C ages to correct for the interhemispheric gradient (IHG).
The IHG can also be calculated in terms of Δ14C unit: the total mean value is 10‰ with a SD of 3‰ (Figure 10); the value without 12,750–12,720 cal BP period is 9‰ with a SD of 2‰; finally the value during the 12,750–12,720 cal BP period is 15‰ with a SD of 2‰.
Our IHG determination is expected to be particularly robust during the 12,660–12,620 and 12,820–12,760 cal BP intervals because the individual 14C records exhibit so-called “age plateaus.” Indeed, over 12,660–12,620 cal BP the IHG average is 52 yr with a SD of 10 yr based on four individual Kauri-Barb12-17 comparisons included in this 14C plateau; while during the 12,820–12,760 cal BP interval the IHG average is 55 yr with a SD of 9 yr for the seven individual Kauri-Barb12-17 comparisons included in this plateau. Shifting the calendar age of the Barbiers curve with respect to the Kauri record would leave the interhemispheric 14C offset almost unchanged, precisely because of the presence of the same 14C “age plateaus” in both records.
This indicates that the IHG remained significant during this early stage of the YD event with a value close to the modelled preanthropogenic IHG (56 yr with a SD of 24 yr based on the last 500-yr mean; McCormac et al. Reference McCormac, Hogg, Blackwell, Buck, Higham and Reimer2004). Our IHG reconstruction agrees with that by Hogg et al. (Reference Hogg, Southon, Turney, Palmer, Bronk Ramsey, Fenwick, Boswijk, Friedrich, Helle, Hughen, Jones, Kromer, Noronha, Reynard, Staff and Wacker2016a) over the 12,650–12,620 cal BP plateau, but it differs for the 12,820–12,760 cal BP plateau, for which we find no evidence for an IHG collapse.
CONCLUSIONS AND PERSPECTIVES
The capacity to date wood has been established in the new 14C laboratory in Aix-en-Provence equipped with AixMICADAS and an automated graphitization system. In this study, different chemical pretreatments are tested on wood samples of known ages. The tested protocols vary from the simple ABA technique to more elaborate protocols for cellulose purification.
All pretreatments are efficient for dating pure cellulose (IAEA-C3 standard) and various wood samples, ranging from modern woods to a subfossil sample around 7000 yr BP. By contrast, different performances are observed for old woods reaching the 14C limit (“blank wood”). This is due to varying efficiencies of the contamination removal among protocols. We obtain the oldest and most reproducible 14C results with holocellulose extraction procedures.
The acid-base-acid-bleaching pretreatment (ABA-B) is selected as an optimal choice based on its limited duration and complexity, and because of the excellent and reproducible analytical results (as shown by 14C results, 13C/12C ratios, carbon % and overall mass yield %) that it ensures.
The efficiency of the ABA-B protocol is highlighted through the analysis of wood samples of the Sixth International Radiocarbon Intercomparison (SIRI). Our results are in good agreement with consensus values obtained by the SIRI participants.
The new method is applied to a ca. 240-yr-long tree-ring sequence from two subfossil pines (Barb12-17) collected in the southern French Alps and dated to the Younger Dryas cold period. The new 14C analyses at high resolution (every third year) agree well with high-precision results obtained previously. Barb12-17 is tentatively dated to the interval between 12,836 and 12,594 cal BP by matching its 14C pattern to the Kauri and YDB chronologies.
A mean IHG value of 57 yr with a SD of 11 yr is derived from the comparison with the Kauri sequence from New Zealand. The IHG stayed relatively high throughout the studied period, without evidence of a collapse around 12,800 cal BP. The IHG exhibits a transient maximum during the 12,750–12,710 cal BP interval. This period corresponds to a global rise of atmospheric ∆14C but with an apparent delay in the Southern Hemisphere. Future work will be focused on additional trees from the YD period and on complementary records from other archives for both 14C and 10Be.
ACKNOWLEDGMENTS
AixMICADAS was acquired and is operated in the framework of the EQUIPEX project ASTER-CEREGE (PI E Bard) with additional matching funds from the Collège de France, which also supports the salaries of the authors from CEREGE. Our work on subfossil wood is also supported by the ANR project CARBOTRYDH (PI E Bard). We are grateful to Marian Scott for providing the SIRI samples, to Tomasz Goslar for 14C age value of COUT203 and information about sample preparation, and to Jean Claude Hippolyte for the Pliocene wood.



