Implications
Mastitis is a common and recurrent disease on dairy farms and despite well-established prevention and control recommendations, many control programs fail to positively influence results. Many studies have shown that one of the risk factors related to this disease is the human factor. Successfully controlling the disease requires an effective and lasting change in management practices on farms, specifically changes in farmers’ behaviors. Therefore, if the human influences on mastitis are better understood, the work of professionals who aim to control and prevent the disease can be facilitated, thereby increasing their chances of success.
Introduction
Mastitis is one of the main problems faced by dairy farmers worldwide. This problem mainly relates to financial losses suffered because of the infection of the herd, including the money spent on the diagnosis, treatment and culling of animals and the reduction in milk production (Halasa et al., Reference Halasa, Huijps, Østerås and Hogeveen2007; Hogeveen et al., Reference Hogeveen, Huijps and Lam2011). One way to reduce the economic impact of mastitis is to invest in prevention and control programs (Miller and Bartlett, Reference Miller and Bartlett1991; Yalcin et al., Reference Yalcin, Stott, Longue and Gunn1999; Yalcin and Stott, Reference Yalcin and Stott2000). Preventive programs are mostly based on 10 points recommended by the National Mastitis Council. However, the failure rate of these programs in Brazil and other countries is often quite high (Vaarst et al., Reference Vaarst, Paarup-Laursen, Houe, Fossing and Andersen2002; Huijps et al., Reference Huijps, Hogeveen, Lam and Huirne2009).
This failure may be related to the multifactorial nature of the disease. One of the risk factors that has gained prominence in recent years is the human factor. For instance, a study in the Netherlands showed that farmers’ attitudes toward mastitis were responsible for up to 48% of the variation in the bulk tank somatic cell count (BTSCC) (Jansen et al., Reference Jansen, Van den Borne, Renes, Van Schaik, Lam and Leeuwis2009). Therefore, dairy farmers’ attitudes may affect the results and, consequently, the success of mastitis control programs (Van der Borne et al., Reference Van der Borne, Jansen, Lam and Van Schaik2014). Thus, disease control programs should also focus on not only the technical aspects of control and prevention but also the human factor. The human factor could explain, for example, the lack of continuity in improving the quality of milk after prevention and control programs are implemented, as most of the changes made during the program need to be incorporated into the farm routine and depend on behavioral changes. Therefore, improving the effectiveness of such programs depends on studying behaviors and attitudes.
Among the various theories on human behavior, researcher B. J. Fogg at Stanford University (California, USA) developed a persuasive technology theory, which was based on studies of digital technologies (such as computers) as persuasive technologies. This model describes the factors involved in behavioral change, claiming that such changes can be achieved through persuasion and social influence (not through coercion). The model is called the Fogg Behavior Model (FBM).
For the FBM, behavior is a function of three elements: motivations, barriers (or abilities) and triggers (Fogg, Reference Fogg2009). This model has already been used to understand weight loss apps (Azar et al., Reference Azar, Lesser, Laing, Stephens, Aurora, Burke and Palaniappan2013), to create a more effective weight loss app (Jia et al., Reference Jia, Yang, Zhou, Zhang, Lin, Chen, Cai, Yan and Ning2015) and to understand the decision making about volunteering (Cheek et al., Reference Cheek, Piercy and Grainer2015), generating positive findings. Considering the success of the use of the FBM in recent studies involving changes in human behavior, this paper argues that using this behavioral model, consulting companies could facilitate high impact milk quality control programs, because they will be targeting the determinants of farmers’ mastitis management behaviors. Milk quality control programs that are based on an understanding of behavioral drivers stand a good chance to realize changes in human behavior, particularly when combined with technical aspects. However, no studies have evaluated the model’s use in intervention programs in rural communities. Therefore, the goal of this study was to determine whether motivations and barriers can explain variations in the BTSCC.
Material and methods
The study was based on responses from surveys distributed to all dairy farmers belonging to the same cooperative in the state of Paraná, Brazil. In interview form, the same researcher presented the surveys to all participating farms, and the farmers completed the questionnaires with the interviewer’s assistance. From the population of 103 farmers, 88 agreed to participate in the study, 75 of whom completed the surveys and generated valid data for research. No incentives were given to the farmers to participate in the study and all of them participated in the same quality payment program that helped to eliminate financial incentive biases in the study.
Behavioral model
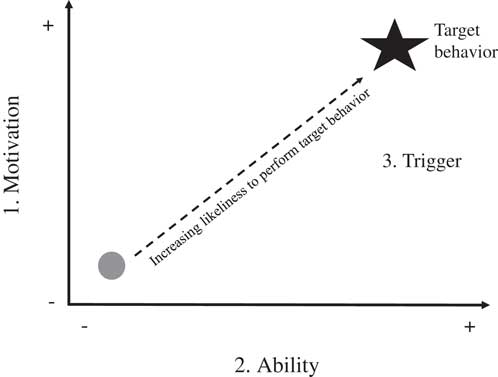
The behavioral model used was the FBM (Fogg, Reference Fogg2009). In this model, behavior is the product of three factors: motivations, barriers (or abilities) and triggers (Figure 1). For a certain behavior to happen, these three elements must be present at the same time. For instance, for a person to show any behavior, he/she must be sufficiently motivated; he/she must have the necessary skills to perform this behavior; and a triggering event must occur. If the behavior does not happen, at least one of these elements is missing (Fogg, Reference Fogg2009).
Graphical representation of the Fogg Behavior Model (adapted from Fogg, Reference Fogg2009)

Motivation reflects how much an individual wants to perform certain behaviors. Importantly, this factor depends on the characteristics of each individual; it is an intrinsic factor. The second element of the FBM is ability; for example, this element relates to whether the individual has the necessary resources to implement the desired behavior, such as time, money, knowledge, and the right physical and mental conditions. In this paper, the authors used the terms ‘barriers’ and ‘ability’ interchangeably because, when a barrier is high, it means there is lower ability to exhibit a particular behavior, and vice versa. A farmer’s ability was measured in two ways: through the difficulty that the farmer experienced in performing the behavior or through his/her perception of how high or low the barriers were to perform the behavior.
There are three psychological factors related to motivation: sensation (pain/pleasure), anticipation (fear/hope) and belonging (rejection/acceptance). Motivational barriers are money, time, physical/mental effort, knowledge, social deviance and non-routine activity. Persuasive knowledge theory defines three types of triggers: sparks, facilitators and signals. A trigger is something that informs or reminds a person to perform a desired behavior at a particular time (e.g. an alarm or a text message). A spark relates to motivating factors (i.e. an inspirational message or a cell phone notification about BTSCC results). A facilitator makes performing the behavior easier (i.e. a purchase with the click of a button). Finally, a signal, such as a stop sign, helps guide the behavior of an individual (already motivated and skilled) in a certain direction. (Fogg, Reference Fogg2009).
One example of the FBM in daily life is the cell phone. When a cell phone rings, the person can choose to answer or ignore the call. He/she will not answer if he/she is not motivated (he/she does not want to talk to whomever is calling), if he/she is unable to answer (he/she does not have time or is in a meeting), or if the phone does not ring (the trigger). Another example of the FBM can be found in the context of this study (the impact of human behavior on mastitis). The farmer must exhibit certain behaviors to control the disease: he/she has to be motivated (for example, by ‘pain’ when the dairy industry does not pay as much for milk from herds with a high BTSCC), has to have the particular abilities (to know how to control and prevent the disease) and has to experience a trigger (a cell phone notification of BTSCC results or a control chart showing that new cows have clinical mastitis).
Surveys
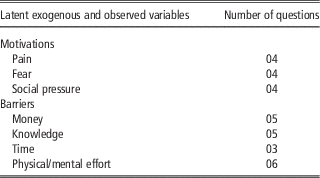
The surveys were developed by the authors and structured with Likert scale items; the respondents could choose between strongly disagree (1), slightly disagree (2), slightly agree (3) and strongly agree (4). A pre-test was conducted to validate the questionnaire, using a sample of 15 farmers (who were not included in the present study sample). The pre-test helped define which motivational factors and which types of barriers would be studied and develop the questionnaire sub-items. In addition, due to the difficulty in finding valid methods that could identify and measure the triggers, only two factors of the FBM were evaluated. The surveys evaluated fear, pain and social pressure as types of motivations and money, knowledge, time and physical/mental effort as types of barriers (Table 1; Supplementary Material S1). In interview form, the same researcher presented the surveys to all participating farms.
Fogg Behavior Model variables and the number of questions for each variable

For this study, latent variables were used. According to Bollen (Reference Bollen2002), latent variables are those that are not directly observable, for example, a person’s level of intelligence, quality of life, attitude, and opinions, as well as other variables that are measured through their manifestations. According to Curado et al. (Reference Curado, Teles and Marôco2014), these situations call for scales composed of qualitative variables that have an ordinal measurement format, such as a Likert scale.
There are two types of latent variables: exogenous and endogenous. Exogenous variables are synonymous with independent variables, and they can be influenced by factors outside the model. Endogenous variables are synonymous with dependent variables, which are directly or indirectly influenced by exogenous variables (Kenny, Reference Kenny2011). General information was also collected about the farms and producers, such as age, milk production, predominant breed, type of labor (family or hired), number of employees and the ratio of the income from milk to the total property income. In addition, producers were asked to report the BTSCC value from their most recent monthly milk analysis.
Data processing and statistical analysis
To describe the relationship among observed and latent variables, structural equation modeling (SEM) was used, enabling the evaluation of some subjective concepts and explaining the possible causal relationships among them (Bollen, Reference Bollen2002).
According to Bollen (Reference Bollen2002), SEM is based on two sets of equations. The first set of equations is used to evaluate the relationships among latent variables, and the second set is used to determine how the observed variables are related to the latent variables. The first set of equations is given by
 $$\eta i\,{\equals}\,{i}{\plus}\Gamma \xi \rm B\eta {\it i}{\plus}\zeta {\it i}$$
where ηi is the vector of the endogenous latent variables; B the matrix indicating the effects of ηj on ηi, where the features on the diagonal are equal to zero; ξi the vector of exogenous latent variables; Γ the matrix indicating the effects of ηi on ξi; and ζi the vector of errors for the equations.
The second set of equations is represented by
 $$yi\,{\equals}\,y\,\Lambda \,\eta i{\plus}{\epsilon}i$$
 $$xi\,{\equals}\,x\,\Lambda\, \xi i{\plus}\delta i$$
where x and y represent the observed variables; Λ the matrix indicating the relations among observed and latent variables; εi and δi represent the vectors of errors associated with each equation. Matrices of variance and covariance for ξi, ζi, εi and δi are represented by Φ, Ψ, Θ ε and Θ δ, respectively.
The variables x and y are assumed to have multivariate normal distributions with mean 0, and covariance matrix Σ is given by
 $$\Sigma \left( \Theta \right)\,{\equals}\,\Sigma \Sigma \,xx\,xy\,\Sigma \Sigma \,yxyy$$
where Σ xx=Var (xΛξ+δ)
 $$\eqalignno{ \Lambda x\,{\equals}\, & x{\plus}\Phi \,\Lambda \,\Theta \,\delta \,\Sigma yy{\equals}{\rm Var}\left( {y\,\Lambda\, \eta {\plus}{\epsilon}} \right)\,\cr\Lambda y\,{\equals}\,&\left( {\rm I\,{\minus}\,B} \right)\,{\minus}\,1{\rm }\left[ {\Gamma \Phi \Gamma {\plus}\Psi } \right]\left( {\rm I\,{\minus}\,B} \right)\,{\minus}\,1\,\Lambda\, y\,\Theta \,{\epsilon} \cr {\rm Cov}\left( {\eta ,\xi } \right)\,{\equals}\,&{\rm Cov}\left( {\left( {\rm I\,{\minus}\,B} \right)\,{\minus}\,1\left( {\Gamma \xi {\plus}\zeta } \right),\xi } \right)\,{\equals}\,\left( {\rm I\,{\minus}\,B} \right)\,{\minus}\,1\Gamma \Phi \cr \Sigma xy\,{\equals}\,&\Sigma \lsquo \,{\prime}yx\,{\equals}\,{\rm Cov}\left( {X,Y} \right)\,{\equals}{\rm \,Cov}\left( {\left( {y\,\Lambda\, \eta {\plus}{\epsilon}} \right),\left( {\Lambda x\xi {\plus}\delta } \right)} \right) \cr \Lambda y\,{\equals}\,&\left( {\rm I\,{\minus}\,B} \right)\,{\minus}\,1\Gamma \Phi \Lambda x.\Lambda y\left( {\rm I\,{\minus}\,B} \right)\,{\minus}\,1x\Gamma \Phi \Lambda $$
The parameter estimation process involves solving S=Σ (Θ), where S represents the empirical variance-covariance matrix, and the difference between the two matrices is called the discrepancy function. To minimize this function, a method based on the likelihood ratio is used. The total likelihood function for Θ is given as follows:
 $${\rm FML}\,{\equals}\,{\rm log}\left| {\Sigma \left( \Theta \right)} \right|{\plus}Tr\left( {S\Sigma \,{\minus}\,1\left( \Theta \right)} \right)\,\,{\minus}\,\,{\rm log}\left| {S} \right|\,\,{\minus}\,\,\left( {P{\plus}q} \right)$$
where P and q are parameters related to each covariance matrix. To address these parameters, we used the software R (R Core Team, 2015) through the lavaan library.
Model selection
This section presents three different methods for evaluating and verifying which model is considered the best to describe the data set. The Comparative Fit Index (CFI), the Tucker-Lewis Index (TLI) and the root mean square error of approximation (RMSEA), methods suggested by Bollen (Reference Bollen1989) and Kline (Reference Kline2011), were used. The RMSEA was used because it is considered one of the most informative structural models; however, this method is sensitive to the number of parameters. To compare the models, the CFI was used to consider the discrepancy between the proposed models (the basic model and the saturated model), and the TLI, also known as the non-normed fit index, was used to consider the relations between the χ 2 and the degrees of freedom for both models, as well as the proposed base model. The three models were used together to avoid problems related to the number of parameters and the sample size, which can occur in any model (Hair et al., Reference Hair, Black, Babin, Anderson and Tatham2005). For the first two methods used in the evaluation of the models (CFI and TLI), values close to one indicated the best designs; for RMSEA, values <0.05 were considered the best models (Hair et al., Reference Hair, Black, Babin, Anderson and Tatham2005). All computational procedures were performed using the packages available in the software R (R Core Team, 2015): lavaan, semPlot and semTools.
Results
The farmers’ ages fell into three categories: (1) younger than 25 years old, (2) between 25 and 50 years old, and (3) older than 50 years old. None of the farmers interviewed was younger than 25 years old; 55% were between 25 and 50 years old; and 45% were older than 50 years old. On average, the milk production on the properties of the farmers interviewed was 1523 l/day±2179; milk represented 86%±26 of the total income; and the predominant breeds were Holstein and Jersey. Overall, 66% of the properties had hired labor, and the number of employees was 2.19±2.88, on average. The self-reported BTSCC was 426 000 cells/ml±288 000.
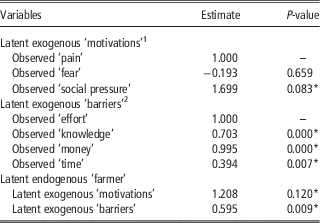
Of all the structural models tested, the selected one, which is based on CFI (1.000), TLI (1.034) and RMSEA (0.000), indicated that farmers’ behaviors, which are elucidated by their motivations and barriers/abilities (Table 2), can partly explain the variation in the BTSCC. The relationship between the latent variables and the indicators used to measure them is reflexive; in other words, the latent variables are measured using reflexive indicators. According to Diamantopoulos and Siguaw (Reference Diamantopoulos and Siguaw2006), in this type of model, changes in the latent variables are reflected (manifested) in changes in the observable indicators. When evaluating the exogenous latent variables, farmers’ motivations were shown to be explained by pain and social pressure, both having positive associations. Social pressure was the factor that best explained the exogenous latent variable because its estimated value was ~70% higher compared with that of the pain variable. For the causal relationship to be considered significant, it should have significance levels of <15%. The significance value chosen was justified because this behavioral study had subjective variables (that cannot be directly measured), thereby justifying the use of a higher level of significance. In addition, the use of higher P values is adequate for small samples because of the probabilities of both type I and type II errors. In addition, to increase the statistical power analysis with small samples, a less severe α is necessary (Filho et al., Reference Filho, Paranhos, Rocha, Batista, Silva Junior, Santos and Marino2013; Demidenko, Reference Demidenko2016).
The relationship between the observed variables and the latent exogenous variables (motivations and barriers) and the list of exogenous variables with the endogenous variable (farmer)

1 Cronbach’s α for motivations=0.67
2 Cronbach’s α for barriers=0.80
*P<0.15
The other latent exogenous variables, barriers/abilities, were observed to be potentially explained by all the observed variables (money, knowledge, physical/mental effort and time), all having positive associations. However, money and effort were the most important variables, given the estimated results of 0.955 and 1.000, respectively. In addition, the time variable was observed to have the lowest association with barriers, and ~40% of the values compared with physical/mental effort.
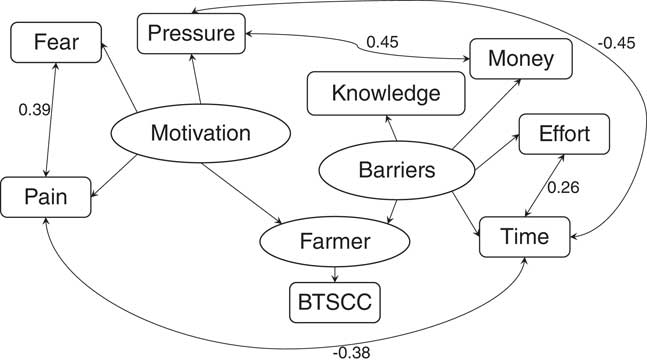
The structural model identified positive correlations between the following variables: pain and fear; physical/mental effort and time; and social pressure and money. In addition, negative correlations were found between pain and time and between social pressure and time (Figure 2). These correlations could also be influenced by a third factor that was not detected in this survey, which could be the triggers that were not measured in this study.
Graphical representation of the structural equation model. Boxes with rounded edges represent observed variables; oval boxes represent endogenous and exogenous latent variables; bidirectional arrows represent the correlations between variables; and unidirectional arrows represent causal effects. BTSCC=bulk tank somatic cell count.

Discussion
According to Valeeva et al. (Reference Valeeva, Lam and Hogeveen2007), farmers are motivated by several factors, not simply monetary and financial factors. Implementing mastitis control practices primarily depends on internal factors related to the farm and farmer, such as his/her mentality.
Moreover, due to its multifactorial risks, mastitis is not an easily controlled and prevented disease. Therefore, disease control requires effective and lasting changes in herd management practices, that is, behavioral changes in the farmers and their employees (Barkema et al., Reference Barkema, Van der Ploeg, Schukken, TJGM, Benedictus and Brand1999). However, to truly realize behavioral change, motivation and perceived barriers must be considered because the simultaneous engagement with these two factors can help individuals reach their ultimate goal (Jansen et al., Reference Jansen, van Schaik, Renes and Lam2010).
This study aimed to determine whether motivations and barriers can explain variations in the BTSCC. The results indicated that the observed variables of pain and social pressure best explained the variable of motivation. Pain related to how much the farmer felt he/she would be penalized based on milk quality (financial losses, i.e., reduced milk prices) and how much he/she depended on milk production (his/her income from dairy production). These results confirmed the hypothesis that a farmer would be more motivated by financial penalties than by bonuses (Valeeva et al., Reference Valeeva, Lam and Hogeveen2007). Social pressure related to the pressure imposed by the government (normative instructions), industry (imposed limits) and neighbors (knowledge of the farms with the highest-quality milk in the region).
The results also indicated that fear had no significant effect on motivation. This variable related to farmers’ fears that their milk would be rejected by the industry due to its poor quality and/or their inability to control mastitis on the farm. The study in question was conducted in a region where the quality payment program had already been established for over 20 years; thus, the farmers may have no longer feared that they would violate the limits imposed by the industry, thereby explaining the finding above.
The causal relationship between motivation and the BTSCC was positive; in other words, the more the farmer was motivated by pain and social pressure, the higher the BTSCC was. More motivation was expected to lead to lower BTSCC values; however, the practices used to motivate farmers are widely used, and motivations can vary across individuals (Valeeva et al., Reference Valeeva, Lam and Hogeveen2007). Moreover, according to the FBM model, even if an individual was highly motivated, if there was insufficient skill or no trigger, they would not behave the way that was anticipated; in other words, even motivated farmers could have a high BTSCC if they lacked other factors.
Other studies also sought to observe the relationship between farmer behaviors and the reduction of mastitis. For example, Van der Borne et al. (Reference Van der Borne, Jansen, Lam and Van Schaik2014) evaluated the association between low clinical mastitis rates in different herds in the Netherlands and the farmer’s attitude, knowledge and behavior. The authors expected that a change in the farmer’s attitude and knowledge would result in a change in the self-reported behaviors associated with mastitis (i.e. the use of gloves during milking); however, such a change was not observed. The authors concluded that although behavioral changes were not observed, the product or outcome of this behavior improved (i.e. post-milking disinfection began to occur more appropriately).
All the types of barriers studied – money, knowledge, physical/mental efforts and time—may explain the BTSCC. Therefore, the farmer clearly faces several types of barriers or difficulties, all of which have an influence on milk quality. A study conducted in England showed that farmers who had problems such as laminitis in their herds and faced barriers such as a lack of time, a lack of resources (to cover the high costs of control and prevention) and a lack of knowledge were unable to control the disease (Leach et al., Reference Leach, Whay, Maggs, Barker, Paul, Bell and Main2010). Therefore, farmers who face many barriers may not be able (or feel able) to perform all the tasks required to control mastitis.
The relationship between barriers and the BTSCC was also positive; therefore, the more barriers the farmers encountered, the greater the BTSCC. This result confirmed the hypothesis that consultants must work to reduce barriers to facilitate milk production and to guarantee the improvement of milk quality. In other words, farmers with a high BTSCC may be highly motivated but lack skills and triggers.
The structural model identified positive and negative correlations between variables; these correlations did not indicate causal effects, and they may have been influenced by external factors that were not studied in this research. For example, physical/mental efforts were found to have a positive correlation with time; however, this correlation may have depended on a third factor that was not detected in this search. This correlation revealed that farmers who faced many barriers due to physical/mental efforts may also have faced difficulties related to a lack of time. This interpretation was similar to the correlations between pain and fear, social pressure and money.
From the results of this study, one can improve BTSCC reduction programs in a specific context in the real world, which could result in more significant outcomes compared with those of traditional programs. Clearly, professionals working with milk quality should also focus on reducing barriers and creating facilitator triggers. Farmers’ motivations should also be emphasized, even though the farmers in this study with a high BTSCC were already motivated (by external or internal factors).
Limitations
Despite the potentially significant conclusions drawn from this study, there were also some limitations related to the method used. Because the study was conducted in an isolated region, the results may not be applicable to other areas. Moreover, as the participation in the survey was voluntary, the farmers’ behaviors may be biased, and the findings cannot be generalized.
Another limitation was the data collection method. Given the short time and the large number of farms to be visited, we used self-reported data on farmers’ behaviors, which may not have reflected reality because self-reported behavior is not always valid. Response accuracy was also another limitation because it depended on the interest and attention of the respondents during the survey. Therefore, updating the survey with validation questions is necessary before it can be used in further research.
Another major limitation of this study was that it only evaluated two factors in the FBM (motivations and barriers), and the third factor (trigger) was not considered. We chose to evaluate only motivations and barriers because finding methods to identify triggers was very difficult. In future research, the third element of the FBM should be considered because, according to Fogg (Reference Fogg2009), it plays an important role in behavioral changes.
We can conclude that the elements of the FBM (the farmer’s motivations and perceived barriers) partly explain the variation in the BTSCC. These results may significantly improve the success of milk quality programs. Farmers who were highly motivated showed a higher BTSCC, even if they faced major barriers. This finding clearly indicates that to ensure better milk quality from these farms, consultants should focus on the human factor to reduce perceived barriers when implementing new practices in the farm routine.
Acknowledgments
The authors would like to thank the cooperative, partner of this study. This work is part of a master’s dissertation in Animal Science, therefore, the authors thank the Coordenação de Aperfeiçoamento de Pessoal de Nível Superior (CAPES) for the scholarship provided to the first author.
Supplementary material
To view supplementary material for this article, please visit https://doi.org/10.1017/S1751731117001756