
I. INTRODUCTION
Solid-state gas sensors, especially those which are based on metal oxide semiconductors, have been widely used in many applications such as environmental pollution removal, health care, defense, domestic security and safety, food industry, and medical.Reference Wetchakun, Samerjai, Tamaekong, Liewhiran, Siriwong, Kruefu, Wisitsoraat, Tuantranont and Phanichphant1–Reference Chen, Liu and Huang6 This is due to their low cost, ease of synthesis, simple crystal structure, small physical size, prominent stability, high sensitivity, and rapid response.Reference Ponzoni, Comini, Concina, Ferroni, Falasconi, Gobbi, Sberveglieri and Sberveglieri7 Different types of metal oxide materials have been investigated for gas sensing applications, such as Nb2O5,Reference Rani, Zoolfakar, Ou, Field, Austin and Kalantar-zadeh8 ZnO,Reference Jia, Ji, Zhang, Chen, Sun and Jin9–Reference Bhatia, Verma and Bedi11 WO3,Reference Han, Chen, Zhang, Liu, Zhang and Cao12,Reference Wang, Sun, Li, Sun, Sun, Liu and Lu13 TiO2,Reference Yang, Liang, Wang, Liu, Yuan, Yu, Li, Zeng and Gu14,Reference Boyadjiev, Kéri, Bárdos, Firkala, Gáber, Nagy, Baji, Takács and Szilágyi15 In2O3,Reference Wei, Huang, Wang, Chuai, Zhang and Lu16,Reference Xu, Zhao, Wang, Sun, You, Sun, Liang, Liu, Chen and Lu17 Fe2O3,Reference Sun, Wang, Zhou, Cheng, Shimanoe, Lu and Yamazoe18 and SnO2.Reference Liu, Jiao, Zhang, Qu, Umar and Wu19 Among these metal oxides, tin oxide is a very important n-type oxide semiconductor with a wide direct band gap (E g = 3.6 eV), high conductivity, tunable morphology and crystallinity, and chemical stability, which offers varied technological applications, such as lithium battery,Reference Gurunathan, Ette and Ramesha20 optic-electronic device,Reference Jia, Wang, Wang, Dong, Liao and Wang21–Reference Deng, Lu, Shi, Liu and Li23 dye-sensitized solar cell,Reference Niu, Zhang, Wang, Guo, Shang, Gan, Qin, Wan and Xu24 catalyst,Reference Zhang and Hu25 and gas sensor.Reference Shanmugasundaram, Basak, Satyanarayana and Manorama26–Reference Wang, Ma, Cheng, Xu, Luo, Jiang, Li, Jin and Sun28 Because of its excellent performance and practical application, various routes have been used to obtain SnO2 crystals and nanoarchitectures, including hydrothermal technique,Reference Wei, Xue, Xie and Zou29 sol–gel method,Reference Yanhua, Lingling, Guifang, Yifeng, Xiang and Weiqing30 and chemical vapor deposition.Reference Jeong, Choi, Chang, Shin, Park, Lee, Park and Song22,Reference Bae, Park, Kim, Kim and Park31 Hydrothermal synthesis, which required high temperature as well as pressure, has been most widely used, as the result of its convenient manipulation and flexibility in controlling the size and morphology of the resulting (nano)structures.Reference Shi, Song and Zhang32
One of the most important applications of the SnO2 material is gas sensors which have been proved to be excellent in gas sensing properties toward ethanol detection.Reference Liu, Jiao, Zhang, Qu, Umar and Wu19 It is well-known that high response and superior selectivity are important parameters in designing semiconductor gas sensors. Therefore, increasing the response and improving the selectivity of oxide semiconductor gas sensors are major scientific challenges for developing new sensing strategies. As many groups have reported before, the morphology plays an important role in determining properties of materials.Reference Xia, Tu, Zhang, Wang, Zhang and Huang33–Reference Zhong, Qiu, Zhang, Li, Zhang and Chen36 To enhance the performances of SnO2-based devices, various morphologies of SnO2 with different dimensional nanostructures have been synthesized, such as nanoparticles,Reference Leite, Weber, Longo and Varela37 nanowire,Reference Kolmakov, Zhang, Cheng and Moskovits38 nanobelts,Reference Comini, Faglia, Sberveglieri, Pan and Wang39 hollow-sphere,Reference Yang, Liang, Wang, Liu, Yuan, Yu, Li, Zeng and Gu14,Reference Gurunathan, Ette and Ramesha20 flower-like,Reference Wang, Zhang, Wu, Wang, Song and Wang40 and many other hierarchically complex micro/nanostructures.Reference Wei, Xue, Xie and Zou29,Reference Wang and Rogach41 Specially, hierarchical nanostructures using lower dimension nanocrystals as the building blocks attract more interests due to their shorter gas diffusion length, higher mobility, and relatively larger specific surface area compared with agglomerated nanoparticles.Reference Lee42–Reference Fu, Zhu, Jiang, Cheng, You and Yu45 Therefore, self-assembling the 1D/2D SnO2 nanostructure and attaching them into a well-defined 3D nanostructure is an imperative and challenging mission for the gas-sensing applications.
In this paper, we report a successful synthesis of aloe-like hierarchical SnO2 assembled by squamous nanosheets via a one-step, template-free, hydrothermal approach. Interestingly, the sample exhibited a narrower band gap and an excellent performance on detecting ethanol, which may be attributed to the hierarchical structures that enhanced effective gas diffusion to the entire sensing surfaces.
II. EXPERIMENTAL SECTION
A. Sample preparation
In a typical preparation, 0.09 g sodium dodecyl sulfate and 10 mL Stannous chloride dihydrate (SnCl2·2H2O, 0.2 M) solution were mixed by a magnetic stirrer for 30 min. After adjusting the pH to 10, 10 mL acquired solution was transferred to a 50 mL Teflon-lined stainless autoclave, which was subsequently put into the electric oven and maintained at the temperature of 160 °C for 24 h. Finally, the yellow precipitation was collected and washed with deionized water and ethanol for several times and dried at 60 °C for 12 h.
B. Material characterization
The phase and crystal structures of the product were characterized by powder X-ray diffraction (XRD; Rigaku D/MAX-2500, Rigaku, Tokyo, Japan) with Cu Kα radiation (λ = 0.15406 nm) and Raman spectra (Horiba Jobin Yvion HR 800 Raman spectrometer, Horiba Yvon, Paris, France) with an Nd:YAG laser at a wave length of 532 nm. The elemental compositions of the samples were detected by the energy-dispersive X-ray spectrometry (EDS) equipped on the ZEISS SUPRA 55 (Zeiss, Oberkochen, Germany). The surface composition of the as-synthesized SnO2 was analyzed by using an X-ray photoelectron spectroscope (XPS; PHI Quantera II, Yulvac-PHI, Chigasaki, Japan) equipped with a standard monochromatic Al Kα source. The sample morphology was explored by field emission scanning electron microscopy (FESEM; ZEISS SUPRA 55, Zeiss, Oberkochen, Germany) and further transmission electron microscopy (TEM; JEOL JEM-2200fs, JEOL, Tokyo, Japan) and high resolution TEM (HRTEM; JEOL JEM-2200fs, JEOL, Tokyo, Japan) microscopy. The pore textural properties including the Brunauer–Emmett–Teller (BET) specific surface area, pore volume, and pore size distribution were obtained from the nitrogen sorption isotherms by the ASAP 2020 built-in software (Micromeritics, Norcross, Georgia). UV-Vis diffuse reflectance spectra were recorded with an UV-Vis spectrophotometer (Lambda 950, PerkinElmer, Shelton, Washington) equipped with an integrating sphere. Finally, the gas sensing properties of the materials were tested using a CGS-1TP (Chemical Gas Sensor-1 Temperature Pressure) intelligent gas sensing analysis system.
C. Gas sensing measurements
The gas sensing behavior of the samples was tested on a heating ceramic plate of the CGS-1TP instrument by pressing the sample firmly with two probes. The products were first mixed with a small amount of deionized water to form homogeneous suspensions, which were then drip-dropped on commercial ceramic substrates with patterned gold electrodes. The as-prepared samples were then aged at 55 °C during the process of drip-dropping in air. The gas sensing properties were characterized at different operating temperatures with a fixed working voltage of 9 V. The operating temperature can be adjusted from room temperature to 400 °C with a rate of 3–5 °C/s by an external controller under the heating ceramic plate. The sensor was preheated for about 30 min at a certain target temperature until the resistance of the sensor reached a stable range, and then sealed in an 18 L test chamber. The target gas was injected into the test chamber through the injection pore. During the measurements, the fans were turned to facilitate the mixing of gas until the resistance of sensor reached a stable range. After each gas sensing test, the sensor was exposed to fresh air. Gas sensing tests were repeated several times to find the optimum work conditions.
The response of the sensor is defined as S = R g/R a for oxidizing gas or R a/R g for reducing gas. Here, R a and R g are the resistances of the sensor in air and target gas, respectively. The response time and recovery time are defined as the time taken by the sensor to achieve 90% of the total resistance change during the adsorption and desorption process, respectively.
III. RESULTS AND DISCUSSION
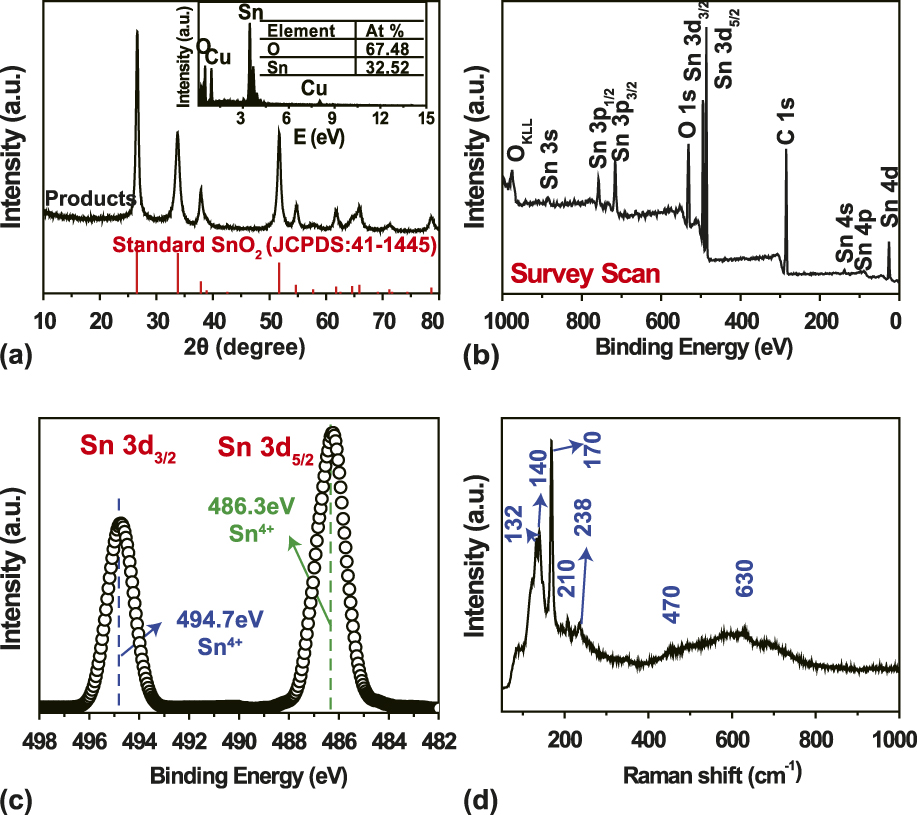
The structure of the as-prepared sample was characterized by powder XRD and EDS as shown in Fig. 1(a). The XRD patterns revealed that the synthesized sample was a rutile SnO2 (JCPDS file No. 41-1445, p42/mnm, a = b = 4.738 Å, c = 3.187 Å, α = β = γ = 90°). The lattice parameters of the sample calculated according to the equation 1/d 2 = h 2/a 2 + k 2/a 2 + l 2/c 2 by using the crystal planes of (110) and (002) were a = 4.747 Å and c = 3.206 Å, which were consistent with the standard values (JCPDS file No. 41-1455). No peaks of other impurities were detected from XRD patterns. The EDS spectrum [insert in Fig. 2(a)] revealed that the product was exclusively composed of tin and oxygen (the Cu signal comes from the Cu support substrate), and the Sn/O ratio was 1:2, which further confirmed that the synthesized sample is tin dioxide.
(a) XRD pattern and EDS (the insert) of the as-prepared product; (b) XPS survey spectrum of the as-prepared SnO2 sample; (c) High-resolution Sn 3d XPS spectrum of the SnO2 sample; (d) Raman spectra of the as-prepared SnO2.

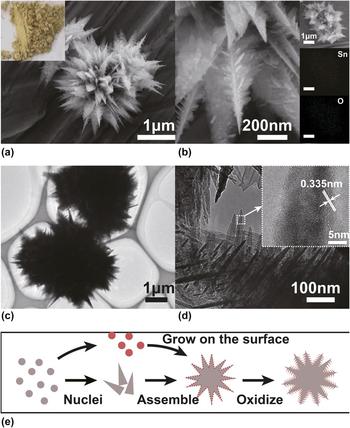
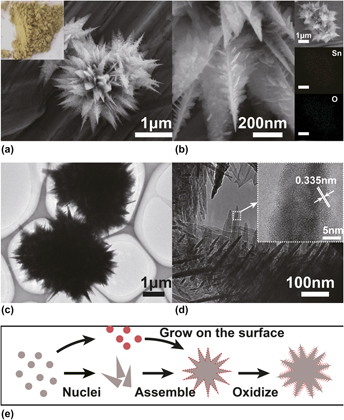
Morphology information: (a and b) FESEM images of the prepared samples, the insert picture in (a) is the photo of acquired powder, and the insert in (b) is the EDS elemental mapping images; (c and d) TEM images of SnO2 nanopetal, and the insert picture in (d) is the HRTEM image of a single nanoplate; (e) Growth mechanism (the blue and the red are SnO and SnO2, respectively).

To illustrate the composition and chemical states of both elements in the samples, the XPS spectra were carried out, and presented in Fig. 1(b). Sn and O were found to be the predominant elements in the sample. No other elements except carbon, due to contamination, were observed. The binding energy for the C 1s peak at 284.6 eV was used as a reference for energy calibration. As shown in Fig. 1(c), the Sn 3d spectrum of the SnO2 samples comprised two symmetrical doublet peaks at 486.3 and 494.7 eV with a spin–orbit splitting of 8.4 eV, corresponding to Sn 3d 5/2 and 3d 3/2, respectively.Reference Stranick and Moskwa46 These results agreed well with the previous reports, suggesting the presence of Sn in an oxidation state of +4,Reference Stranick and Moskwa46 which corroborated the results of XRD and EDS further.
Raman spectroscopy is one of the most powerful techniques to analyze crystal structure, crystal phase, and especially the defects related to the oxygen vacancies of nanostructured materials. Figure 1(d) shows the room temperature Raman spectrum of the as-prepared SnO2 samples. The peaks positioned at the 132, 140, 170, and 238 cm−1 can be assigned to the transition mixed oxide states of Sn3O4, coinciding with the previous reports.Reference He, Li, Chen, Shao, Xian, Zheng and Wang47,Reference Wang, Zhou, Zhou, Sham and Ding48 The peak at 210 cm−1 can be assigned to the SnO active mode, A1g,Reference Geurts, Rau, Richter and Schmitte49 and the peaks observed at 470 and 630 cm−1 can be assigned to the fundamental Raman active vibrational modes, Eg and A1g of SnO2,Reference Scott50 respectively. The peak positioned at 470 cm−1 (Eg), corresponds to the vibration of the oxygen atom in the oxygen plane. The peak positioned at 630 cm−1 (A1g) attributes to the expansion and contraction of the Sn–O stretching vibrational mode.Reference Yu, Xiong, Liu and Xiong51–Reference Katiyar, Dawson, Hargreave and Wilkinson53
In Ref. Reference Oba, Choi, Togo, Seko and Tanaka54, it has been pointed out that the introduction of the O interstitial into SnO can lead to SnO2. Alternatively, the introduction of the O vacancy into SnO2 can in return result in SnO. This implies that the structures of Sn–O intermediate compounds between SnO and SnO2 are well modeled in terms of the configurations of the O atom and vacancy in an O sublattice nearly common to SnO and SnO2. Based on this, although the results of XRD and XPS did not show obvious signs of SnO and Sn3O4, typical models of SnO (210 cm−1) and Sn3O4 (170 and 238 cm−1) appeared in the Raman spectra, which means that Sn–O tetrahedron, a structure that is similar to SnO and Sn3O4, is formed in the sample due to large quantities of oxygen vacancies as proved by the Raman spectra.Reference Fengping, Xingtai, Jigang, Tsun-Kong and Zhifeng55
The morphology of the sample was characterized by FESEM and TEM shown in Figs. 2(a)–2(d). The FESEM image at low magnification [Fig. 2(a)] indicates a representative overview of the 3D aloe-like architecture. The observed sample was self-assembled by a sharp-edged 2D-triangle plate. Close examination by the high magnification SEM images in Fig. 2(b) revealed that the surface of the ultrathin nanopetal was rough and covered by plentiful miniscule flakes. The EDS elemental mapping images [insert in Fig. 2(b)] further evidenced the composition of the product and the spatial distribution of the elements. Evidently, Sn and O signals were detected as a flower-like microspheres structure.
The TEM images Figs. 2(c) and 2(d) further confirmed that the petals in the length of 1–2 µm with rough surfaces were multilayer, composed of many nanosheets. As a result, plentiful surface states and defects, as well as enormous amounts of mesopores gave rise to a high surface area and a high pore volume ratio in the hierarchical, aloe-like architecture. Further structural analysis of the SnO2 nanoslices was investigated by HRTEM. From HRTEM, the measured fringe spacing of the nanosheets was 0.335 nm which was consistent with the d-value of 0.3347 nm for the (110) crystal graphic planes of rutile SnO2 (JCPDS #41-1445).
Based on the characterization, we proposed a possible growth mechanism of the SnO2 architectures shown in Fig. 2(e). In the beginning, nuclei formed triangle SnO nanosheets and meanwhile, parts of the Sn(II) ions were oxidized to high water-soluble Sn(IV) ions. Then, those soluble Sn(IV) ions started to assemble tiny tin dioxide nanoflakes on the surfaces of the SnO sheets. Ultimately all the aloe-like intermediate products mixed with SnO and SnO2 were future oxidized to aloe-like tin dioxide.
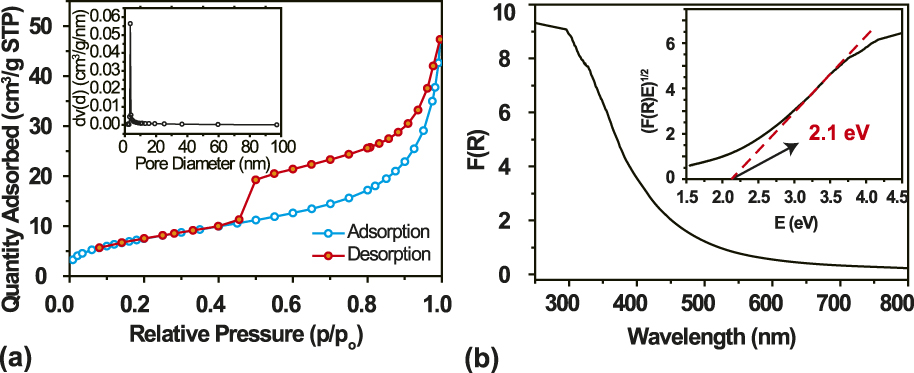
To quantitatively determine the specific surface areas and pore volumes of the SnO2 sample, multipoint BET surface area and pore volume measurements were carried out based on the nitrogen adsorption–desorption isotherms. The N2 physisorption isotherms of the sample and its corresponding Barrett–Joyner–Halenda (BJH) pore size distribution curves are shown in Fig. 3(a). One can see that the SnO2 product exhibits an isotherm feature of the H3 type according to IUPAC (the International Union of Pure and Applied Chemistry) classification.Reference Sing56 Based on the measurements, the BET surface area of the aloe-like SnO2 is 41.8 m2/g, which is larger than that of flower-like SnO2 reported in the literature (37.4, 33.7, 25.6, and 26.5 m2/g for the four different samples).Reference Wu, Chen, Lou and Hng57 As described above, the large surface area of the pure SnO2 nanocrystals could be attributed to the small particle size and the porous structure which can be seen in the TEM characterization. On the basis of the BJH model and the desorption data, the average pore radii dV(d) of the SnO2 was calculated to be 3.5 nm, as shown in the inset of Fig. 3(a).
(a) N2 adsorption–desorption isotherms of the SnO2 nanostructure. The insert is the corresponding pore size distribution. (b) UV-Visible diffuse reflectance spectra and plots of (F(R)E)1/2 versus photo energy (right insert) of the SnO2 nanostructure.
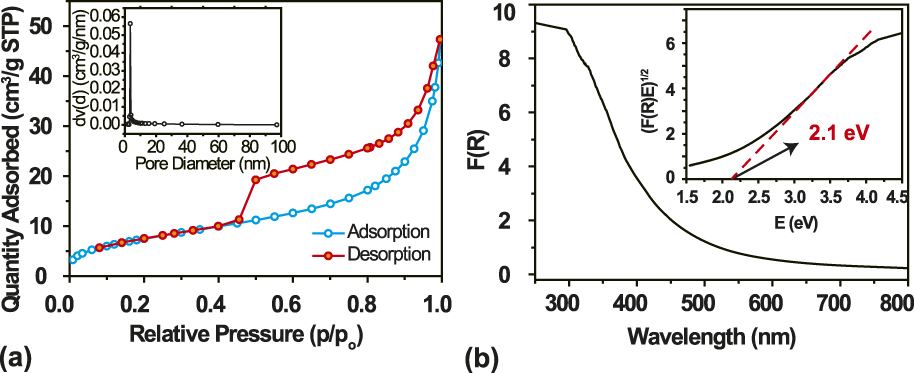
The optical band gap of the SnO2 sample was acquired by the UV-Vis absorption spectra ranging from 250 to 800 nm [Fig. 3(b)]. The optical band gap calculated from the Tauc model or Tauc relation was deduced by extrapolating the linear part to hν axis in a = 0, which is 2.1 eV, much smaller than that of the pure sample (3.6 V), which can be attributed to large defects in the structure.Reference Kamble and Umarji58
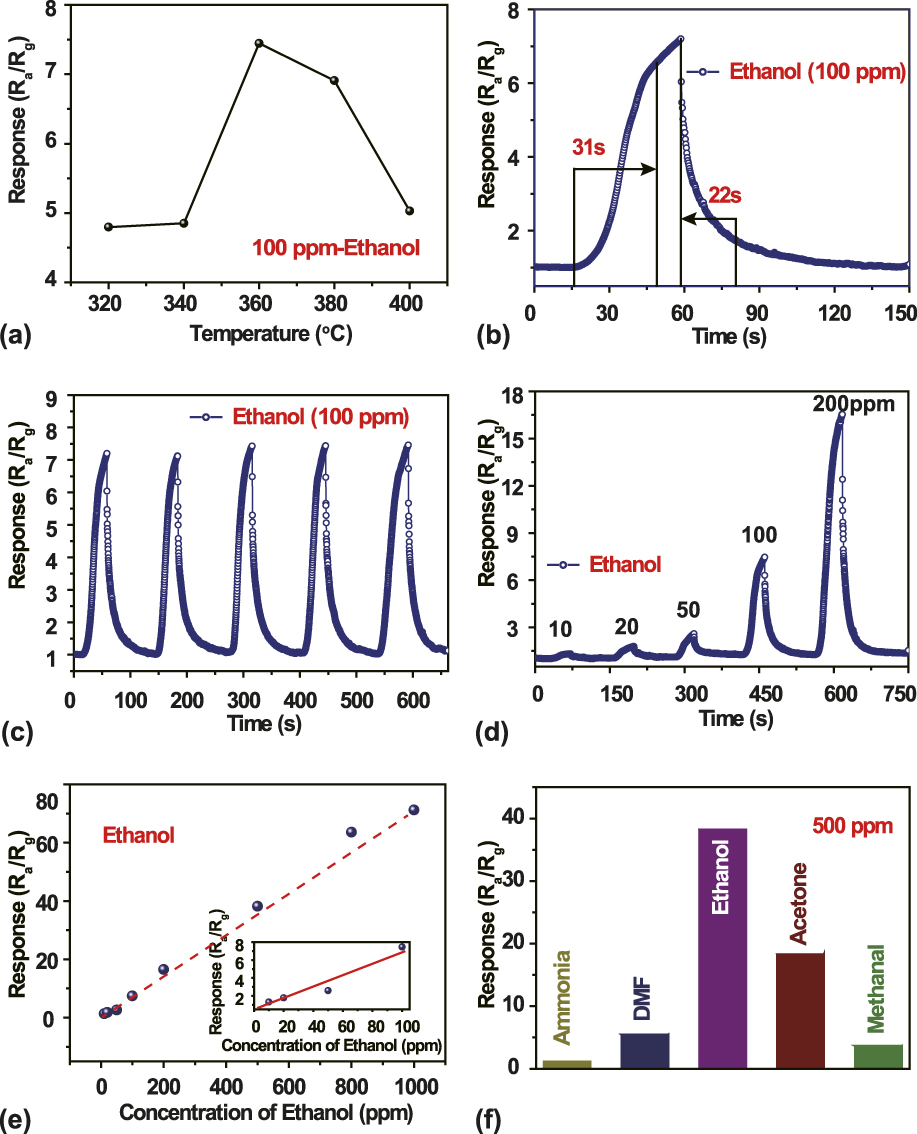
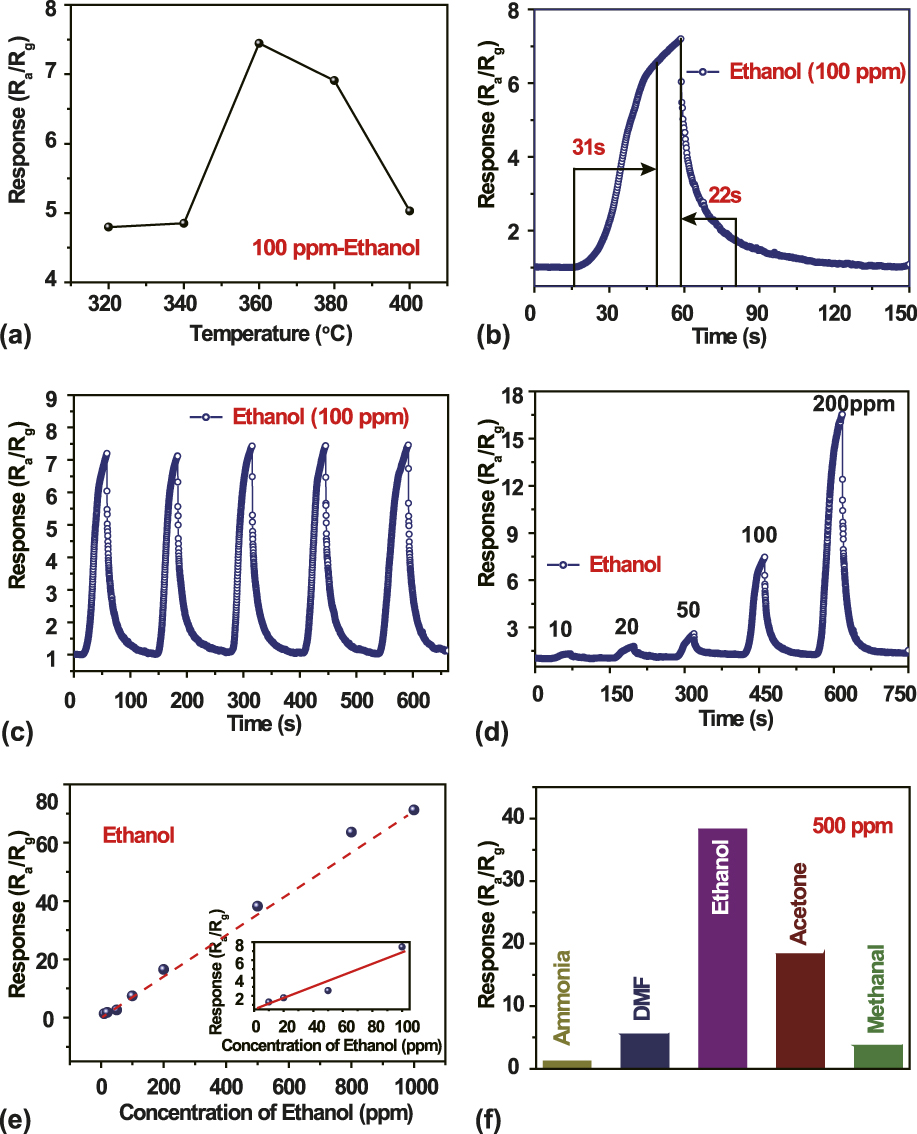
To explore the gas sensing property, a sensor based on the aloe-like SnO2 nanostructures was fabricated. The operating temperature has a great influence on the response of a gas sensor based on oxide semiconductor materials.Reference Cao and Stetter59 To optimize the working temperature for the sensor, the responses of the sensor are measured at different temperatures ranging from 320 to 400 toward 100 ppm ethanol, as shown in Fig. 4(a). From 320 to 400 °C, the response increases with the increase of operating temperature and reaches the maximum value of 7.46 at 360 °C. When the temperature further increases, the response decayed gradually, and it is only about 5.0 at 400 °C, confirming that the response is greatly influenced by working temperature. The deterioration of the sensor performance at high temperature could be explained as follows. On the one hand, under such high temperature, larger amounts of oxygen molecules dissociate and are adsorbed on the active sites, decreasing the free active sites of ethanol. On the other hand, the rate of adsorption is lower than desorption at such high temperature.Reference An, Jimmy, Wang, Hu, Yu and Zhang60,Reference Lee and Reedy61 Therefore, 360 °C was chosen for the optimum working temperature, which was applied in all the investigations hereinafter. An individual resistance transient in the presence of 100 ppm of ethanol at 360 °C is shown in Fig. 4(b). As observed, in the initial stage, upon the introduction of ethanol, the resistance increased rapidly, and then, tended to be stable gradually. Subsequently, the electrical property decreased sharply as the sensor transferred to the air chamber and recovered to R a, finally. As we can see that at the optimum operating temperature, the response time and recovery time are 31 s and 22 s, respectively. Figure 4(c) illustrates four reversible response cycles of the aloe-like SnO2 to 100 ppm ethanol. The sensitivity does not exhibit an obvious change, indicating the excellent stability and reproducibility of the aloe-like SnO2-based gas sensors. Figure 4(d) shows the transient responses of the sensor to different ethanol concentrations at 360 °C. Five cycles were successively recorded, corresponding to five different ethanol concentrations: 10, 20, 50, 100, and 200 ppm. The curves indicate that soon after the injection of ethanol gas, the conductance of the sensor increased drastically and then decreased to its initial state after the sensor was exposed to air. With the increase of the ethanol gas concentration, the response increased accordingly. The sensitivities of the sensor to 10 and 100 ppm ethanol were approximately 1.32 and 7.46, respectively. The sensor based on the as-prepared aloe-like SnO2 has a high response to ethanol, compared to the performances of similar sensors from the literature studies listed in Table I.
(a) Response of the sensor to 100 ppm ethanol as a function of operating temperature, (b) an individual response transient to 100 ppm of ethanol, (c) dynamic response of the SnO2 sensors to 100 ppm ethanol at 360 °C, (d) response transients of the sensor to different ethanol concentrations at 360 °C, (e) gas response of the sensor as a function of ethanol concentrations, and (f) comparison of responses of the sensor based on SnO2 to various gases at 360 °C.
Gas responses to ethanol in the present study and those reported in the literature studies.Reference Xu, Zhuang and Wang63–Reference Liu, Zhang, Guo, Wang and Wu66

To investigate the selectivity of the aloe-like SnO2, other gases such as ammonia, ′N,N-dimethylformamide (DMF), acetone, and methanol were also tested. All the gases were of the same concentration (500 ppm) and tested at the optimum working temperature, as shown in Fig. 4(f). The aloe-like SnO2 hierarchical structures exhibit the highest sensitivity to ethanol (38.21), higher than that of acetone (18.28) and much higher than that of DMF (5.46), methanol (3.65), and ammonia (1.15), implying that the aloe-like SnO2 has higher sensibility toward ethanol and could be a very promising candidate for ethanol detection. As is known, the variation in resistance is mainly caused by the chemical adsorption and reaction of gas molecules on the surface of the sensing material.Reference Yamazoe62 SnO2 is a kind of an n-type oxide semiconductor material with electrons being the major charge carriers. When the aloe-like SnO2 sensor is exposed to air, oxygen molecules adsorb on the surface of SnO2 nanosheets and form oxygen ions (O−, O2−) by capturing electrons from the conductance band, leading to a high resistance state of aloe-like SnO2. Upon exposure to reductive gas such as ethanol here, the adsorbed oxygen ions (O−, O2−) react with the reducing gas, which releases electrons to the conduction band and leads to a rapid decrease of SnO2 resistance. After ethanol is removed, the resistance returns to the original value due to the re-adsorption of oxygen. It can be seen that the response/recovery toward ethanol is fast at a low concentration.
High response of the sensor to ethanol can be attributed to two aspects, unique hierarchical structure and large amounts of defects. First, the unique hierarchical structures of SnO2 assembled by the nanosheets offer abundant active sites on the surface and provide favorable conditions for the adsorption of ethanol due to the loose morphology of the aloe-like microstructures. When the SnO2 are exposed to ethanol gas, the gas can easily spread inward the sensing body, which is beneficial to diffuse ethanol gas, further induces a higher response. Hence, the unique aloe-like microstructure assembled by nanosheets is an important factor to the gas sensing property. Besides, a large amount of surface defects exist in the aloe-like SnO2 nanostructure [Fig. 1(d)], boosting the adsorption and reaction of ethanol. We believe that both reasons are the dominating parameters causing the high response to ethanol for the nanosheets assembled microstructure. More detailed evidence and qualitative explanations are needed for further investigation.
IV. CONCLUSION
A novel 3D multipole SnO2 nanoarchitecture self-assembled by nanosheets with rough surfaces was successfully synthesized with a one-step hydrothermal method at 160 °C. The probable growth mechanism was put forward to illustrate the self-assembly of the nanostructure. The structures of the SnO and Sn3O4 significantly narrowed the band gap from 3.6 to 2.7 eV. In addition, the sensing performance of the sensor based on the as-obtained SnO2 was investigated. The sensor fabricated from these hierarchical structures exhibits excellent sensing properties to ethanol at relative low operating temperature. The sensor response is about 7.46 toward 100 ppm ethanol at 360 °C. These results suggest that our sensors might have great potential to fabricate highly sensitive and low power consumption ethanol gas sensors.
ACKNOWLEDGMENT
We appreciate the financial support of the National Natural Science Foundation of China (Grant No. 61373072).