In recent decades the European agricultural sector has experienced a significant decline in farm numbers, particularly in dairy farming. In Flanders, the northern part of Belgium, the number of dairy farms fell from 27 663 in 1984 to 8862 in 2005 and was accompanied by a major change in the distribution of farm size, related processes that are referred to as structural change (Goddard et al. Reference Goddard, Weersink, Chen and Turvey1993). In dairy farming, this structural change has been greatly influenced by the milk quota system, which was introduced in 1984 and limits total dairy production within each member state. Studies, such as Bailey (Reference Bailey and Coleman2002) and Alvarez et al. (Reference Alvarez, Arias and Orea2006) analysed the link between structural change and the milk quota system and confirmed that the quotas had an important impact on the structural evolution of the dairy sector. The impact of different types of quota trade policies can usefully be studied by analysing the case of one member state (or part thereof) that has implemented several quota policies, as has been the case in Flanders.
The Flemish quota transfer system can be divided into three periods. At the start, in 1987/88, a rather liberal system of quota transfers was introduced, which allowed quota transfers between farmers as well as the merging of farms. From 1996/97, free quota mobility between farmers was forbidden and quota transfers were only possible through a centrally organized quota fund, by taking over an existing farm or establishing a new farm. A third period started in 2004/2005 in which free mobility was again allowed, albeit in a slightly more regulated way than in the first period (Jespers et al. Reference Jespers, Campens, Bas and Elst2006).
Although there is widespread agreement that the agricultural production structure has changed, there is less consensus on the implications of these changes (Goddard et al. Reference Goddard, Weersink, Chen and Turvey1993). Weersink & Tauer (Reference Weersink and Tauer1991) found that these structural changes lead to increases in productivity. However, to the best of our knowledge, the effect of structural change on other aspects of the sector, such as milk quality, has hardly been examined. The objective of this paper was to analyse the relationship between quota policy and structural change and the impact of these successive changes on milk quality parameters. Thus this research aimed to contribute to the literature by focusing on the role of the different quota trade policies on structural change and aggregate milk quality.
Materials and Methods
Markov analysis
Markov models are useful for analysing the evolution of systems (Mohapatra et al. Reference Mohapatra, Rozelle and Goodhue2007). An overview of Markov analysis applications in the agricultural sector is given by Zepeda (Reference Zepeda1995a,Reference Zepedab). In studies analysing structural development, the changes in farm-size distribution in the dairy sector are often examined in terms of changes in herd size (Zepeda, Reference Zepeda1995a; Bailey, Reference Bailey and Coleman2002; Colman et al. Reference Colman, Burton, Rigby and Franks2002). However, in this study we used quota size as a measure for farm size as this in combination with herd size allowed us to take into account changes in cow productivity.
Markov analysis describes the probability of a farm moving from one particular state (quota size category) to another. These transition probabilities are then used to describe the growth of farms and entry and exit behaviour. A Markov analysis can be either stationary or non-stationary. The stationary Markov process assumes that transitions between size categories are proportional to the numbers of farms within the size categories, while in a non-stationary Markov process the transition probabilities can vary over time.
The non-stationary approach is useful when there are no direct recorded observations of the transitions, but where these are estimated using additional available economic information (as in Zepeda, Reference Zepeda1995a) or when the economic factors that can influence movements have to be filtered out from the transition probabilities [as in HallBerg (Reference Hallberg1969), Macmillan, Tung & Tulloch (Reference Macmillan, Tung and Tulloch1974) and Zepeda (Reference Zepeda1995a)]. The present study adopted a stationary Markov process because of its simplicity, the availability of information about the exact number of transitions, and the absence of additional economic information.
The stationary Markov analysis assumes that the probability of transition between different states depends solely on the current and previous states. In a first-order Markov chain, the probabilities depend only on the current state, while higher-order Markov chains calculate the transition probabilities across different periods of time. The order can be determined by the Akaike Criterion (AIC) (for details see Cazacioc & Cipu, Reference Cazacioc, Cipu and Balan2005). The data used in this paper allowed a second order Markov chain, with the following notation for the transition probabilities:

Where X t the quota size category of the farm at time t; h,i,j=1,2,…n the indices of the quota size categories; p hij the probability that a farm moves from state h to state i to state j.
The second step in applying the Markov chain model to the data is to estimate the transition probability matrix (equation 2).
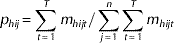
Where m hijt is the number of farms in Sh in period t−2 who moved to Si in period t−1 and to S j in period t.
The calculation of transition probabilities of equation 2, which was applied to the dataset containing the complete population, is also equal to the maximum likelihood estimator of the transition probabilities derived from studying a smaller sample (Anderson & Goodman, Reference Anderson and Goodman1957; Craig & Sendi, Reference Craig and Sendi2002; Hjort & Varin, Reference Hjort and Varin2008).
Dataset
The analysis was done on an anonymized database of individual farms (used for administrative purposes) which covered the entire population of 21 059 farms with 379 062 unbalanced panel observations running from 1988 to 2005). The dataset contains the quota size for each farm in each year. In order to analyse the relationship between quota trade policies and structural changes, the following categories of quota size were constructed:
— State 1: 0–100 000 kg;
— State 2: 100 000–200 000 kg;
— State 3: 200 000–300 000 kg;
— State 4: 300 000–400 000 kg;
— State 5: 400 000–500 000 kg;
— State 6: >500 000 kg.
Policy simulation
The impact of quota trade policies on the changes in farm size distribution was evaluated by comparing the calculated transition probabilities within two time periods (both represented by milk quota regulations). The first period is called ‘free mobility’, when free mobility of quotas between farmers was allowed (1987/88–1995/96). The second period (1996/97–2003/04) is called ‘restricted mobility’ and considers the situation when (with some minor exceptions) free mobility was forbidden. A transition matrix was calculated for both regulatory periods. The third (current) period of Flemish quota policy (from 2003/2004), again with free mobility, is not considered, because the currently available data of 2 years is not sufficient to estimate reliable transition probabilities.
The estimated transition probability matrix used in the Markov chain model simulations is the one proposed by Chavas & Magand (in Zepeda, Reference Zepeda1995a). They characterize the process as a function of net new entries (new entries minus exits) and movement between size categories. The net new entries in this paper are a function of the unfilled quota of existing farms.

Where n jt is the number of farms in state j in year t. The number of first-time entrants to state j in year t is expressed by d jt. The movements between size categories (states) at time t equals the transition probability P hijt times the number of farms making the transition from state h at time t−2 to state i at time t−1.
To simplify the analysis, the following assumptions were made: (1) the average quota size in each state is constant over time (based on actual figures from the period 1987–2005) and (2) the distribution of new entries into the different states is constant over time (based on the actual figures of the period 2003–2005).
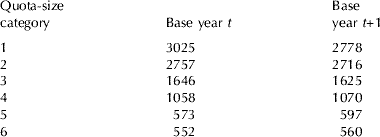
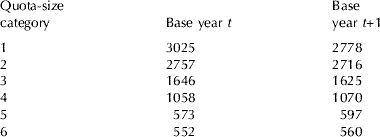
The simulation model starts from two given base years t (2003) and t+1 (2004), for which the true size distribution of the farms is known (Table 1).
Actual number of farms in base year t (2003) and base year t+1 (2004)
Milk quality
The effect of these changes in farm-size distribution on different parameters of milk quality was also simulated. The simulated distribution of the national quota per size category was used as the input for assessing future structural developments and the influence of quota transfer policy on aggregate milk quality. To predict changes in the average quality of milk over time, we calculated the mean values for each quality parameter within each quota-size category and multiplied it with the share of quota of the corresponding quota-size category.
The term milk quality covers microbiological, physiochemical and chemical attributes. The first of these includes the total bacteria count (TBC; cells/l), somatic cell count (SCC; cells/l) and coliform count (CC; cells/l). The physiochemical and chemical attributes considered in this paper as being related to structural change are the freezing point (FP; m°C), urea-N content (mg/l) and the concentrations of fat and protein (g/l).
Penalty point system
The production of high quality raw milk is of major importance to the economics of individual farm units and to the dairy industry as a whole (Al-Zenki et al. Reference Al-Zenki, Al-Mazeedi, Al-Hooti, Al-Atti, Al-Mutawah, Alomirah and Sidhu2007). A quality regulation based on the European Community directive 92/46/EEC (EC, 1992) is in place. This imposes penalty points on dairy farms whose milk does not meet certain specified standards. Each penalty point leads to a price deduction of €0.62/100 l from the monthly payment for milk delivered.
The penalty point system is based on five quality parameters (TBC, SCC, FP, sediments and disinfectants) and is an appropriate indicator for the overall milk quality from individual farms. The aggregate milk quality is measured in terms of penalty-litre-points, by multiplying the penalty points by the quantity of milk delivered by each farm. In the present analysis, this correction for the quality of milk is also done for each of the individual parameters.
Microbiological quality parameters
The two major parameters that describe the hygiene conditions on the farm are CC and SCC. According to Renau et al. (Reference Reneau, Seykora, Heins, Endres, Farnsworth and Bey2005), Rysanek & Babak (Reference Rysanek and Babak2005) and Wenz et al. (Reference Wenz, Jensen, Lombard, Wagner and Dinsmore2007) SCC is a good indicator of udder health in the herd, with a high SCC being one of the signs of mastitis, a bacterial infection of the mammary glands (Park et al. Reference Park, Koo, Kim, Hwang, Jung, Kim, Shin, Kim and Park2007).
Coliforms are a part of the intestinal microflora of animals and humans (Facklam et al. Reference Facklam, Martin, Lovgren, Johnson, Efstratiou, Thompson, Gowan, Kriz, Tyrrell, Kaplan and Beall2002) and their presence is generally considered to indicate faecal contamination of animal-derived food or poor hygienic conditions of food production (Kagkli et al. Reference Kagkli, Vancanneyt, Vandamme, Hill and Cogan2007).
TBC is indicative of a number of aspects of farm management, including the health status of the herd, farm sanitation (e.g. cleanliness of milking equipment) and the storage temperatures on the farm (Berry et al. Reference Berry, O'Brien, O'Callaghan, Sullivan and Meaney2006). Campylobacter sp., enterohaemorrhagic strains of Esherichia coli, Salmonella sp. and Yersinia sp. have been observed in bulk milk samples and, unlike SCC, are often implicated in milk-borne outbreaks of disease (bacterial infections after milking). While SCC is principally an indication of the udder health and the hygienic environment of the cows, TBC is a better indicator of the hygienic handling of milk.
Physiochemical and chemical attributes
In general, milk normally freezes at about −0·522°C, although the interpretation of FP data can vary due to slight regional and seasonal variations and milk-handling factors (Rattray & Jelen, Reference Rattray and Jelen1996). FP in excess of −0·510°C indicates that the milk is diluted with water.
Sediments indicate insufficient cleansing of the udder and surrounding area. Disinfectants are necessary for keeping the milk installation free of bacteria, but can contaminate the milk if the installation is not properly rinsed with clean water.
Milk urea-N (MUN) is an indicator of protein utilization and increases with excessive feeding of protein. Therefore, MUN has become a good management tool for monitoring the use of protein and for improving milk quality (Jonker et al. 2002a,b).
Finally, the fat and protein contents (in g/l) of the milk are also described in the analysis. These two nutritional components determine the price that the farmer receives for the milk (Wu et al. Reference Wu, Wang, Zhang and Xu2007).
Data
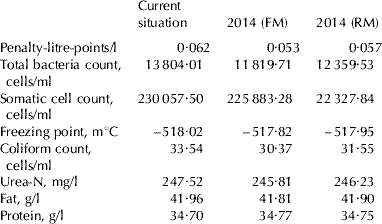
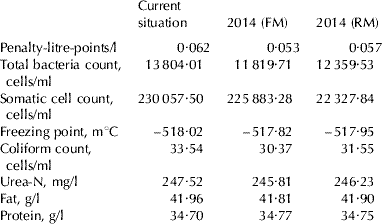
In Flanders, milk quality data are gathered and stored by ‘Melkcontrolecentrum Vlaanderen’ (MCC). The mean values of each variable in this dataset are given in Table 2 (current situation). The dataset contains, for each farm (n=7892) and each month (n=16) (in the period June 2005–September 2006) the delivered volume of milk, the penalty points and the results of the seven quality parameters (in total 116 883 observations).
Average milk quality parameters for the Flemish dairy sector in the current situation (2005) and simulated for 2014 under the assumptions of free mobility (FM) and restricted mobility (RM)
Results
Effects of policy regulations on structural change in the Flemish dairy sector
The first part of the analysis focuses on the impacts of policy on structural change. During the period of free mobility, the number of farms dropped annually by 6·22%, but fell by only 3·07% during the period of restricted mobility.
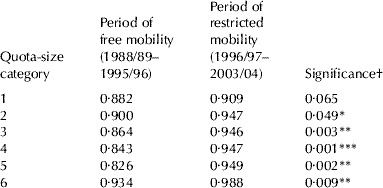
Table 3 gives the mean probability of remaining in a state during each policy measure, broken down into each size category. For every state, the probability of non-mobility is higher in the period of restricted quota mobility. It can therefore be concluded that the choice of policy has a significant influence on the transition probabilities and, as a result, on the rate of change in farm quota-size distribution.
The mean probability of non-mobility (during three successive years) per quota size category and per policy period (free and restricted mobility)
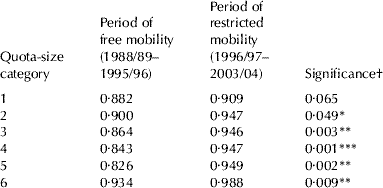
† significance of the independent t test between period with free mobility and period with restricted mobility (*significance at the 0·05 level; **significance at the 0·01 level; ***significance at the 0·001 level)
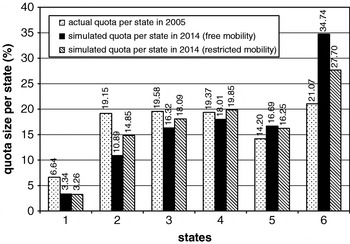
The transition probabilities, calculated for the two types of quota transfer policy, were used to make projections of the total number of farms, the size distribution of farms and the size distribution of the Flemish milk quota. It is clear that the trend of a declining number of farms will continue in the near future. Assuming free mobility, the number of farms is estimated to drop from 8862 farms in 2005 to 6725 in 2014. Assuming restricted mobility, the number of farms in 2014 will be 7·5% higher than this figure (7231). Besides a fall in the total number of farms, the distribution of farms between the different states also changes, which is reflected in the total quota per size category (Fig. 1). In 2005, more than a quarter (25·8%) of the total Flemish quota was in hands of smaller farms. By 2014, these farms will hold 14·2% or 18·1% of the Flemish milk quota under the assumptions of free mobility and restrictive quotas respectively. The larger farms, which now have a 35·9% share, will produce more than half (51·4%) of the total milk supply in 2014 (assuming free mobility) or 44·0% (assuming restricted mobility).
Distributions of the total quota per size category (state) for 2005 (present figures) and simulated in 2014 under the assumptions of free mobility and restricted mobility.

Effects of structural change on milk quality
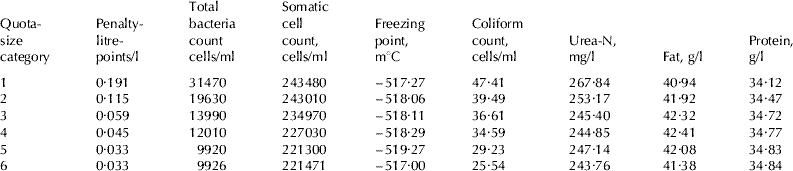
The simulated distribution of the national quota per size category was used as the input for assessing future structural developments and the influence of quota transfer policy on aggregate milk quality. To predict changes in the average quality of milk over time, we first calculated the mean values for each quality parameter within each quota-size category (Table 4). In general, milk quality, expressed in terms of penalty-litre-points per litre, is significantly higher on larger farms (P<0·01). The significant differences in milk quality between the different quota-size categories indicate that size – and therefore structural change – clearly do influence aggregate milk quality.
Milk quality parameters given per quota-size category (data of the period July 2005 until September 2006)
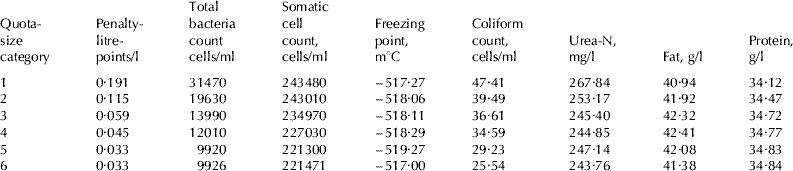
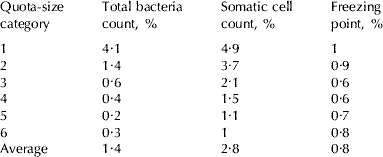
Larger farms show a significantly better performance (P<0·01) in all of the three indicators for microbiological quality parameters, TBC, SCC and CC. The difference in farm-size categories becomes even clearer when comparing the percentage of monthly milk quality standards violations (Table 5). Smaller farms exceed the milk quality standard for TBC 10-times more frequently than larger farms and do so 5-times more frequently for SCC.
Percentage of violations of milk quality standards by quota size (data from the period July 2005 to September 2006)
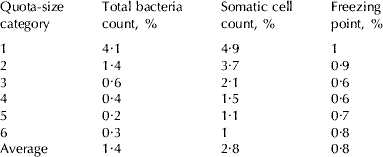
Data for FP in Table 4 and Table 5 show little difference between smaller and larger farms in terms of milk dilution. The norm is also relatively rarely exceeded (0·8%). However, there are differences in the average FP between the different quota-size categories (P<0·01), which can partially be explained by differences in fat content.
Results in Table 4 show that the largest farms also have lower MUN concentrations than the smaller farms (P<0·01). This could indicate that the larger farms manage the protein content of the feedstuffs more precisely.
The two nutrient parameters (the average fat and protein content of the milk) are also both linked with farm size (respectively, P<0·01 and P<0·01). The higher protein concentration observed on larger farms (P<0·01) combined with the lower MUN confirms that feeding high-level protein feed does not result in higher protein concentration in the milk. The fat concentration of the milk from the largest farms is significantly higher than that from the smallest farms, although the highest concentrations of fat are found in the middle-sized farms (size categories 3 and 4).
Effects of structural change on average milk quality
Table 2 (based on the figures in Table 5) shows the real average milk quality parameters for the Flemish dairy sector for 2005 and the simulated average milk quality parameters in 2014, under both policy conditions. It shows that the overall milk quality (expressed in penalty points per litre) will improve as a result of the structural changes. In 2005, milk produced in Flanders incurred on average 0·0665 penalty points per litre of milk. In 2014 this number will be very much lower. Under a policy of free quota mobility, 20% less penalty points are expected in 2014, while the restricted quota mobility policy induces a 14·3% reduction in penalty points. Thus the policy choice for a mobile quota system can create a difference in quality improvement of 5·7 percentage points.
Mobile quotas would induce structural changes in the dairy sector that would result in better aggregate performance. Average TBC would decrease by 18·0%, SCC by 2·1% and CC by 11·0% in comparison with current levels. Less notable improvements are found for protein content (+0·26%) and a slightly negative result for the MUN (−0·95%). FP does not noticeably change (−0·04%) under the mobile quota policy option and the average fat content would decline by about 0·29%.
The trends are broadly similar for all seven individual parameters under the restricted system, although the changes are less marked. The structural changes induced by such a policy would lead to a decrease of 14·2% in TBC, 1·5% in SCC, 7·5% in CC and 0·8% in MUN. Protein concentration only changes by 0·21% while the average fat concentration will only drop by 0·08%. The change in FP is limited to a decrease of just 0·01%.
Discussion
A Markov chain model was used to assess the impact of supply quota on structural changes in the dairy sector. The Markov chain simulations confirmed a concentration of production on large-sized farms, which implies an increase in the average quota size and a change in farm size distributions. These findings are consistent with the trends observed by Weiss (Reference Weiss1999) in upper Austria, by Zepeda (Reference Zepeda1995a) and Kim et al. (Reference Kim, Schluter, Schaible, Mishra and Hallahan2005) in the USA and simulated by Colman et al. (Reference Colman, Burton, Rigby and Franks2002) for the UK. The research also shows that policy measures have an impact on the rate of structural change and that structural development is higher during the free quota market period than under a more restrictive quota regime. This is caused by a gap in the demand for quota, since farms will only sell quota when the price they receive compensates for foregone profits in the future. A simulation of future policy options to 2014 shows significant differences under the options of a free quota mobility system and a restricted one, with a large difference in the number of farms (7·5% more farms in the latter case) and in the change of the size distributions of the Flemish quota (14·5% less quota for larger farms under the second scenario).
In turn, the trend of increasing average quota size and declining number of farms will influence the various milk quality parameters. In general, larger farms perform better in meeting the measured milk quality criteria. A positive relation exists between farm size and milk quality for most of the parameters that were taken into account, but the relationship is stronger for the three microbiological parameters (TBC, SCC and CC). The difference in farm-size categories becomes most clear when comparing the percentage of monthly milk quality standards violations (Table 5). Smaller farms exceed the milk quality standard for TBC 10-times more frequently than larger farms and do so 5-times more frequently for SCC. The difference is mostly related to milk handling, farm sanitation (e.g. cleanliness of milking equipment) and milk storage, since these parameters have most influence on TBC (Berry et al. Reference Berry, O'Brien, O'Callaghan, Sullivan and Meaney2006). The bacterial count is a measure of milk-borne bacteria and so the results indicate that the largest farms are better able to monitor and control the processes of milking and storage. The comparison of the number of milk quality standard violations also suggests that larger farms have better process controls to avoid contamination incidents than smaller farms.
Larger farms have on average higher-yielding cows, which are more susceptible to mastitis, and this could lead to higher levels of SCC (Burvenich et al. Reference Burvenich, Detilleux and Massart-Leen2000) but this higher level of susceptibility is more than compensated for by better farm management and hygienic conditions.
Thus the structural changes will have a positive effect on the aggregate performance for these three quality parameters. The most pronounced effect of structural change is observed in TBC where, with free quota mobility, the average level of TBC will drop by 18% in 9 years. This decline in levels of TBC would correspond to 49·5% fewer violations of quality standards.
The effect of structural change under free quota mobility on the average SCC is relatively small (an improvement of 2·1%) but would represent a reduction in violations of these milk quality standards of 43·5%. The improvements in the TBC and the SCC levels indicate that larger farms maintain better hygienic conditions. At an aggregate level the results show that the largest improvement in milk quality can be expected from the better milk handling and incidents prevention on larger farms. However, the positive effects of hygiene on SCC are likely to be somewhat offset by the higher mastitis susceptibility among high-yielding cows. By contrast, the likely structural changes in the dairy sector are likely to have quite limited effects on the physiochemical and chemical composition of milk.
The strong link between aggregate milk quality, structural change and quota exchange policies, which is the key observation of this paper, has some policy implications. The importance of milk quality for consumer confidence, for the food-processing industry and for farms themselves should convince policy makers to undertake an interdisciplinary review of the different policy options and to make an assessment of the consequences for aggregate milk quality.
This research was funded by the Institute for the Promotion of Innovation by Science and Technology in Flanders (IWT Vlaanderen).